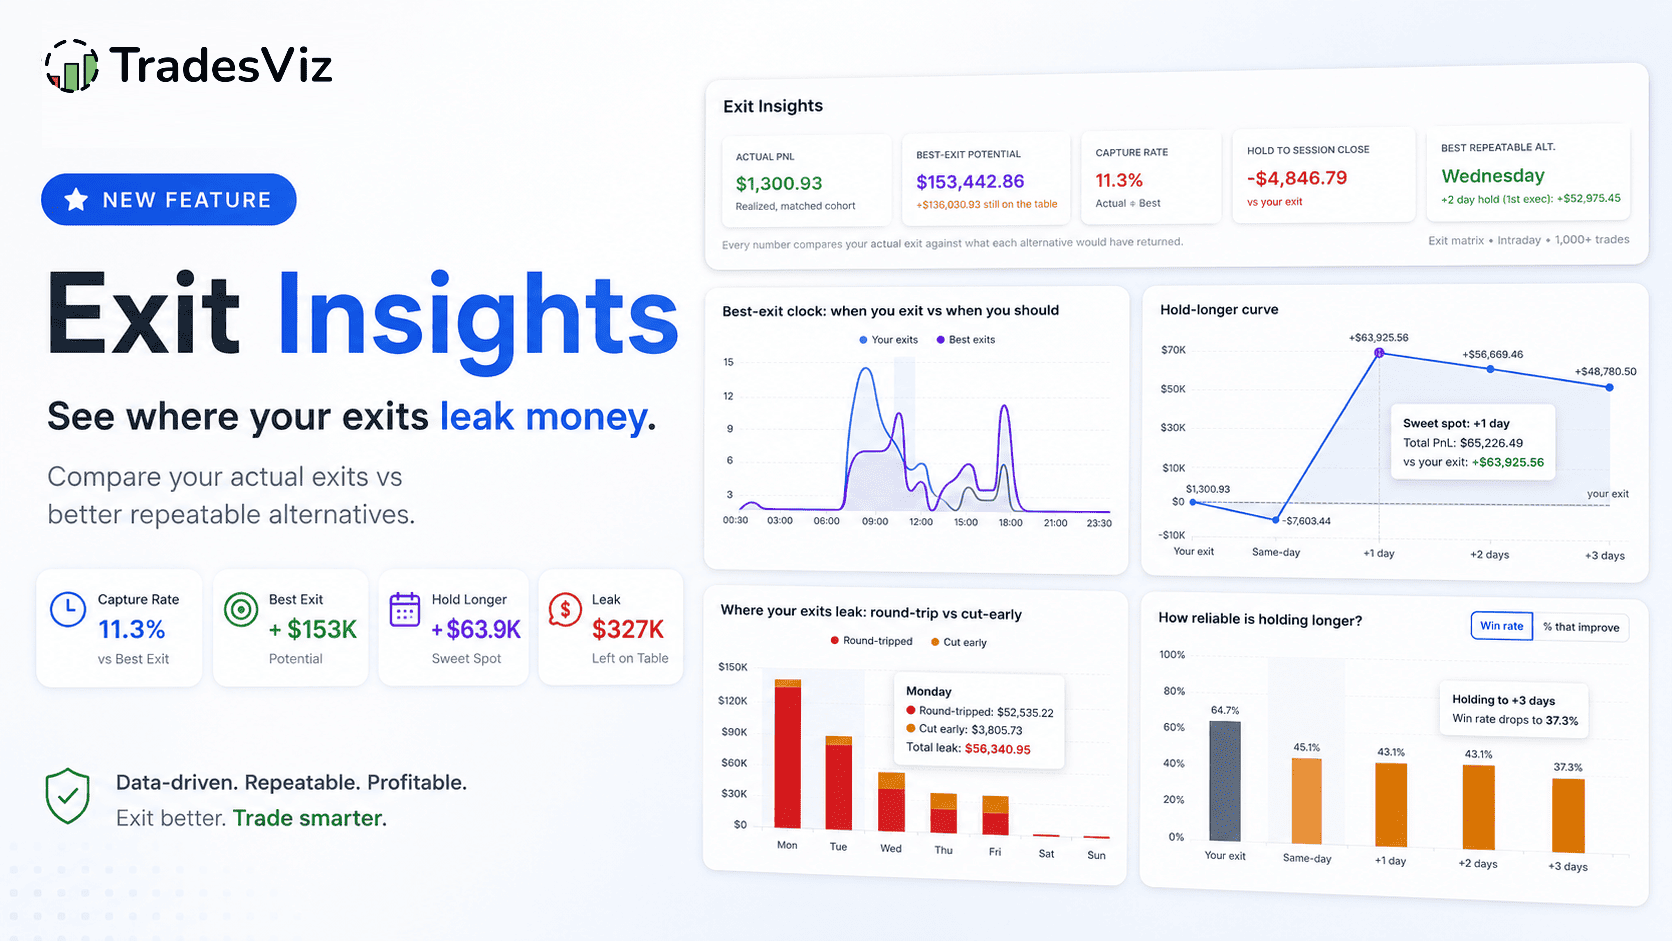
blog-post-image
By TradesViz On in Introduction

Comparing trading account performance: Account statistics in TaradesViz (v2.0 refresh)

The account statistics tab is a way to view and visualize 100+ KPIs across many trading accounts in TradesViz.


blog-post-image
By TradesViz On in General

Beyond Win Rate: Mastering Your Trading with R-Value and Profit Factor in TradesViz

This comprehensive guide explains how to calculate and analyze, and use R-value and Profit Factor in TradesViz using powerful features such as the General Statistics dashboard, Pivot Grid analysis, AI Query tool, and Custom Dashboards to identify your most profitable setups and optimize your trading strategy.


blog-post-image
By TradesViz On in General

TradesViz v2.0 Android and iOS mobile app update!

A complete revamp of the TradesViz mobile app with new features, faster UI, and more!


blog-post-image
By TradesViz On in How-To

New Ways to Visualize Your Trades: Practical Examples Using Grids in TradesViz Trading Journal (AI, Pivot & More)

We've had a lot of new types of analysis created from the grids and charts of TradesViz over the years. We just launched an update to the no. of chart types you can make - this greatly improves the utility of pivot grids and the AI widgets! This new list includes box plots, treemaps, waterfall charts, range bars, and more!


blog-post-image
By TradesViz On in How-To

Combining Pivot grid + Trade plans for 100% custom defined and calculated statistics

Learn how to generate custom stats, and use those custom stats to calculate and create calculated custom stats - the first time in an online trading journal! All of this is possible within TradesViz with pivot grids' new improvements related to custom columns and trade plans!