#1 RANKED
Online Trading Journal with AI Insights & Analytics
AI-Powered Trading Journal that helps you improve performance track every trade reduce mistakes find trade ideas automate trade tracking practice trading
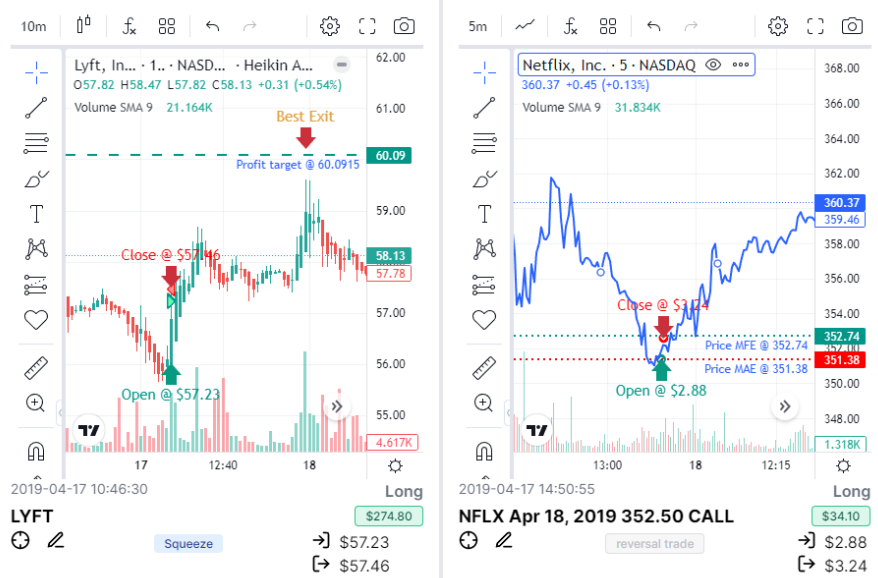
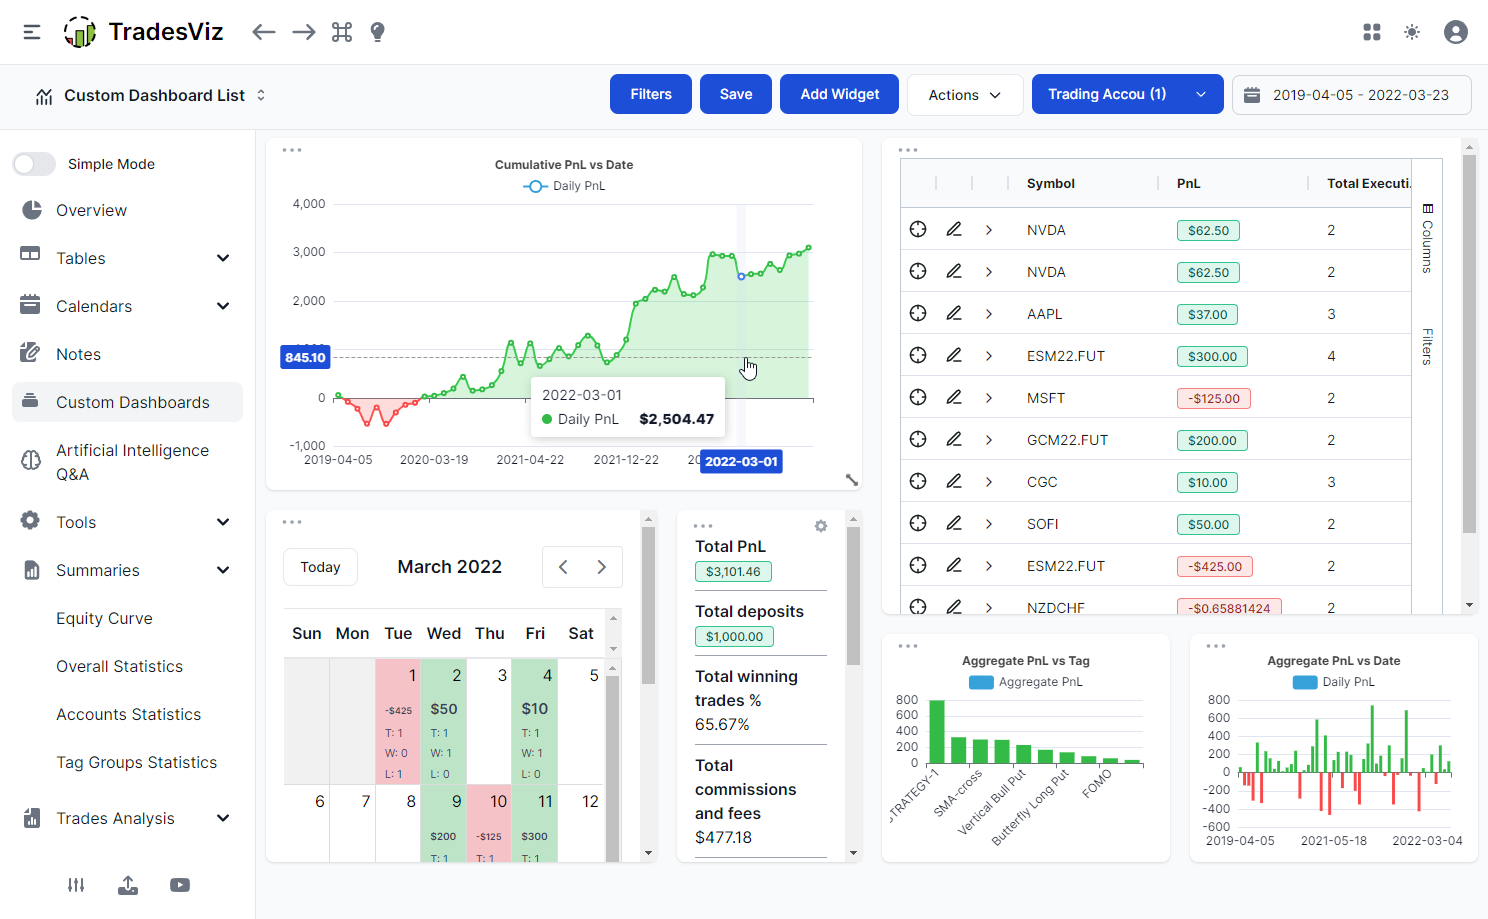
- The most advanced trading journal with 600+ statistics, AI-powered insights and broker auto-sync to systematically increase your edge.
- Proven performance increase with our trading journal trusted by over 150,000+ traders worldwide. USA, India, Canada & Australia Exchanges in addition to global indices, forex and cryptocurrency are supported!
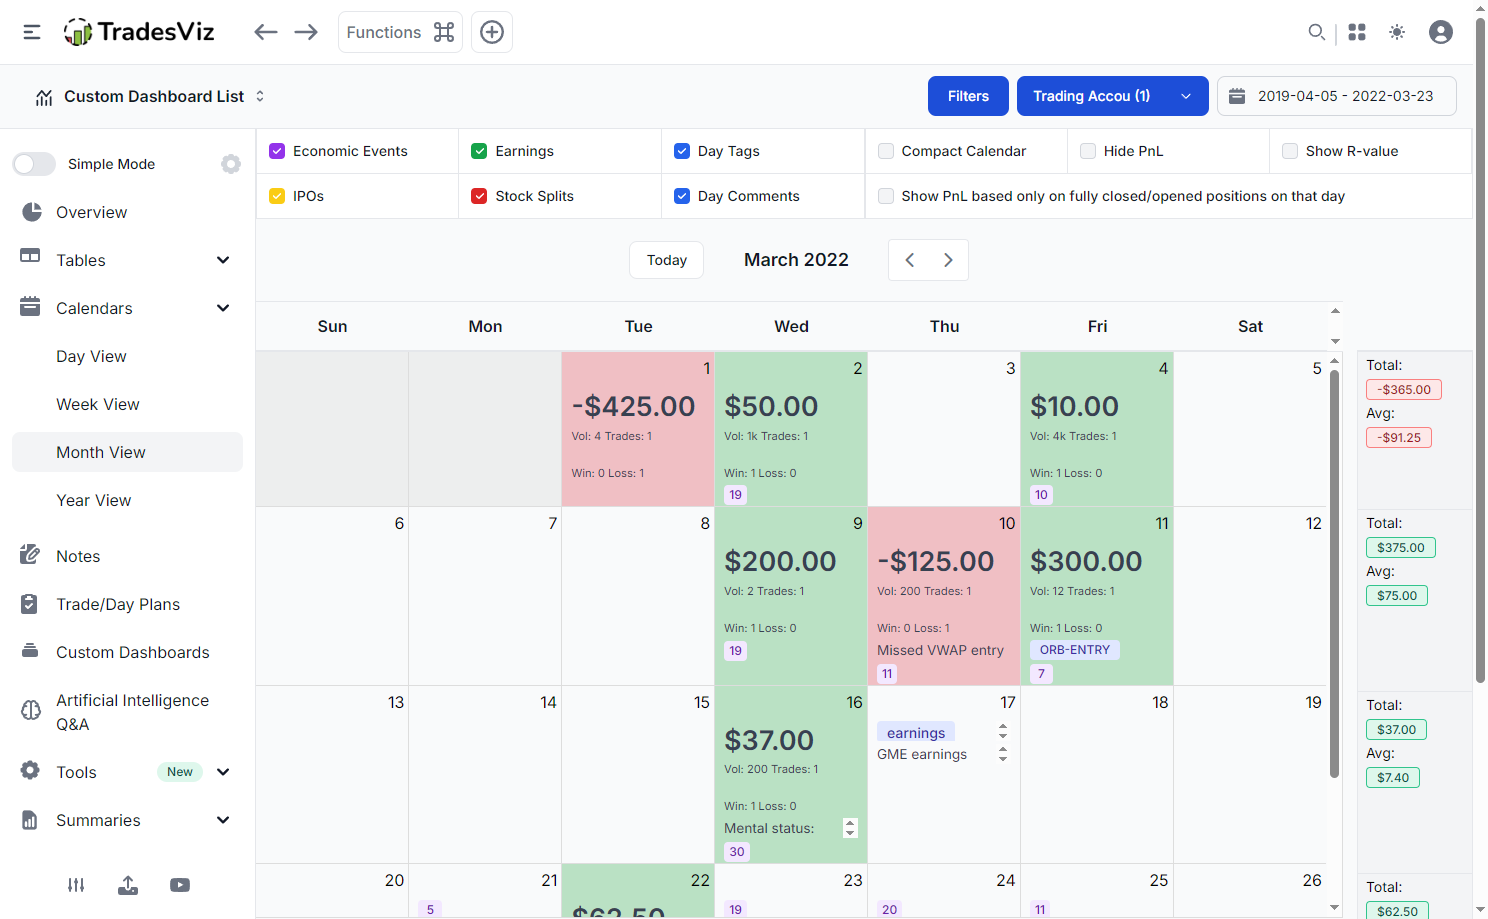
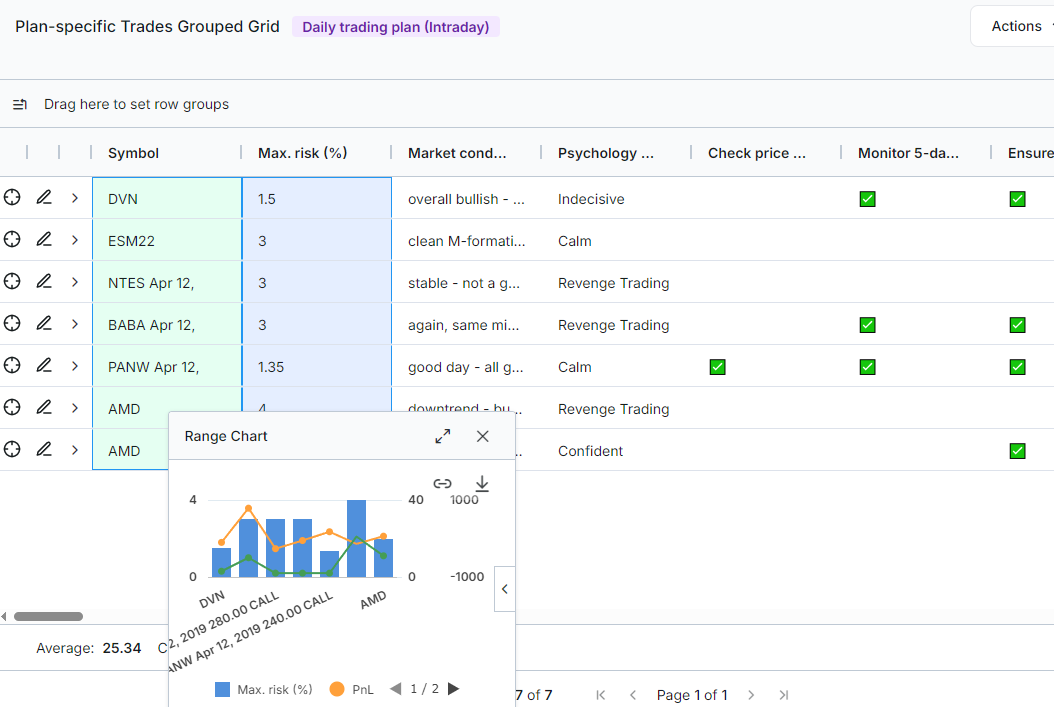
- Cultivate productive routines with integrated suite of trading tables, daily planners, dividend trackers, and calendars.
- Auto-sync trades + A.I. analytics + features you will NEVER find in any other journal.
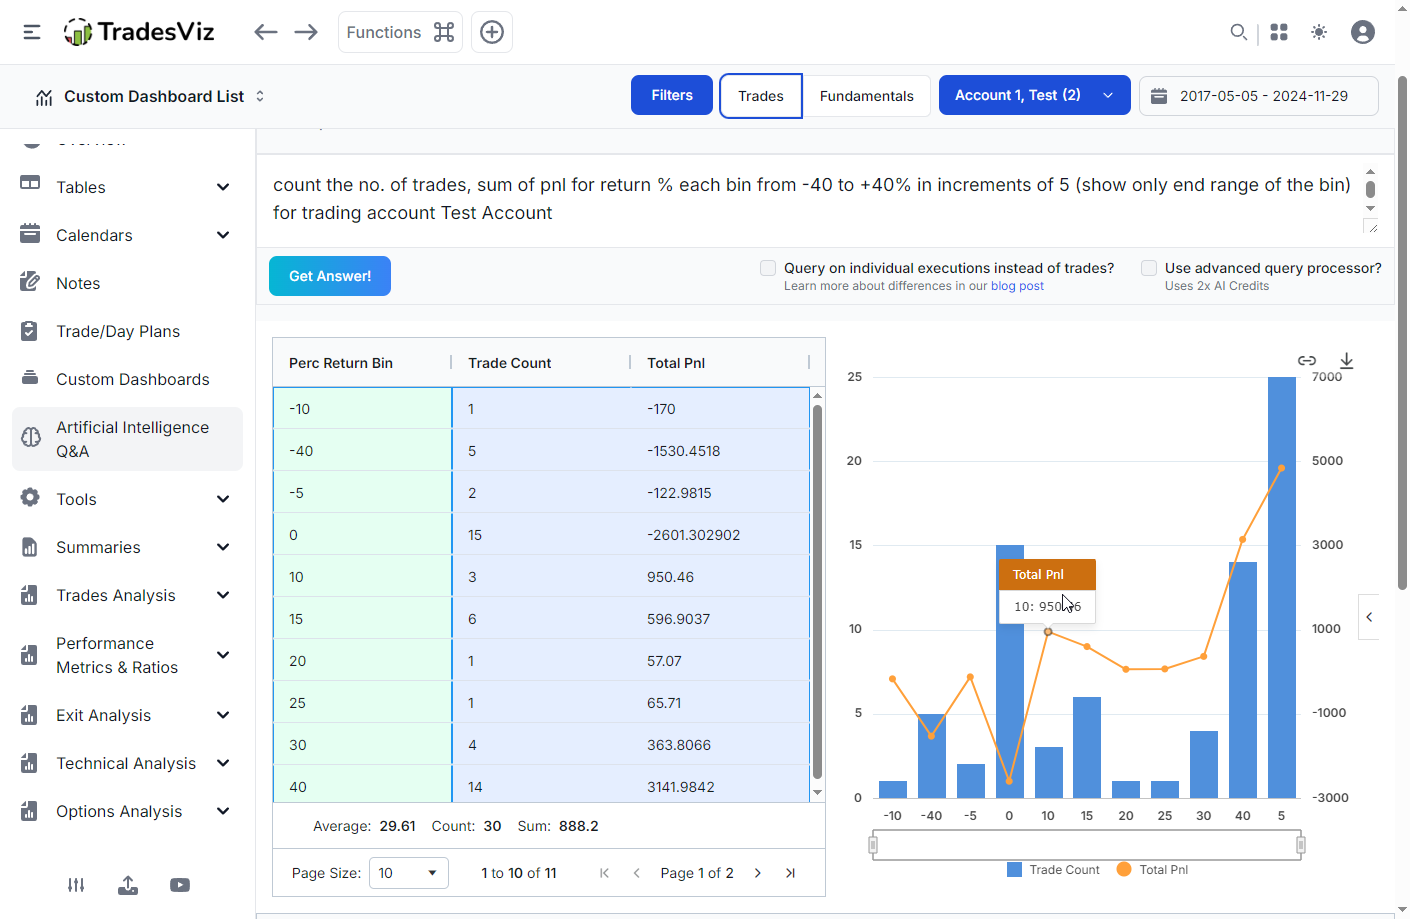
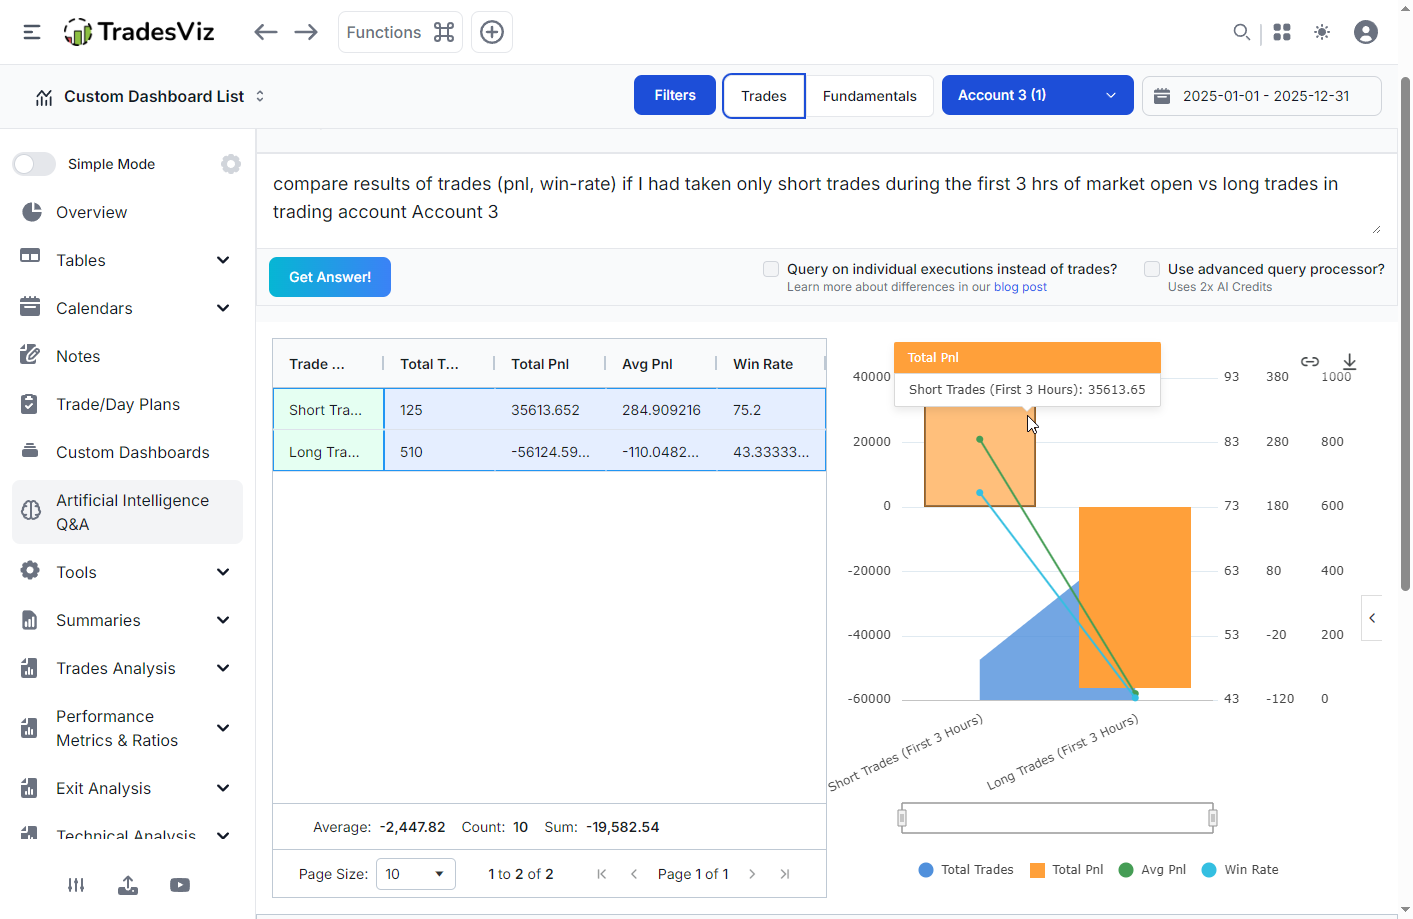
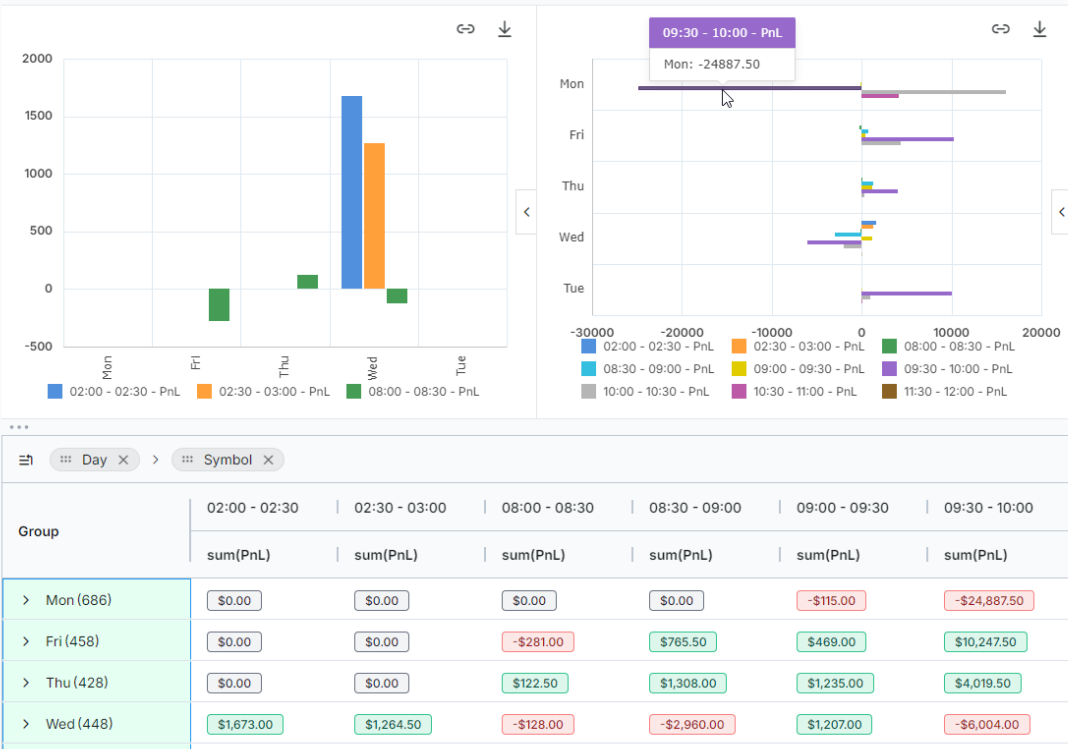
AI Analytics
Query your trading data in plain English
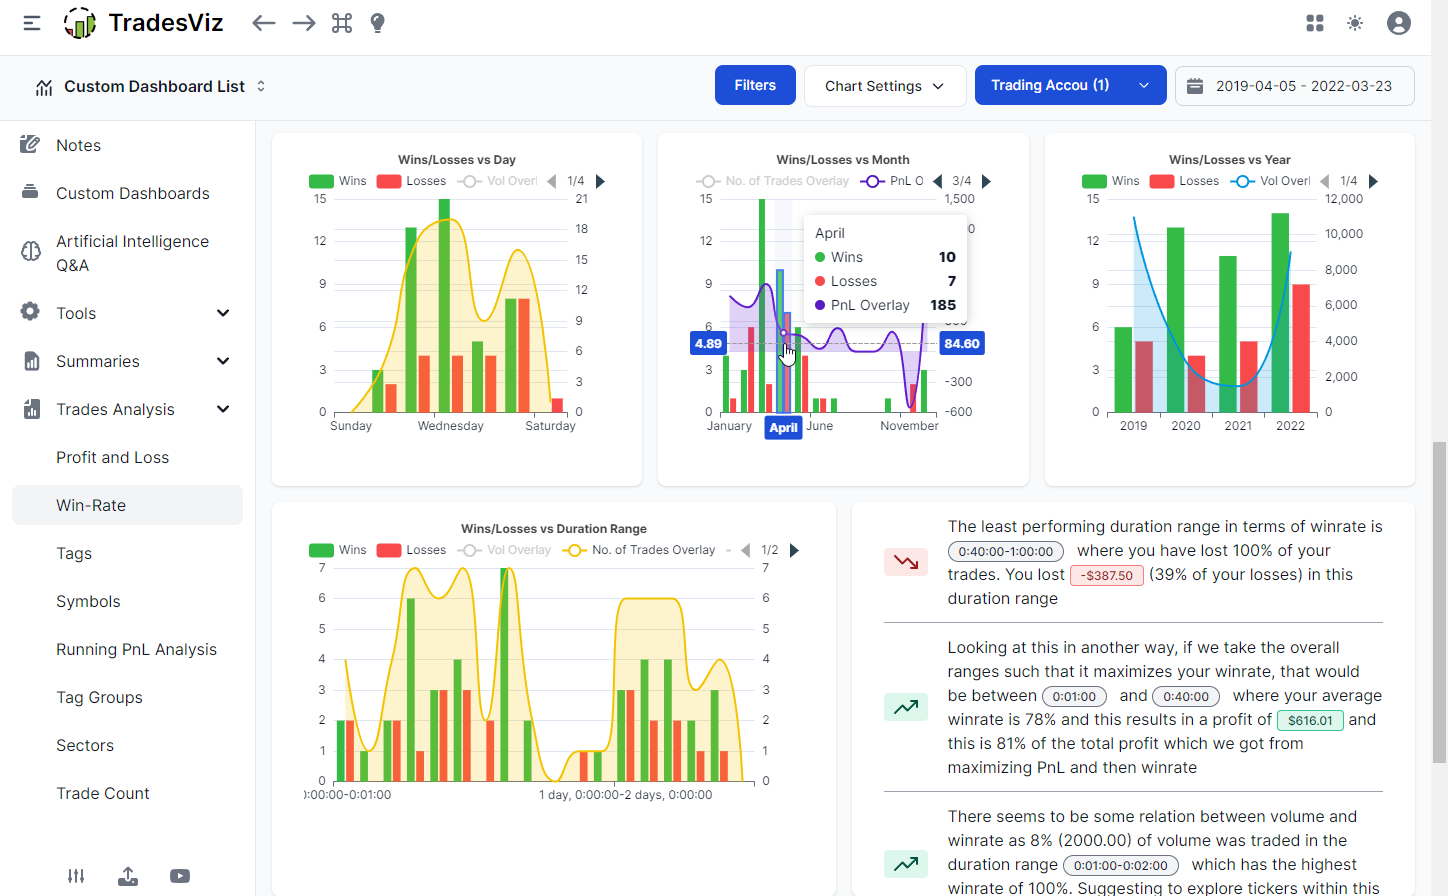
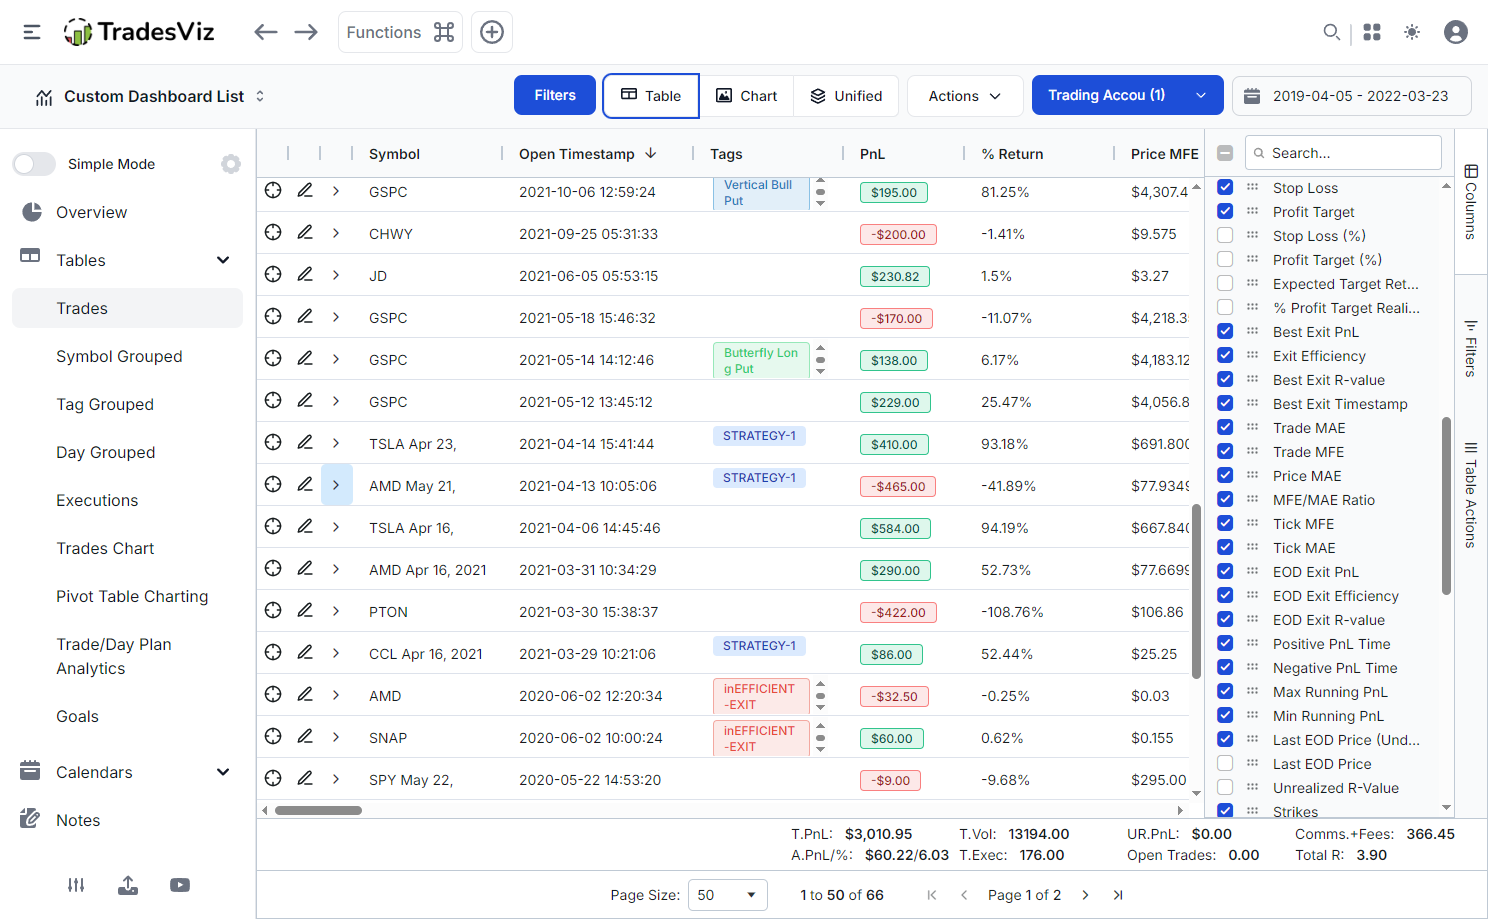
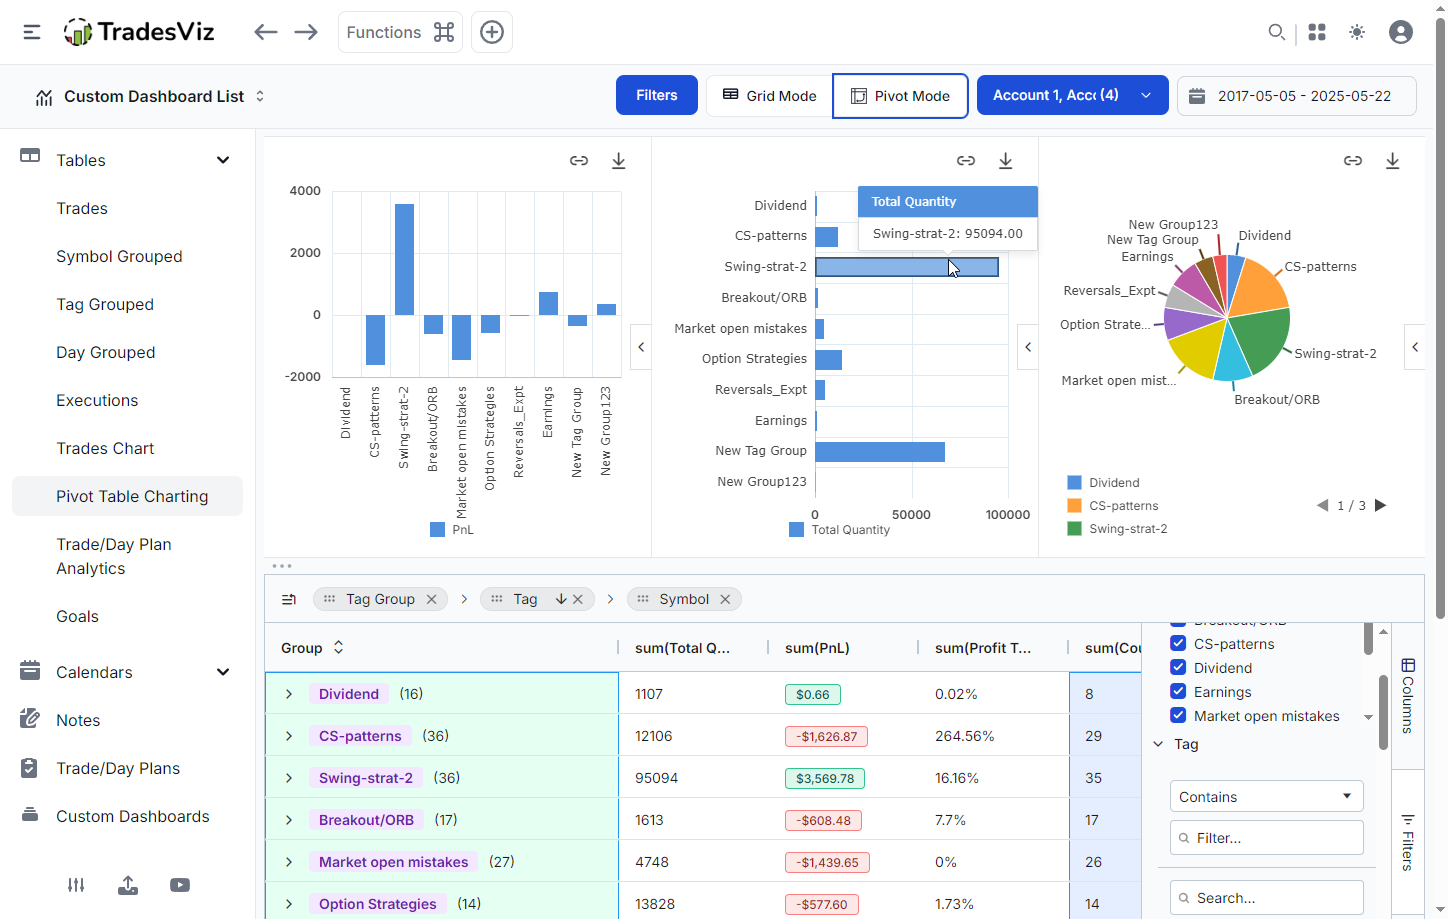
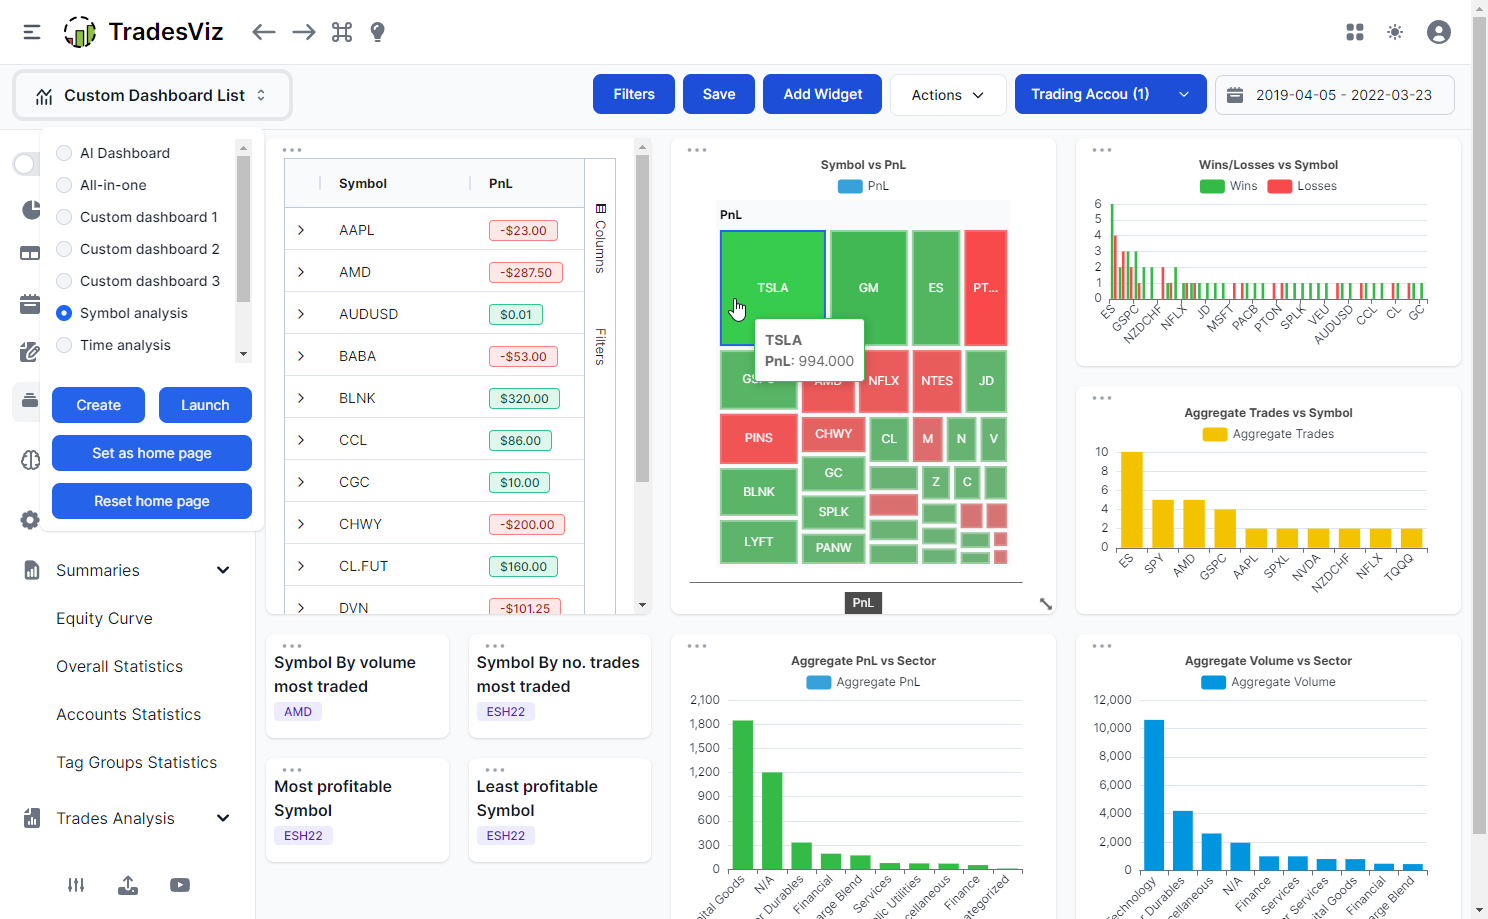
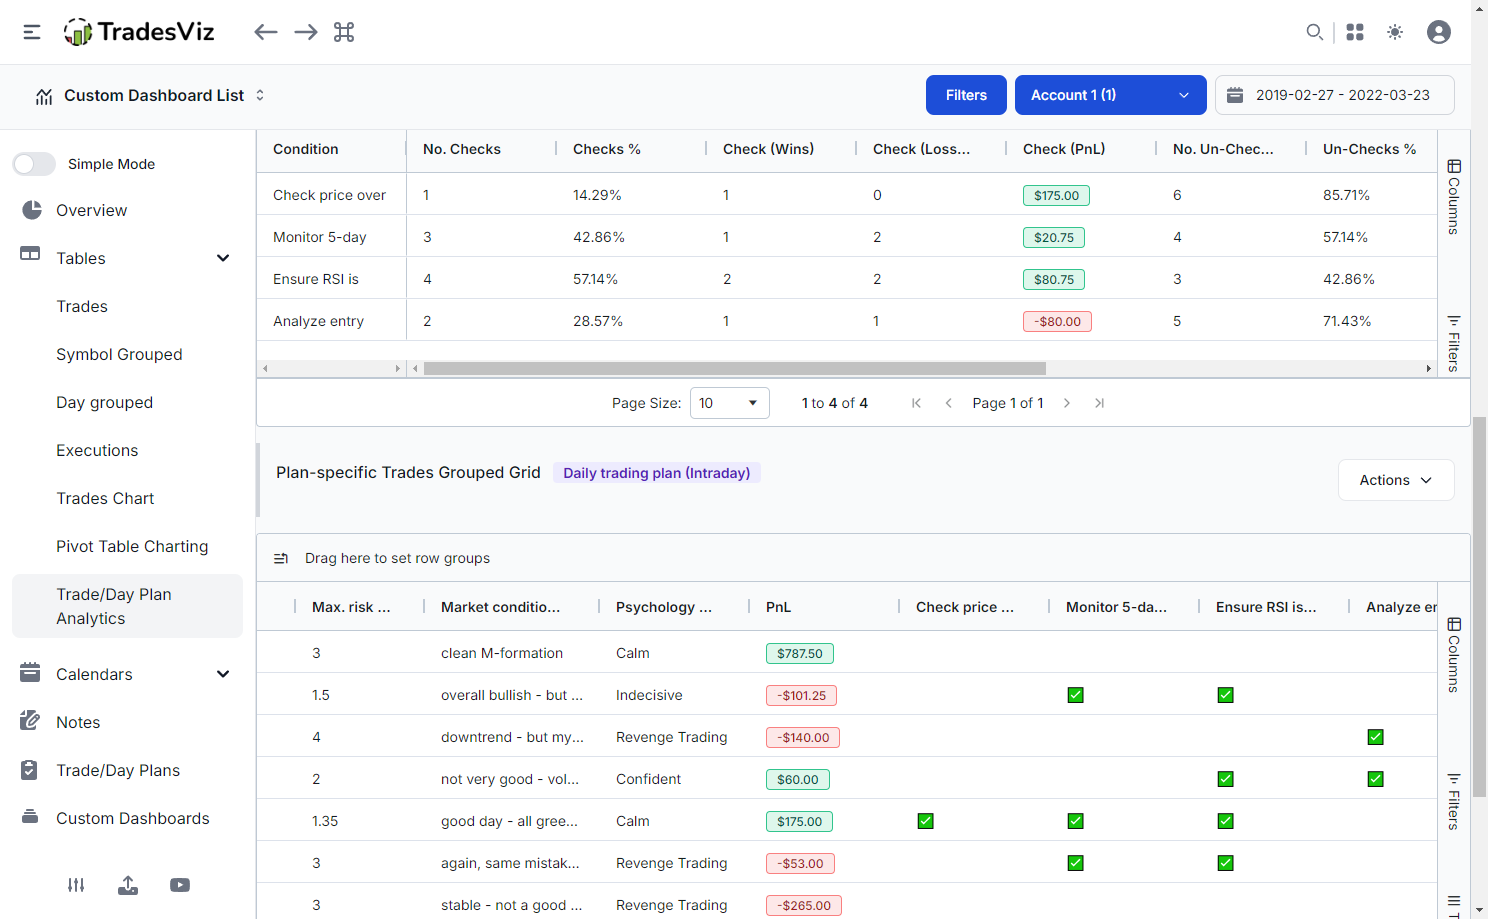
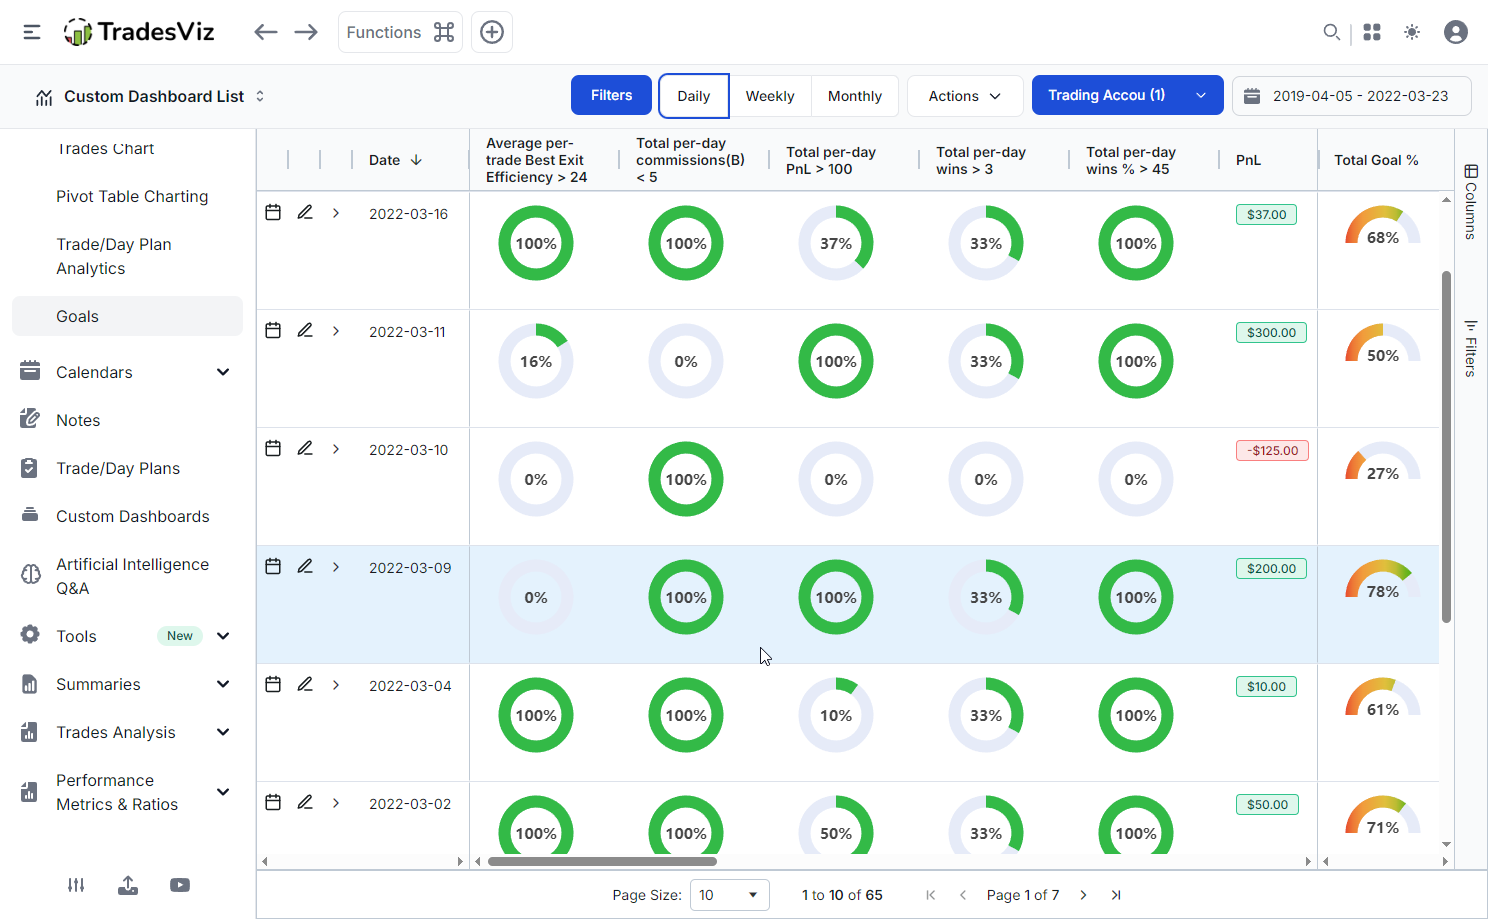
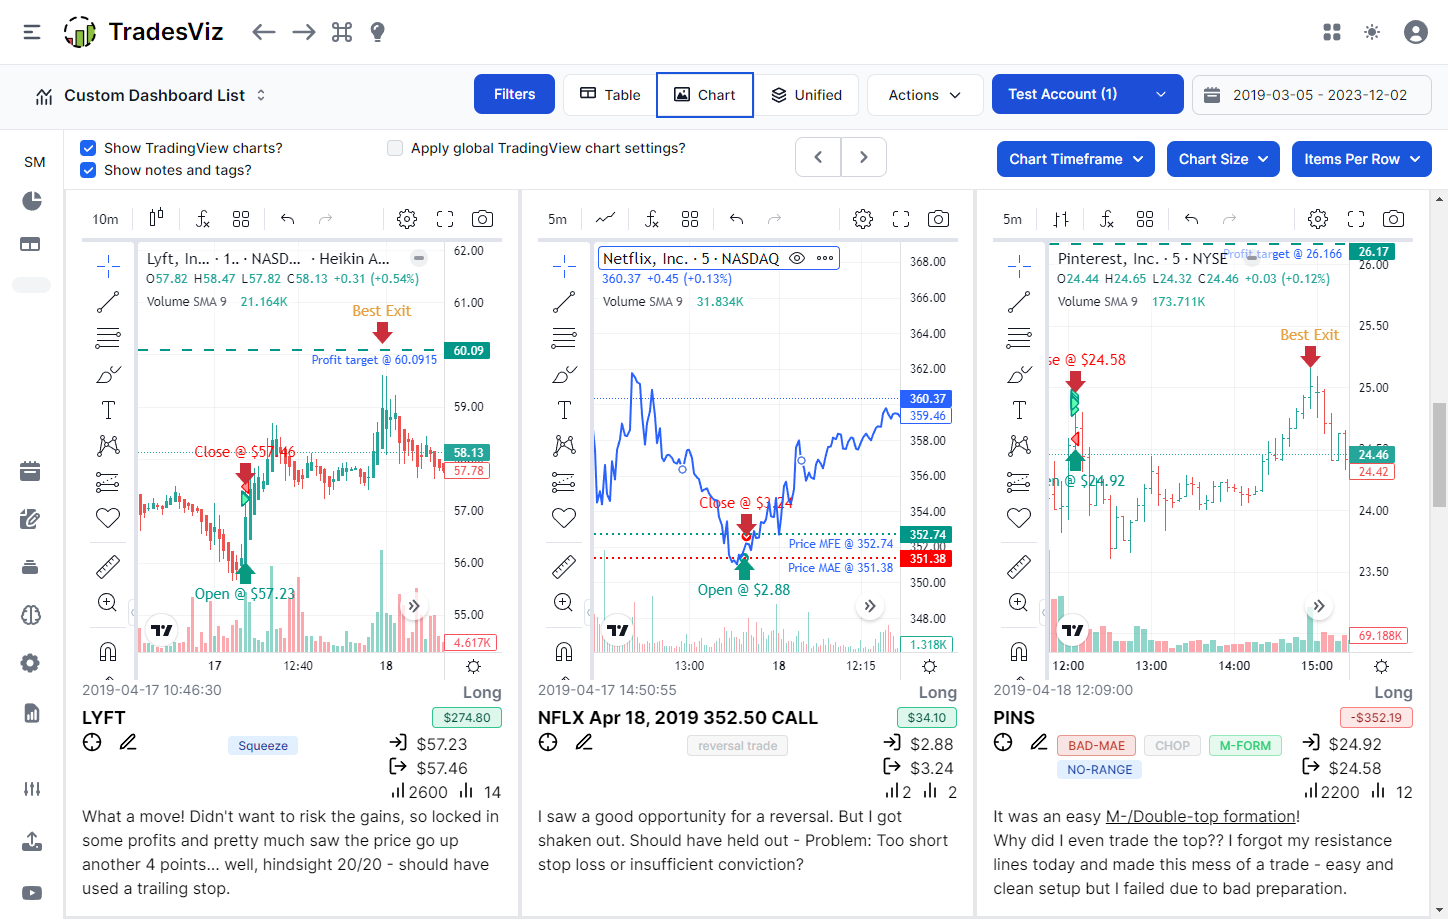
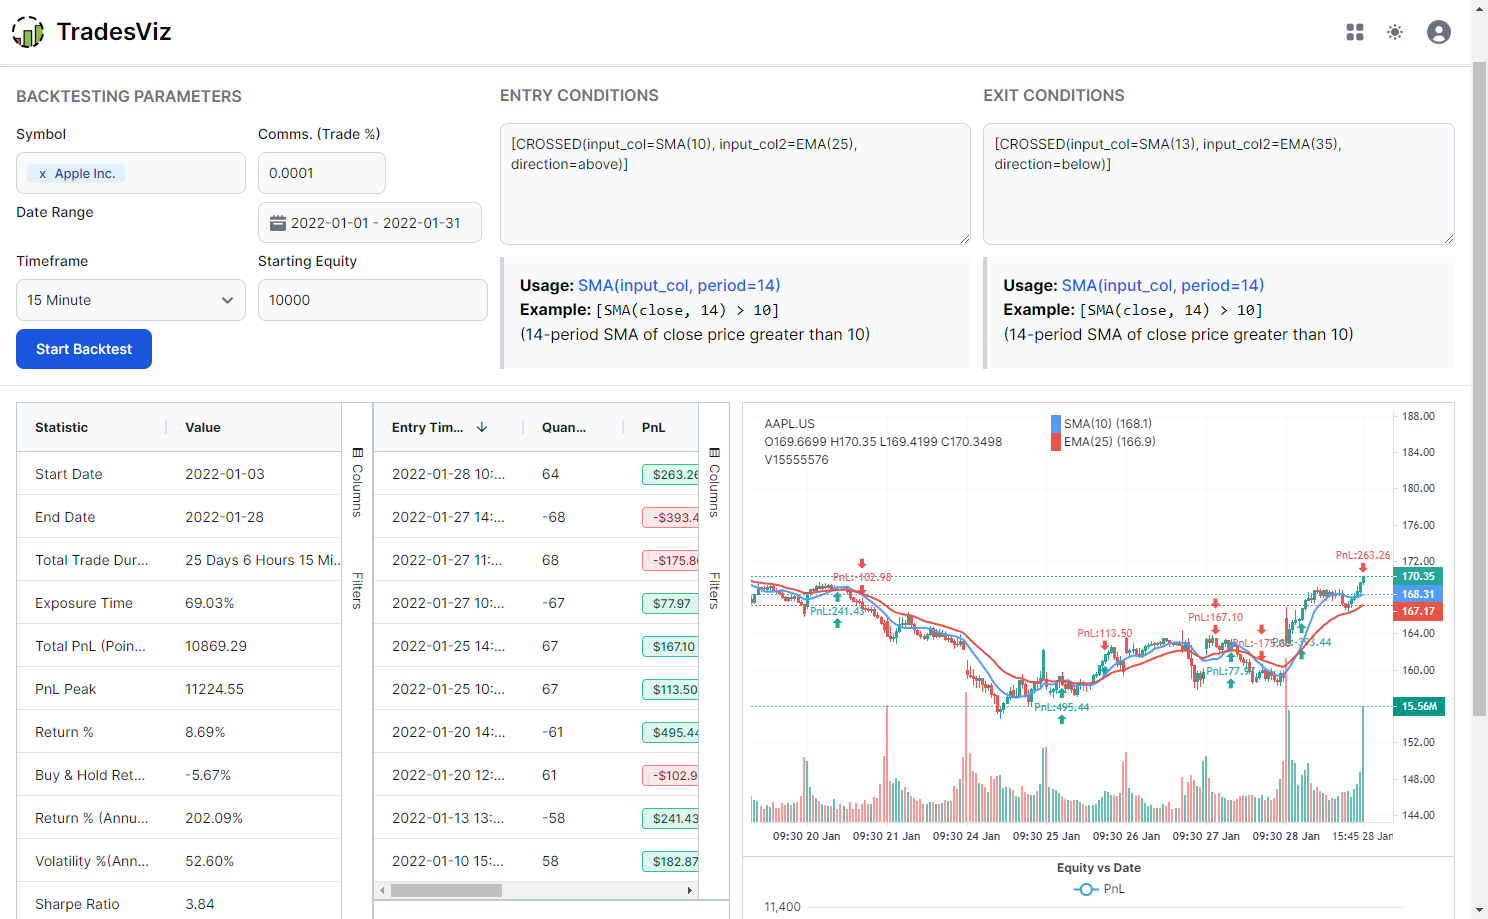
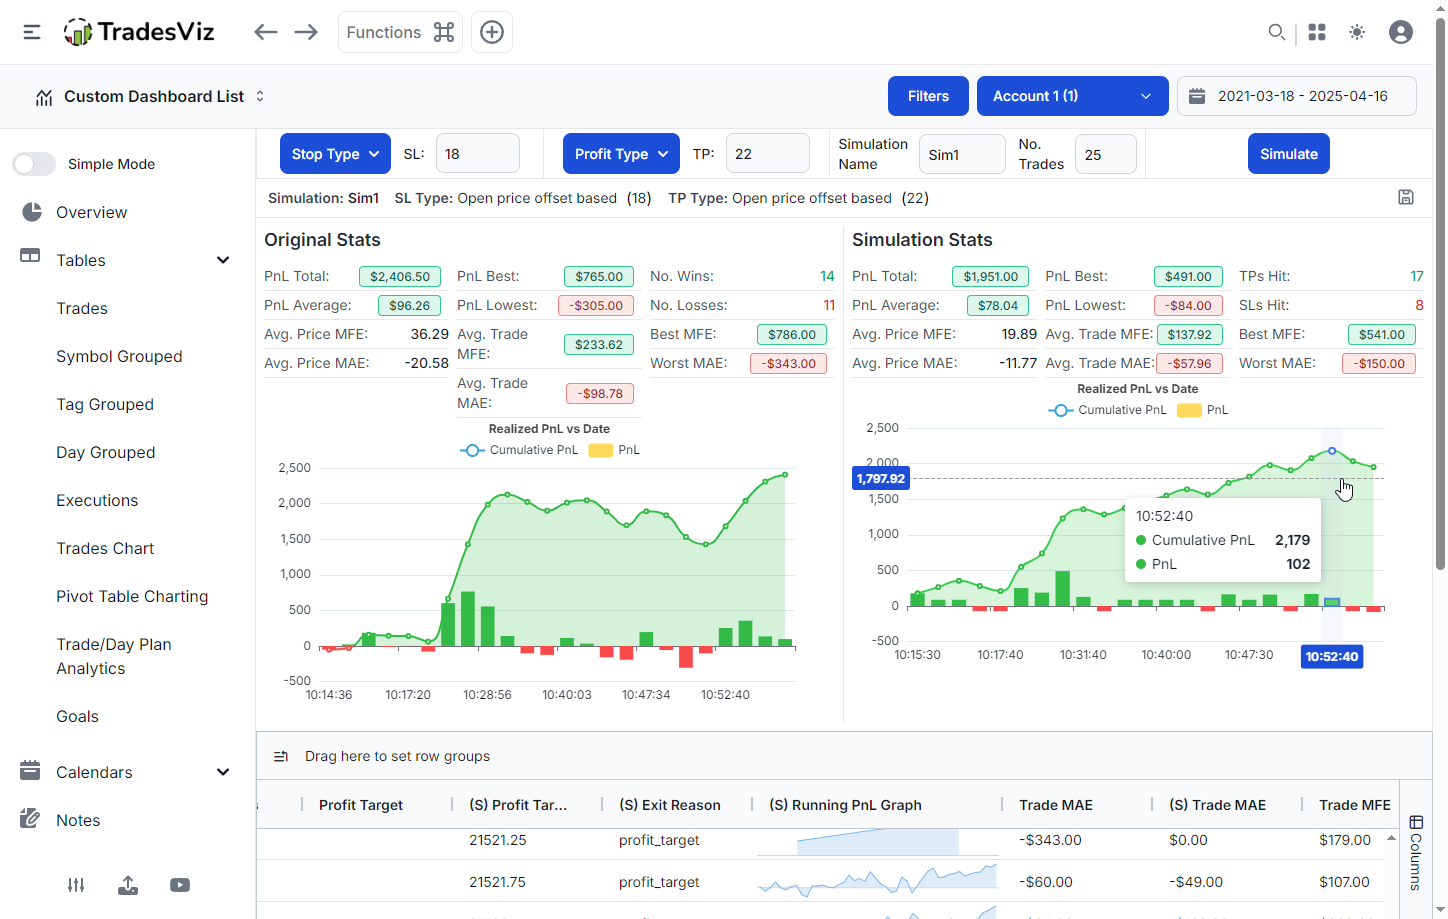
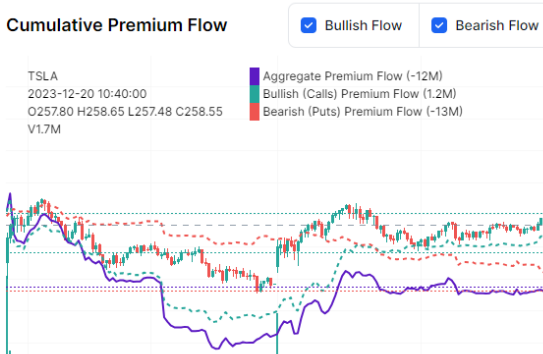
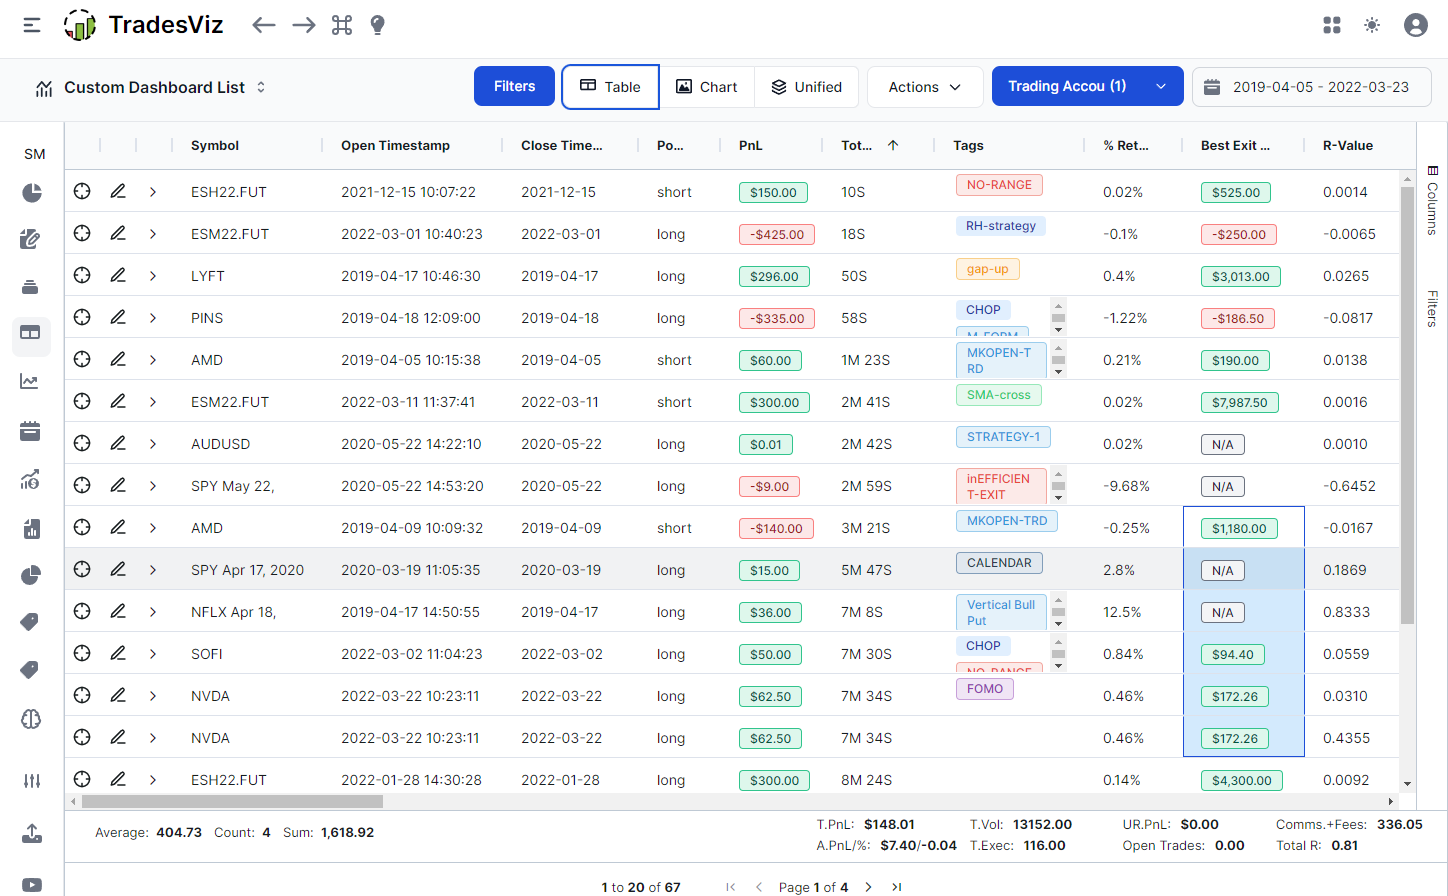
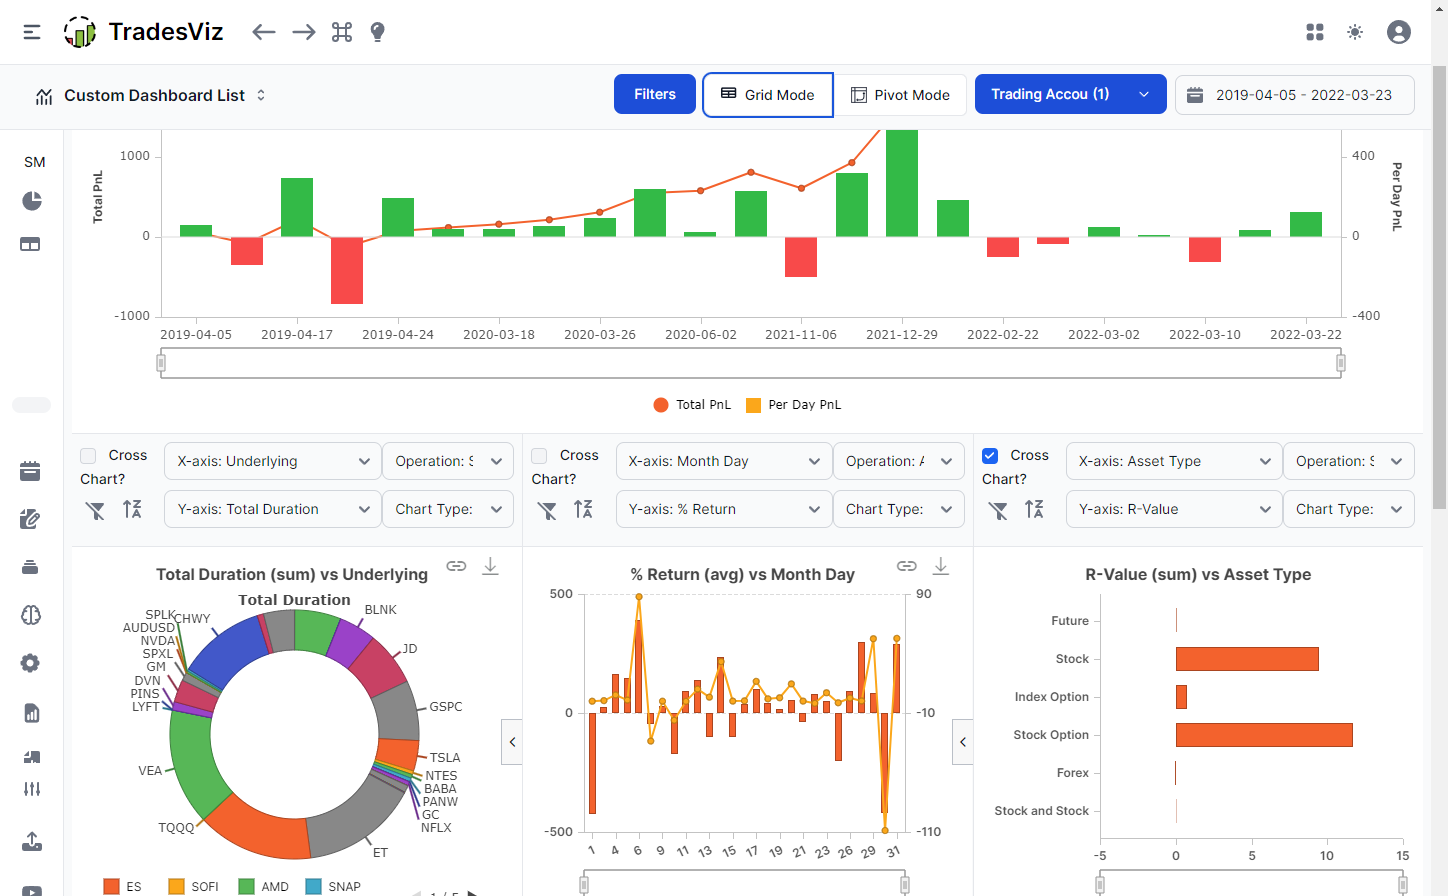
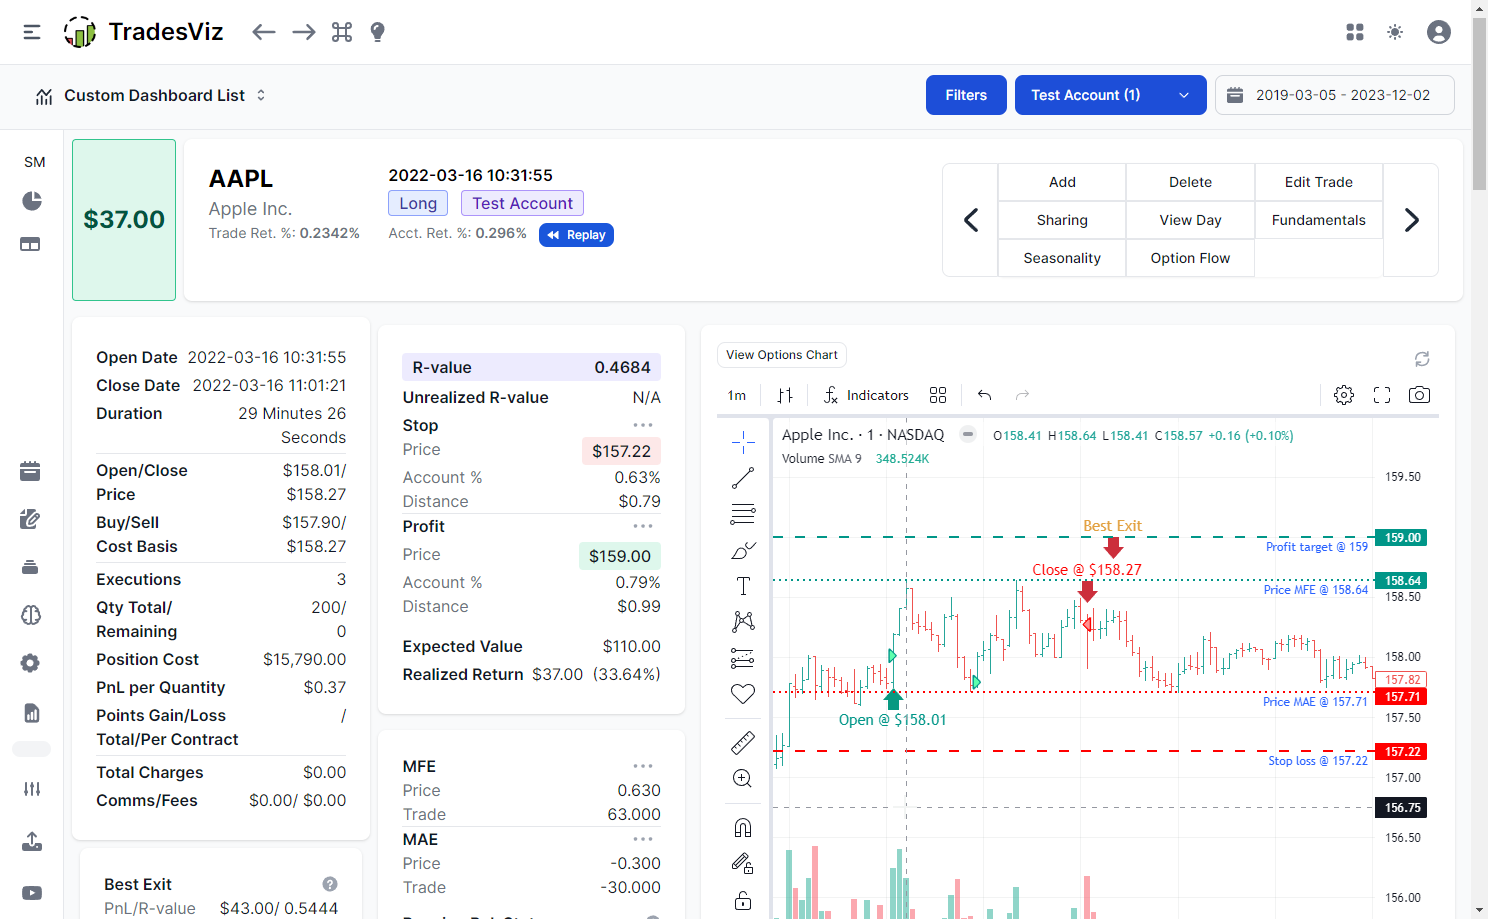
600+ Statistics
Comprehensive insights
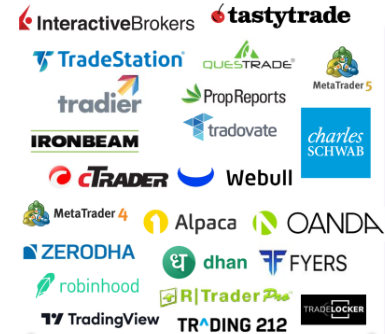
200+ Brokers
Import/Auto-sync trades
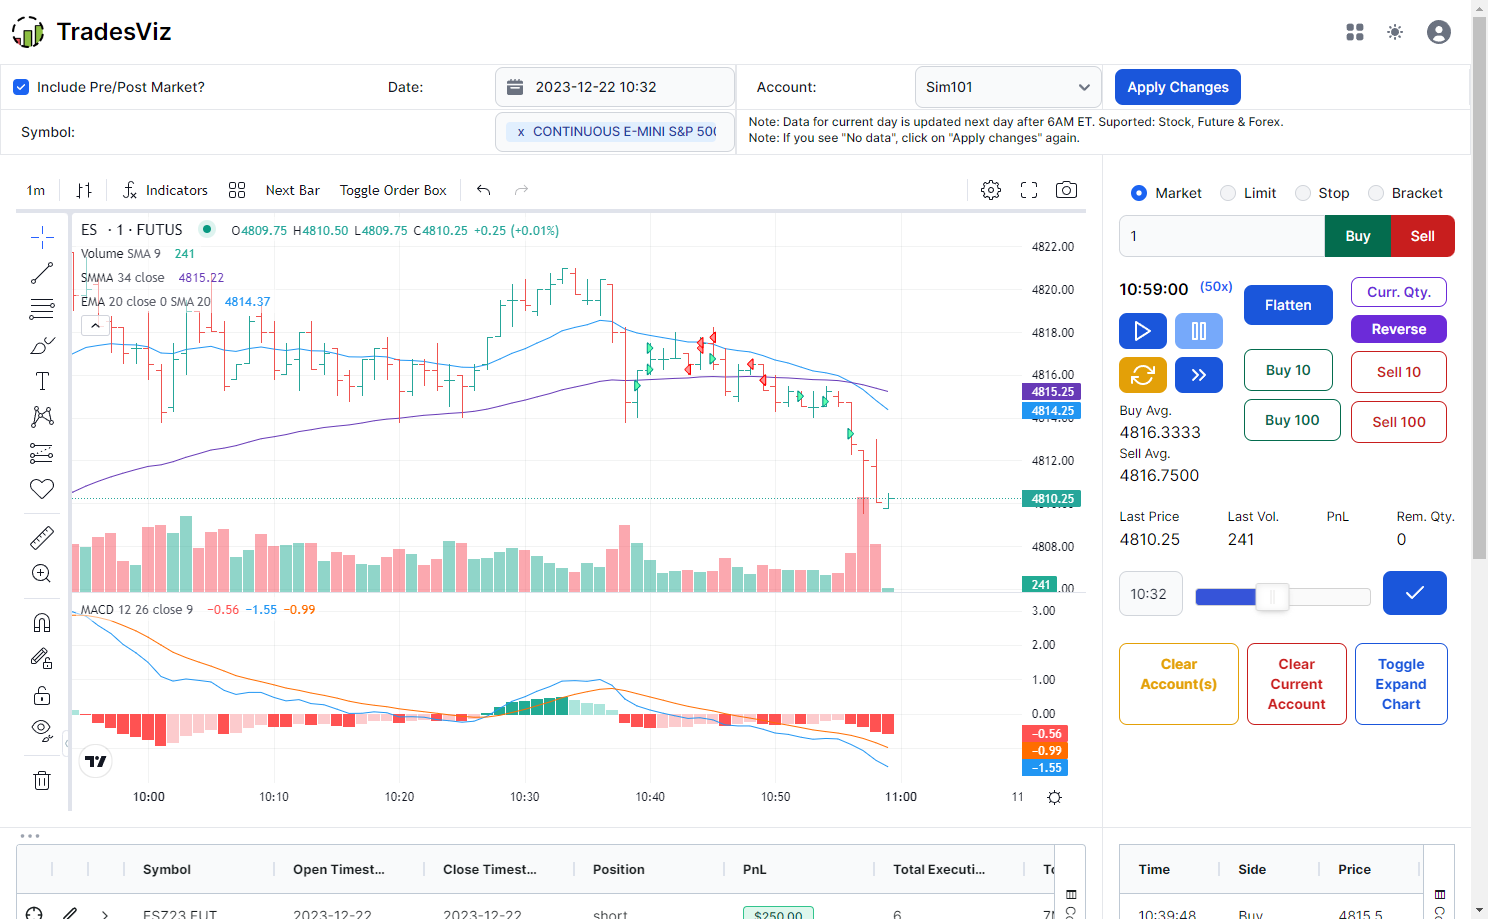
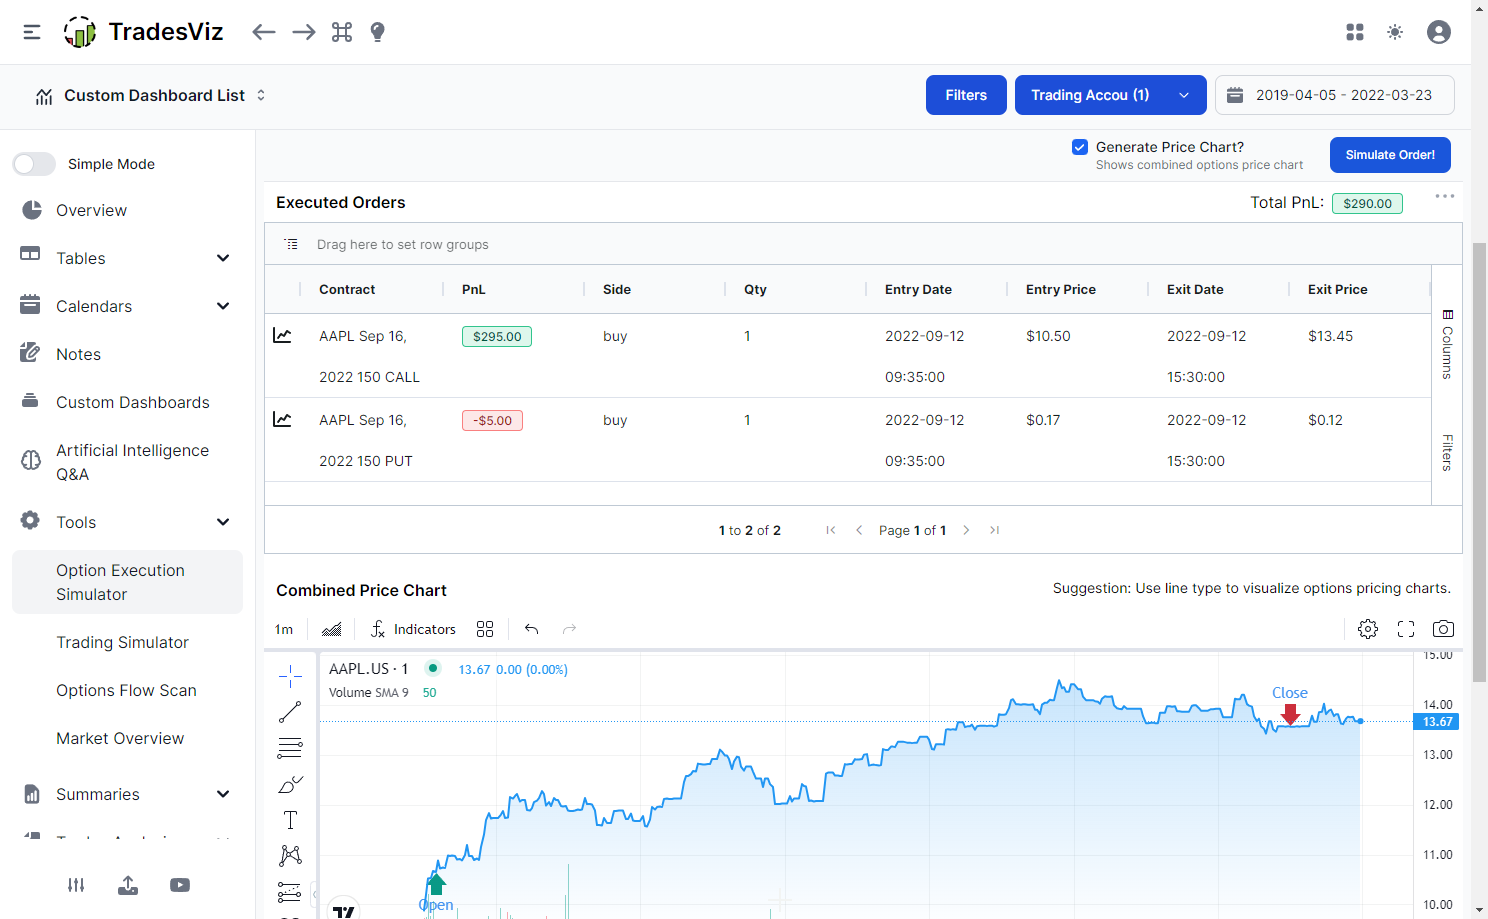
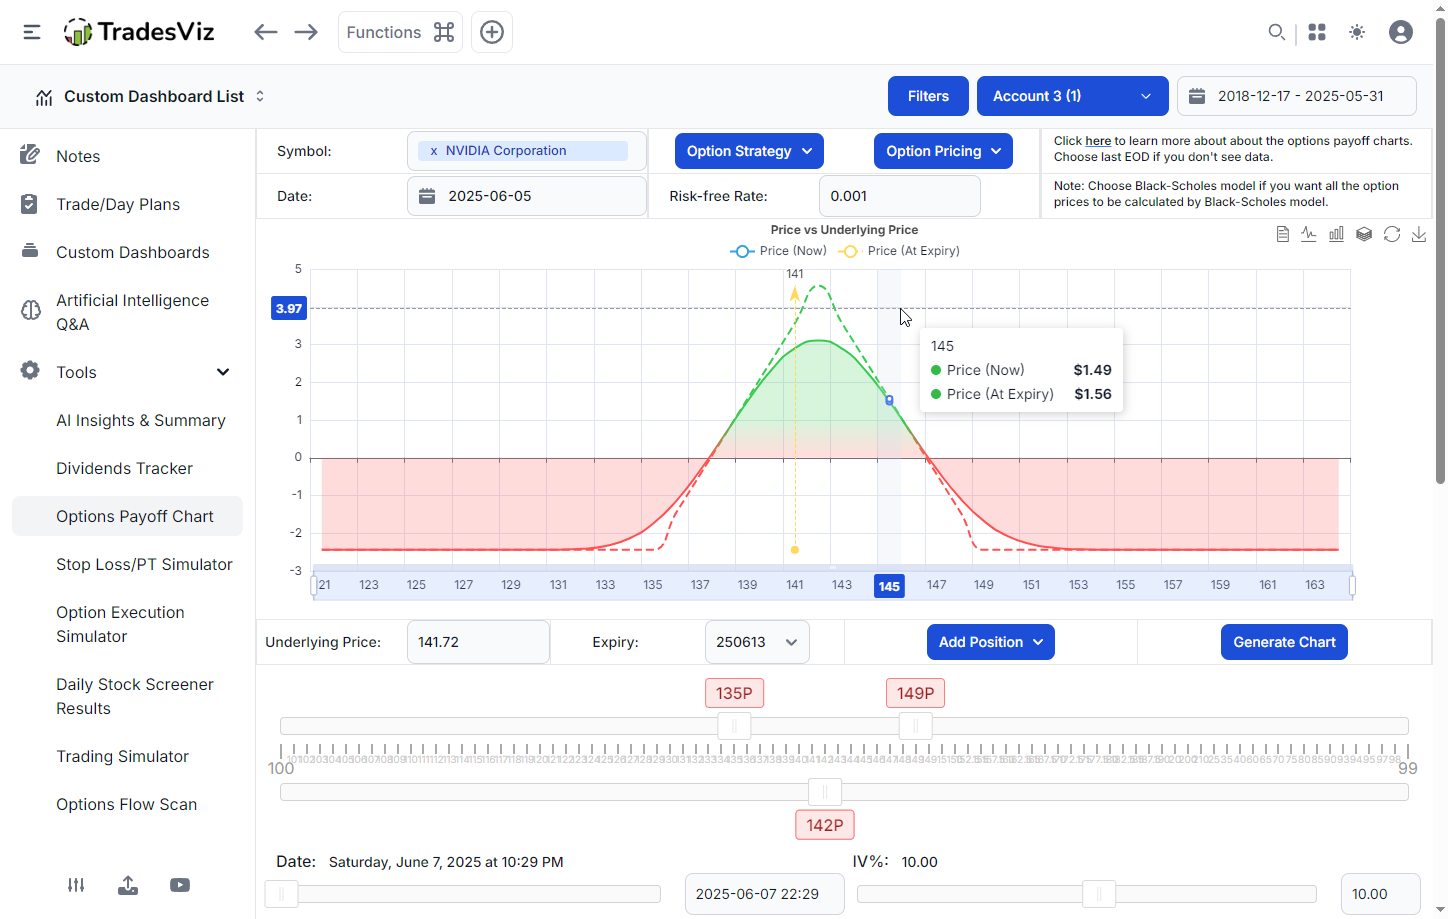
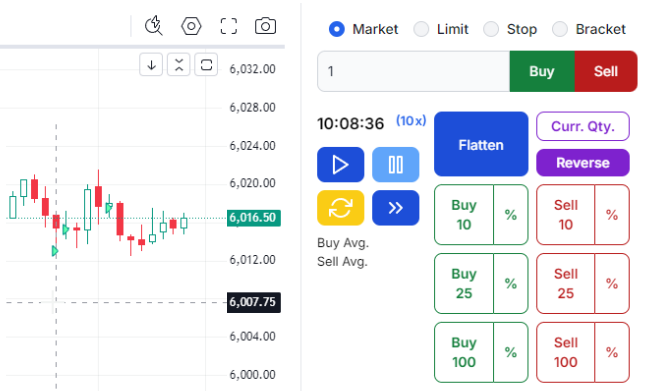
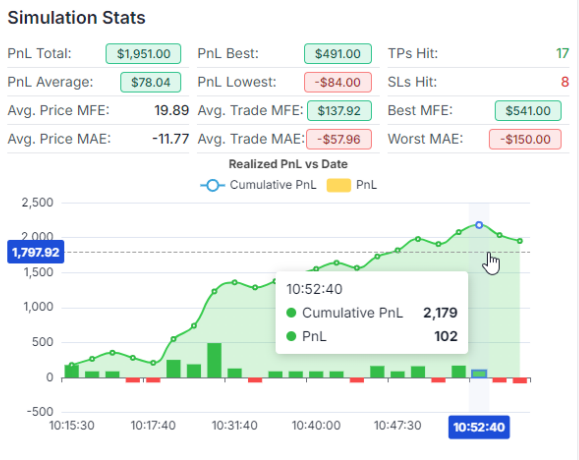
All-asset Simulators
Risk-free practice
tradesviz.com/home

150,000+
Active Traders
40,000+
AI Queries
90M+
Trades Analyzed
40,000+
Tickers Supported