Another long-term feature request from all our intraday traders - a "what if" analysis of how your performance would have been if you were in that trade for a little longer.
This is another "what if" analysis of how your performance would have been if you were in that trade till the end of the day. This is unlike the "best exit" analysis that we launched earlier this year.
Our popular Best exit and EOD exit analysis and charts are highly requested features from traders of a wide spectrum of backgrounds - swing, intraday, scalp, etc.,
In that direction, after extensive usage of these features, we have come up with ideas on how these analysis can be made more systematic. Also based on many frequent user feedbacks and feature requests, we implemented the Multi-timeframe exit anlaysis where you can see exactly how much you would have earned intraday after specific intervals and also if you had exited your trade multiple days after.
However, our introduction of this feature introduced some confusion.
What's the point of this when we have the best exit and EOD exit already?
What has changed?
How can this be used?
How can this be visualized? etc.,
Here's a summary that answers all of these questions:
- We now have 3 types of exit anlaysis:
- Best Exit: What if you held on to your last execution a little bit longer whilst still adhering to your risk constraints? (intraday only)
- EOD Exit: What if you simply exited your last execution at the end of the training day when the actual last execution was made?
- Multi-timeframe Exit: What if you closed your open position only (first execution) after specific timeframes/time periods (like 1 hour, 1 day, etc.,?)
- So far, we have had visualizations for the Best and EOD exit only. With this update, we are adding visualization for multi-timeframe exit AND combining it with the other two exits!
- All of these exit analysis tells you how long you should have held your trade to maximize profitability. Whereas, the running pnl anlaysis tells you when you should have let go of your trade to minimize losers.
Introduction & about the data
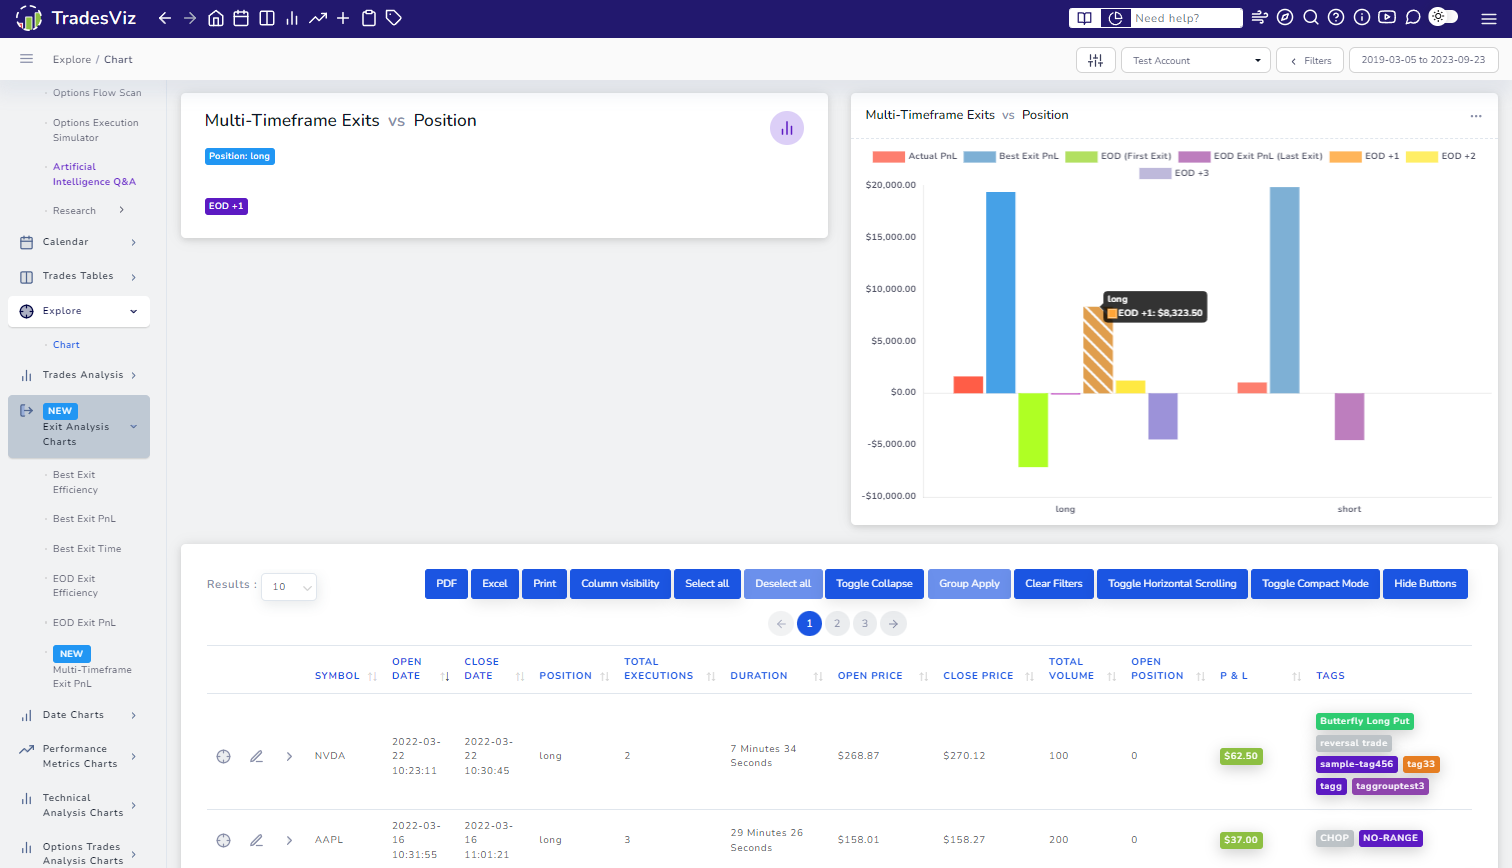
These new charts can be accessed under the Exit anlaysis tab in your main dashboard.
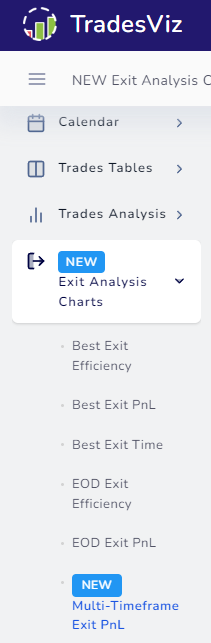
Once you launch the tab, you will see a familiar set of charts - i.e., Price range, Volume range, duration, day of the week, etc., but the Y-axis will have multiple values each of which can be toggled on or off using the exit data selection dropdown.
Here is the list of all the charts you will see:
- Multi-timeframe analysis vs Price Range
- Multi-timeframe analysis vs Volume Range
- Multi-timeframe analysis vs Time of Day Range
- Multi-timeframe analysis vs Day of week
- Multi-timeframe analysis vs Month
- Multi-timeframe analysis vs Year
- Multi-timeframe analysis vs Duration
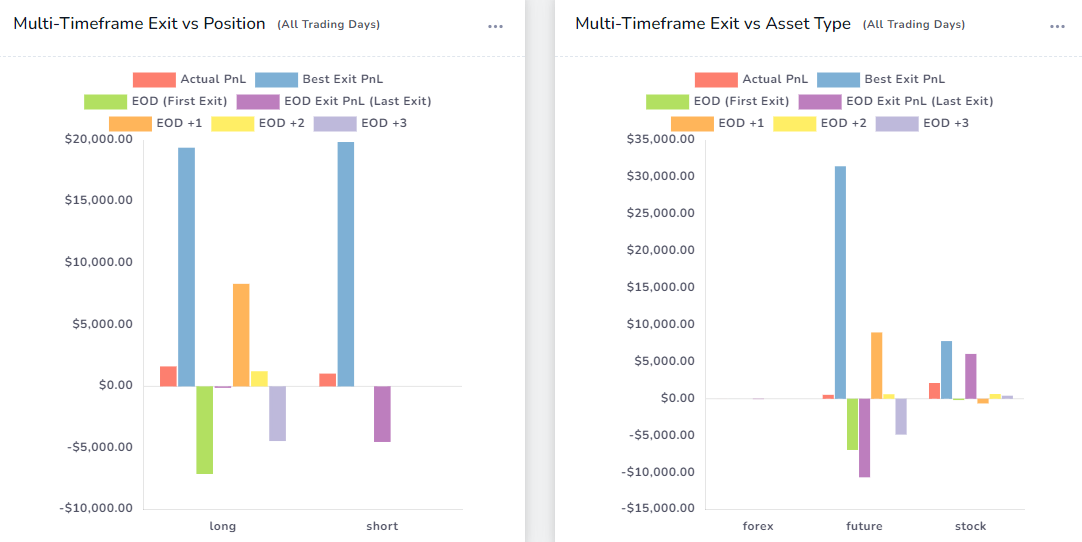
- Multi-timeframe analysis vs Side
- Multi-timeframe analysis vs Asset Type
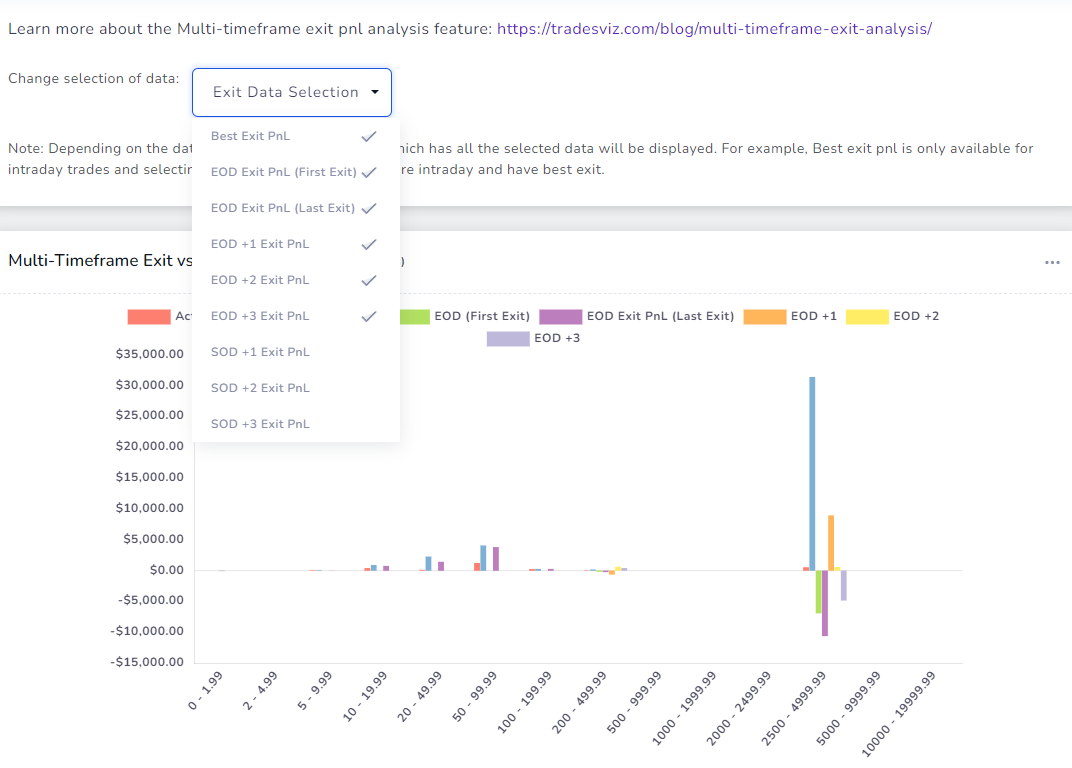
Each chart can have any of the following data points (multiple selection):
- Best Exit PnL
- EOD Exit PnL (First Exit)
- EOD Exit PnL (Last Exit)
- EOD +1 Exit PnL
- EOD +2 Exit PnL
- EOD +3 Exit PnL
- SOD +1 Exit PnL
- SOD +2 Exit PnL
- SOD +3 Exit PnL
The difference between the two EOD exit pnl will be explained in the next section.
By default, all the data points except for SOD (Start of day) are selected. For more info on each stat, please refer to our multi-timeframe exit analysis blog post here.
You can toggle on/off the data points you need in each chart. Note that extreme outliers can easily skew the chart and change the visualizations so this is a feature we expect a lot of users to use frequently to make sure you are getting an accurate understanding of the data.
Moreover, each chart like all other TradesViz charts is fully explorable. Meaning, you can click on any data point and it will show you all the trades that make up that data point. Even though we have multiple data points for a single X-axis label, it all comes from the same set of trades, so it does not matter whether you click on the EOD+1 bar or the SOD+2 bar - you will get the same list of trades.
Note that depending on the selection of data, only the trades that have ALL the selected data points will be displayed to maintain consistency and accuracy when comparing stats.
EOD Exit vs Mult-timeframe Exit
Now you might have a question: We have "EOD" in both multi-timeframe analysis and also in the previous existing EOD exit analysis. What's the difference?
In short, the calculation for EOD exit (i.e EOD +0) in the multi-timeframe anlaysis (as with all other exits in multi-timeframe anlaysis) is that we take the first execution of the trade and simulate the exit based on its price and quantity. Whereas, for EOD exit (and similarly for Best exit), we take the last execution and move it forward in time to simulate the exit considering the entire trade.
Here's a simple example:
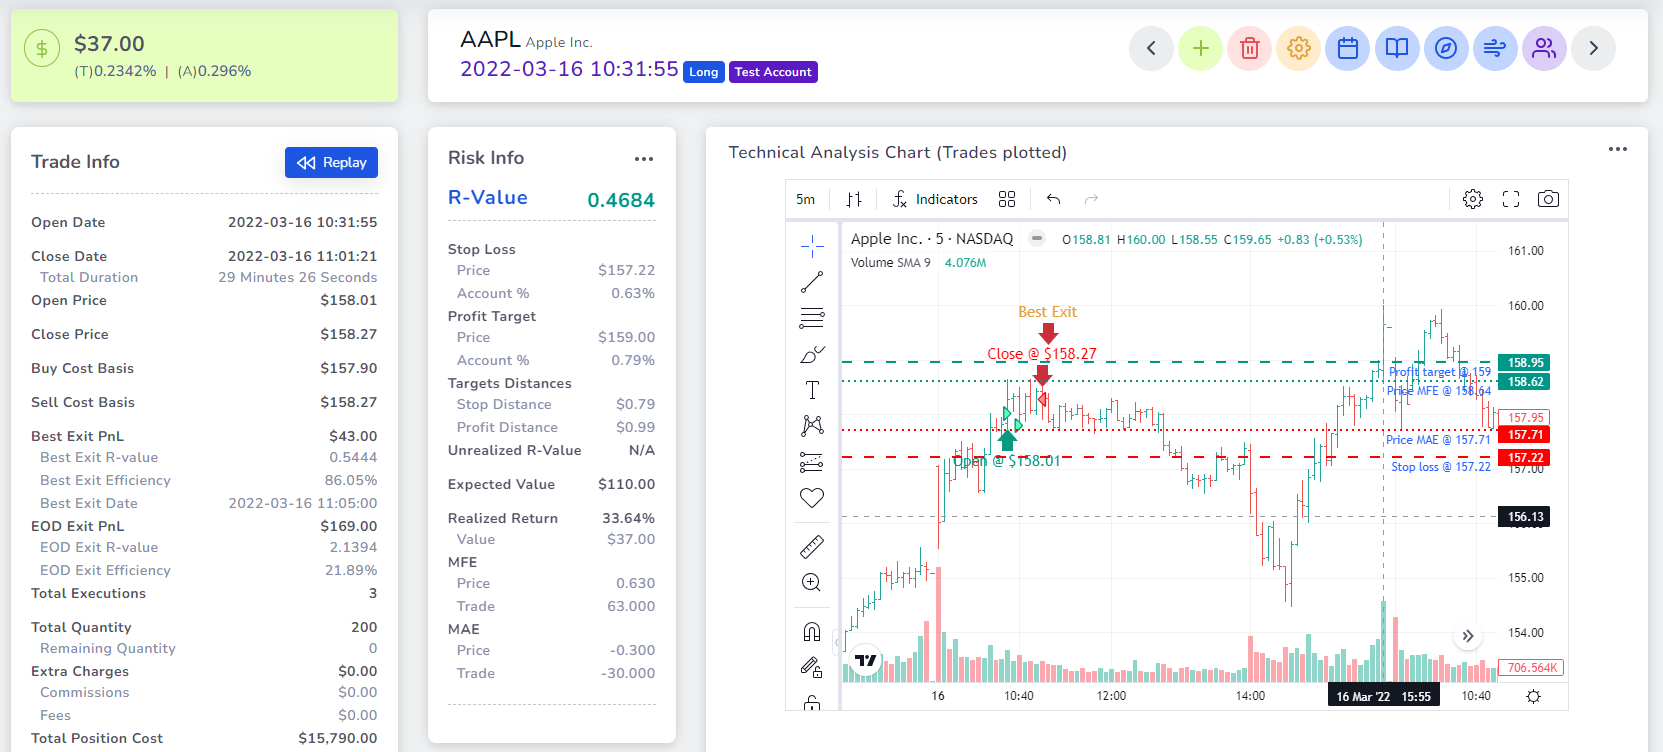
Consider this AAPL trade with:
- Actual pnl of $37.00
- EOD exit pnl of $169.00
- EOD +0 (Multi-timeframe anlaysis) pnl of $79.00
Why is there a difference of ~$80 (almost 2x) between the two EOD pnl's?
Let's check the calculation:
EOD exit pnl: Taking the last execution and moving it to the EOD and simulating the trade
First execution price: $158.01 (Buy x50)
Second execution price: $157.79 (Buy x50)
Last execution Original price: $158.27
NEW Last execution price (at EOD close): $159.58 (Sell x100)
(157.90 is the total buy cost basis and 159.65 is the total sell cost basis)
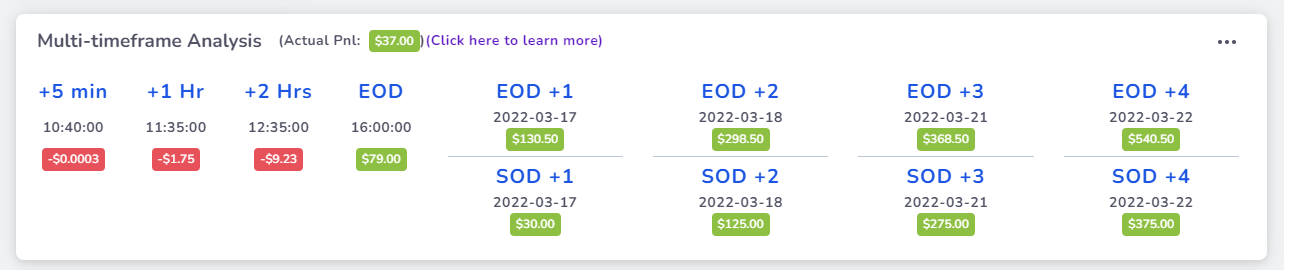
EOD +0 exit pnl (Part of Multi-timeframe analysis): Calculating PnL by simulating exit of ONLY the first execution at EOD
First execution price: $158.01 (Buy x50)
NEW Last execution price (at EOD close): $159.58 (Sell x50 - opposite of first execution)
It should now be clear why there is a 2x increase in the EOD exit because it considers the entire trade. Why are not not considering the entire trade for the other EOD exit (multi-timeframe anlaysis)? because it causes too much confusion about what exactly happened during the trade or how the executions are done.
This way, this type of anlaysis can provide insight into whether your scaling/scalping is actually helping you or if you are just better off leaving it till EOD or any other timeframe and then closing it at the end.
Note that all of this is automatically calculated for all your trades! If you do not see any of these stats, try clicking on recalculate trade above the trade executions table in the trade explore tab or you can also use group apply to do bulk recalculation for many trades at once.
How to use this data
There are many ways to use this data. But first, we suggest clearly understanding what each exit represents - i.e the differences between best exit, normal eod exit and the multi-timeframe exit.
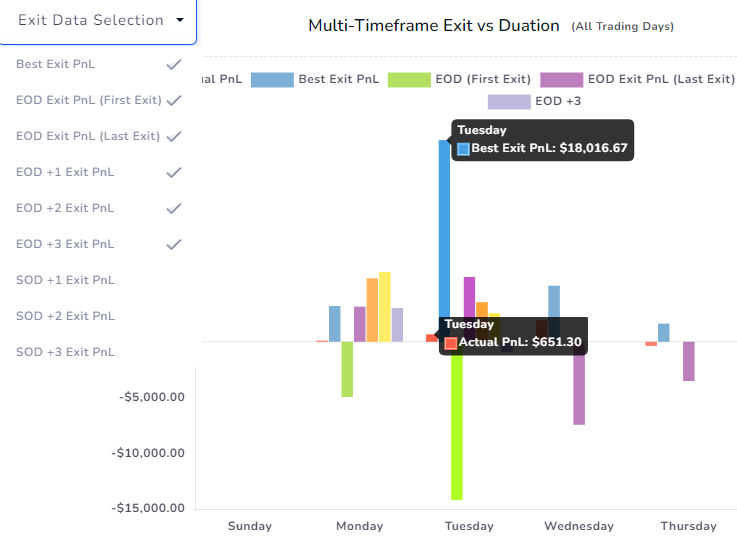
When they are all shown on the same chart, a lot of very interesting patterns appear. For example, based on the above AAPL trade, you might think that multi-timeframe exit is always going to be lesser than normal EOD but that is not the case always as you might see in your own dashboard. Here's an example:
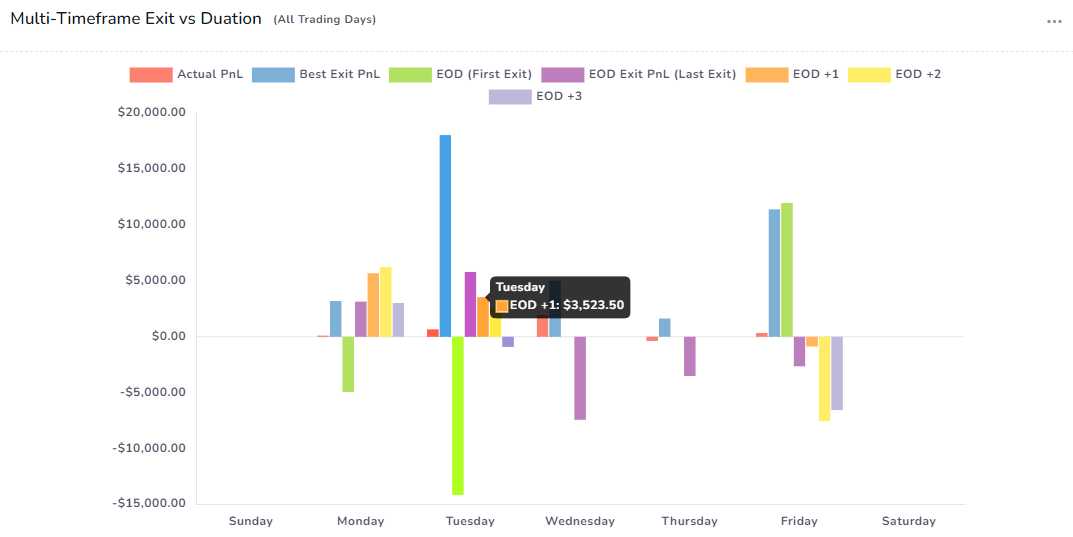
Notice the EOD exits on Tuesday vs Friday
EOD (First Exit) - i.e. the Multi-timeframe exit performs the worst on Tuesday (green bar vs purple) whereas it's much better on Fridays.
- Could this be due to volatility at the end of the week? a weekend effect?
- maybe it's only to specific assets?
- Maybe frequent intraday trading or scalping is not good on Fridays?
Where do you get answers to this? Explore!
Explore the trade by clicking on the bar and then clicking on "Explore trades" to learn more.
This is EXACTLY how you refine and make minor modifications to your strategies based on external factors such as seasonality, and market conditions which are cyclic and keep changing.
Similarly, if you are a heavy intraday trader, you might be very interested in the simple best exit anlaysis which might yield the most optimal results. But here's the downside - it cannot be easily integrated into a systematic/rule-based strategy system. You need to have proper risk metrics in place to reap the maximum rewards - after all, it is called the "best" exit (only for intraday) out of all the exits we have.
But when looking at this from a simple perspective of, is it better to hold options only for 3 days or is it better to exit stocks exactly after a day or at EOD of buy, all of these questions are at the back of the head of any trader who has been in the markets for a while and is looking to make a system that is easy to execute for longer terms. These types of anlaysis - the EOD exit, and multi-timeframe exit will help you realize all of those ideas and put them into action with confidence. Why? Because you are looking at the results of your own data and all of this analysis ARE indeed backtests of various scenarios of your trading!
We hope these charges give you an idea of how can craft very simple, yet effective strategies with a small amount of effort. As always, we are looking forward to your feedback and ideas on what we can do to improve this just like how we had plenty of feedback for improvements of the multi-timeframe anlaysis. We are gearing up to launch TradesViz 2.0 with massive updates to EVERYTHING on your dashboard. If you are not yet a user of TradesViz, this is a great time to get started and learn about the science and art of trade journaling.