One of the biggest changes in the v2.0 version of TradesViz is the improved grids that replaced all the ordinary tables. This was one of the key changes that made us create a completely revamped dashboard that is more apt to the latest grid technology. We introduced the Pivot grid earlier this year and since then we have received many requests to make this the default and we have done just that with this upgrade!
Unlike the previous tables which were static, not very customizable, and fixed, the new grids (every instance of it) are fully customizable:
- Column visibility
- Column size
- Column order
- Sorting order
- Multi-sort
- Row height
- Table summary
The best part is, that these tables are fast and very responsive, and all your state, changes are saved to your user profile so that you can view your TradesViz account on any device and still see it the same way you set it.
We will split this blog into multiple sections and explore each feature of the grid with examples and videos.
1. The basics: Sorting, Ordering, & Visibility of Columns
Let's start with the most basic functions: you should be able to view your data in the way you want.
Sorting
To sort a column, simply click on the column header. Note that, unlike other tables in the old TradesViz, the sorting here has 3 modes: ascending, descending, and no sort. No sort means, no sorting operation will be applied to that column and if no columns are sorted, the data will be sorted using an internal identifier.
Interesting feature: You can sort on multiple columns by holding the SHIFT key on your keyboard. For example, you can sort by date and then by pnl to see the pnl from highest to lowest per day at the same time, date-sorted from most recent to oldest. The video below shows all the sorting features.
Ordering
You may not care at all about open/close price or duration and maybe R-values are all that matter to you. No problem. You can easily rearrange the columns by dragging and dropping the column headers where you want.
But this can get tedious since the table has nearly 80 columns. This is where you use the grid's sidebar. Click on the "Columns" button on the right side of the grid and then you can easily rearrange the columns by dragging and dropping using the drag handle (dotted icon). All of this is shown in the video below:
Visibility
Again, preferences matter and change for each trader. You can easily disable/hide any columns you want by clicking on the check box in the columns area on the right side of the grid. Note that, having too many columns visible can slow down the grid because it's rendering A LOT of data at once. It's generally suggested to have just the most used columns to dramatically speed up the grid performance when scrolling or viewing a lot of data.
2. Table state: Saving & Resetting preferences
If you had an experience of setting all of this up and refreshing the page to see all your customization gone - it's because the newer grids that we use in TradesViz v2.0 store all the data on the server side. This means you have to trigger a save operation to let the backend know that your table preferences have changed.
To save one of the main table's states, you can click on "Actions" at the top and click "Save state" after you have made any changes to the table settings. This can be changes like sorting, column order, etc.,
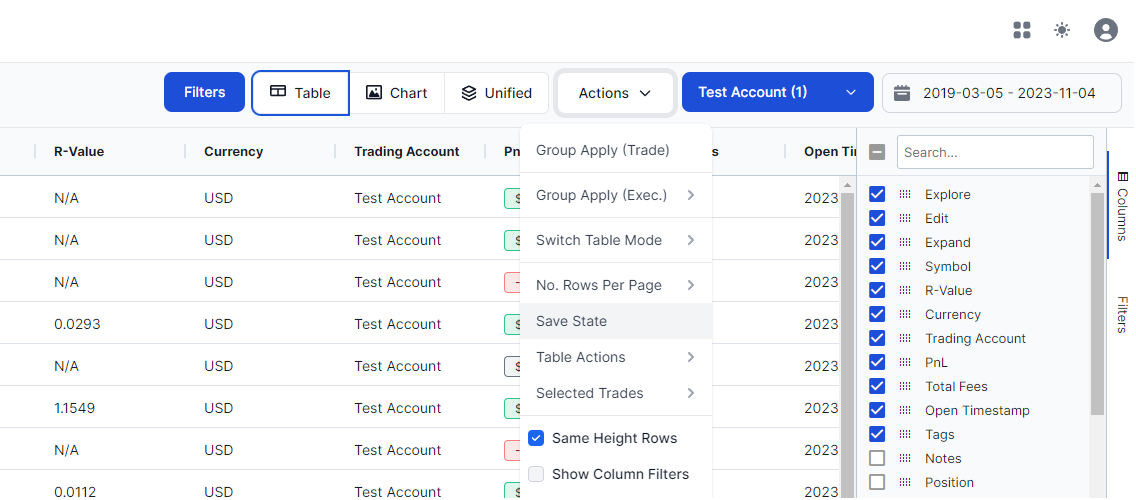
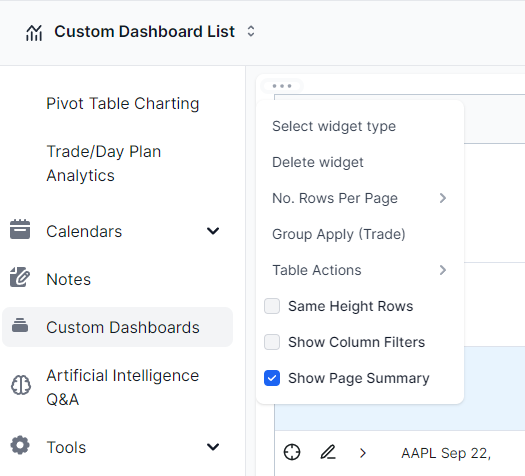
Finally, will not see the "Actions" button for all the tables. For tables that are part of other tabs like trade plan or overview or even the custom dashboard, look for the 3 dots icon on the top left corner of the table to open the table actions menu to save the table's state.
In case you do not see data or have messed up the format, you can click on reset state (Table actions > Reset state) and then work on a fresh grid instance.
Update Jan 2026: Saving the state of the table also preserves the inner table's state.
3. Table actions: Select, Export, Page Size & more
In the old TradesViz tables, the only action that was available was exporting. That limited section of actions has expanded with the grid.
Simply click and drag any no. of cells (like in Excel) and right-click - you will see this:
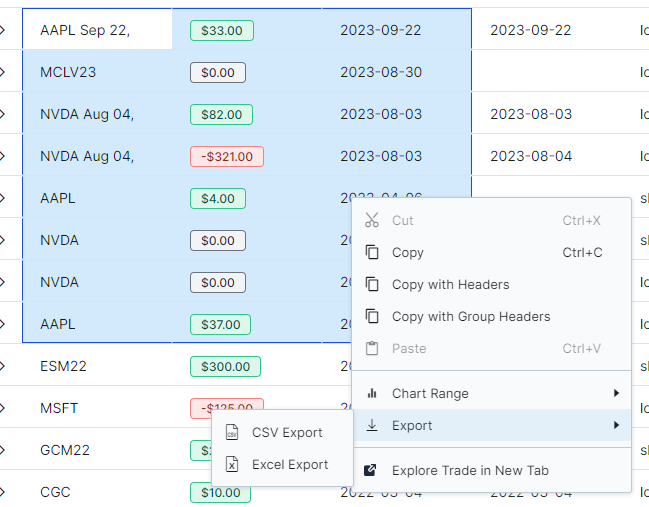
You can now:
- Copy individual cells
- Specific rows
- Export as excel/csv
- Open trade explore on a new page
- Chart the data [see next section]
Except for the trade explore, ALL the above features are available in ALL the grids!
The most interesting feature here is the charting which we will explore in a dedicated section below.
Important feature behavior change: Executions group
You will notice that there is a new option called "Group apply (Exec.)". This is for the merging of executions when you have expanded the trades. We have removed the old drag and drop feature for more efficient click > select > apply approach that allows the user to merge executions from multiple trades with very less movements/actions.
Here's an example. We have expanded 2 ES trades and now we want to move 5 executions from the first ES trade (PnL $46) to the second ES trade (PnL $80). Here's a video where we move the executions in the blue box to the trade in green:
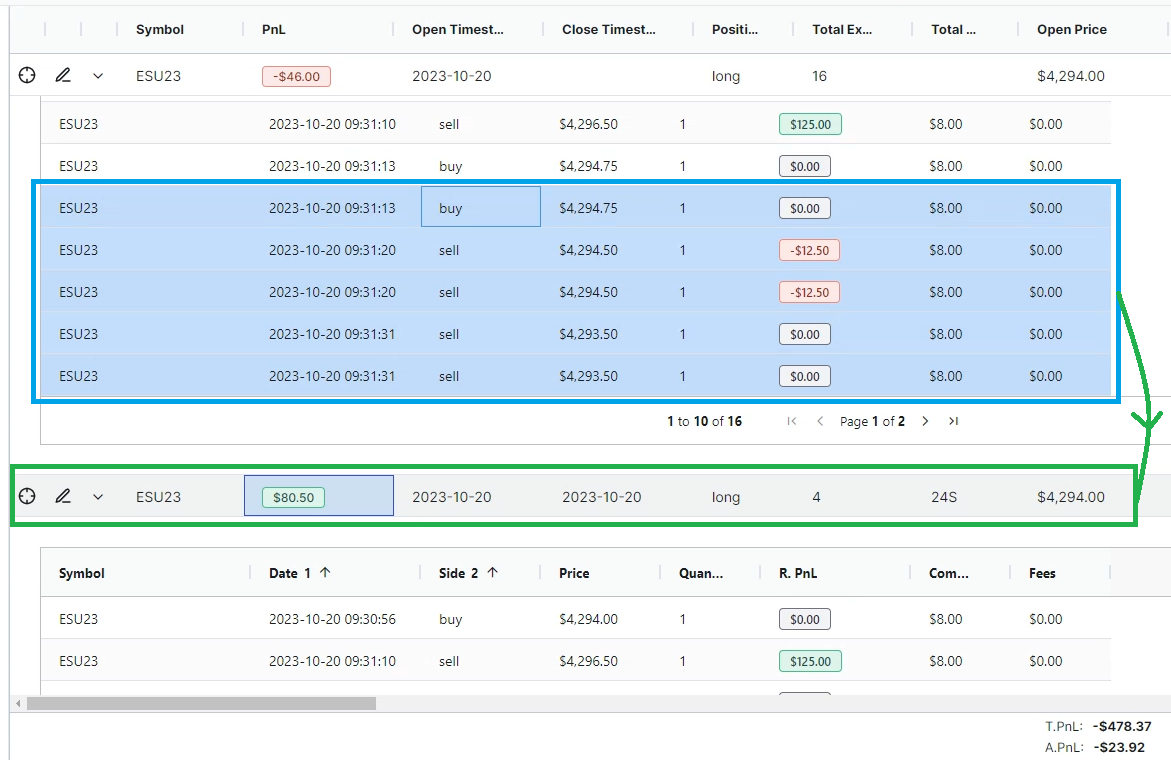
Instructions:
- Ctrl/Shift+Click to select the multiple executions in the first trade's expanded area (Note: This is rows of the inside/inner table)
- Click on the trade to where the executions have to be moved to. (Note: This is the row of the outside/main table)
- Now select Action > Group Apply Exec. > "Move executions to selected trade"
Video:
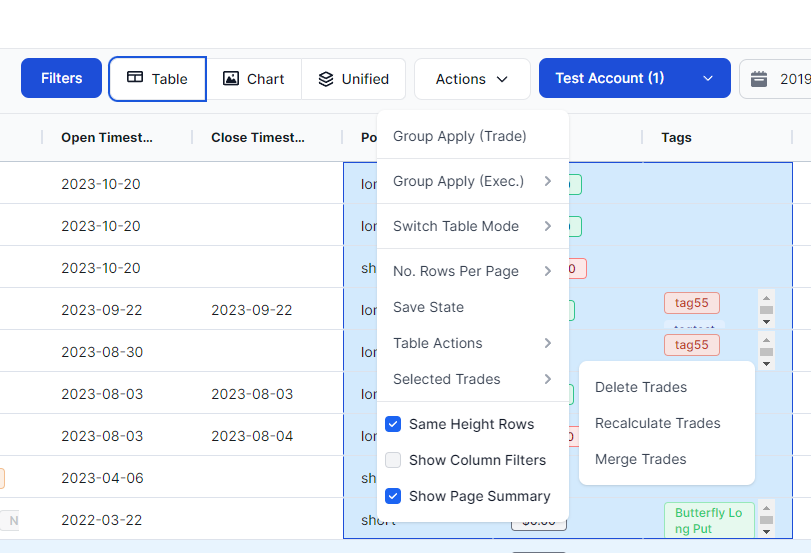
Other than this, there are other functions that are part of the table actions menu like:
- Group apply
- Export shortcuts
- [NEW] Quick group apply (only on main tables)
- Page size
- Save State
- Reset State
...and more!
Most of these functions are available in all the main tables. Functions like page size are available on ALL tables.
We have 3 more new features:
- Same Height Rows: Makes all the rows the same height so that you can fit more data on the page
- Show Column Filters: A filter box for each column will appear at the top
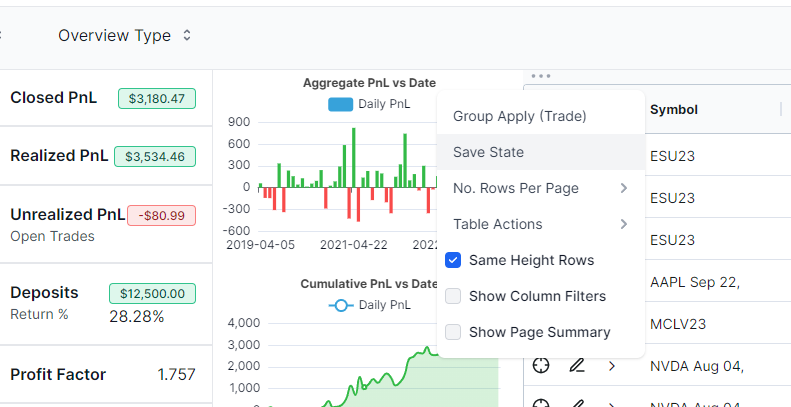
- Show Page Summary: A summary section of the current page's data will appear at the bottom right corner of the table
Here is a trades table on the overview page with all 3 options enabled:
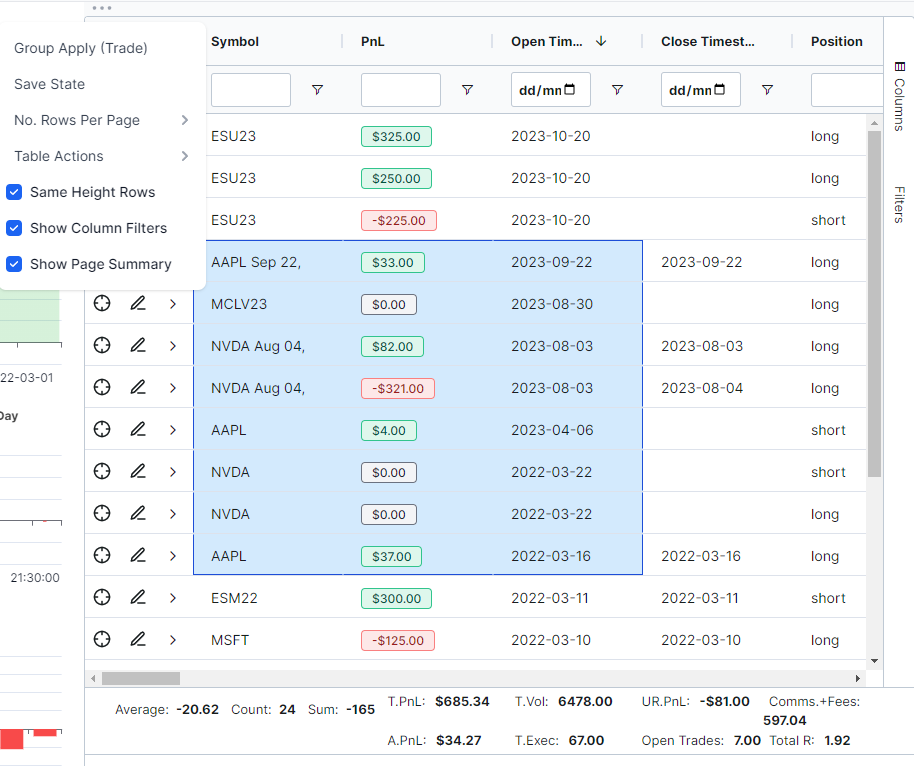
Here's another cool feature of the grid: whenever you select the cells, you will automatically see the average, count, and sum of the numeric values at the bottom left corner. But what's cooler? being able to see the entire page's summary at the bottom.
The page summary only works for the main tables - i.e., the trades table, symbol grouped, day grouped, and executions table (and also the widget version of these tables). But the cells summary is applicable for all grids.
With this, you can set it to always show filters and a summary in case you are looking for a REALLY efficient way to quickly find trades. None of this was possible on the old trades table.
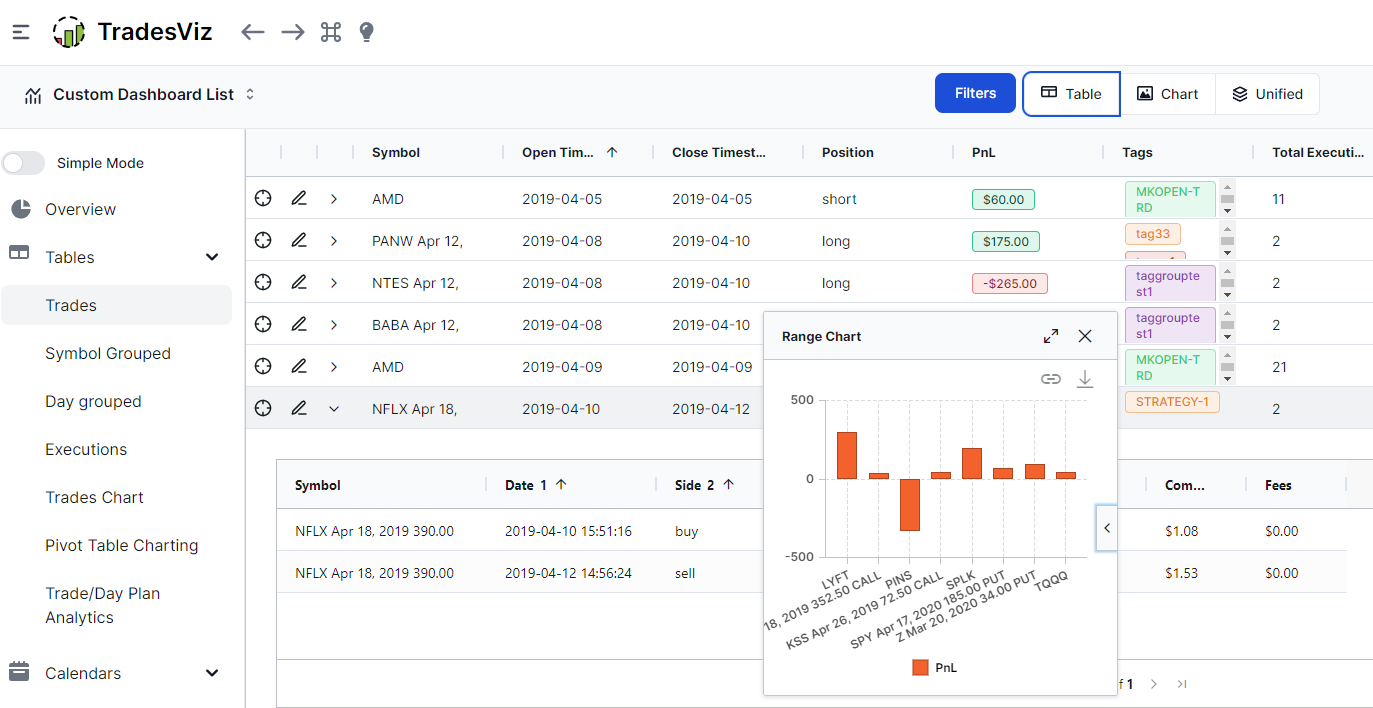
4. Table charts: Visualization/Charting
We consider this to be one of the main new features of TradesViz v2.0. We will show a quick video to demonstrate:
Ok, at this point. You now have access to Excel-level versatility on TradesViz when it comes to data visualization.
To do this is simple: Click and drag to select any cells > right click > chart range and choose any chart you want.
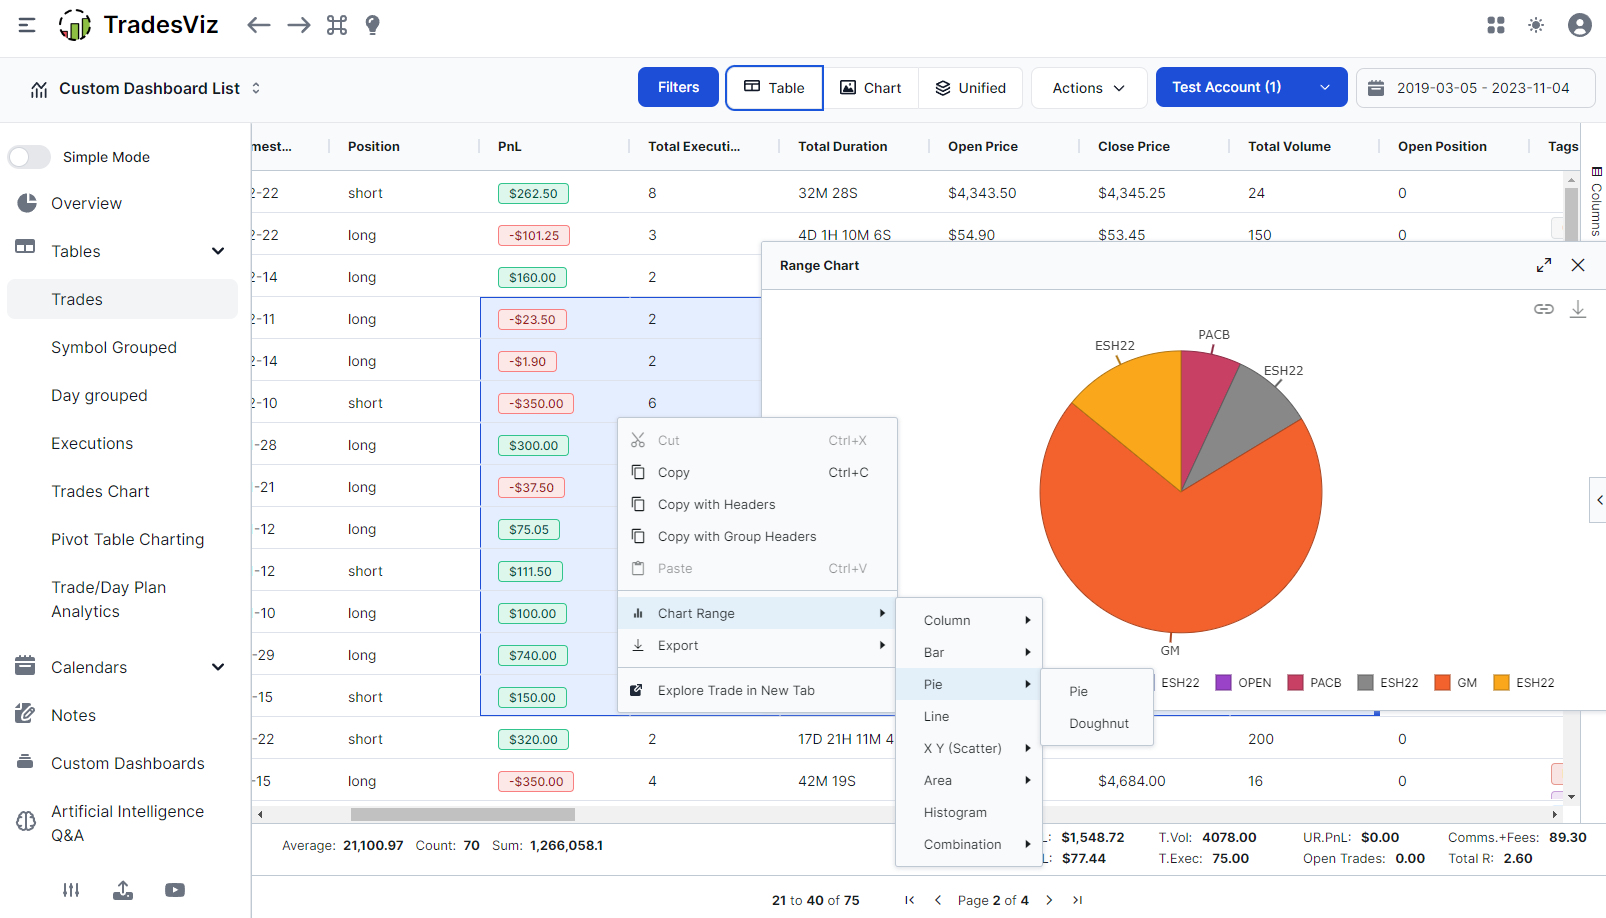
This is exactly what was available in the pivot grid and what made it special - it's now available on all grids but with some limitations. The grids like trades etc, have their data loaded from the server for each page. Because of this, it's not possible to do "pivot" operations and grouping operations but it is possible to do it in the actual pivot grid which is available under the tables menu.
The point of this feature is to allow you to visually get a summary of the data in mere seconds instead of searching for its chart in other tabs.
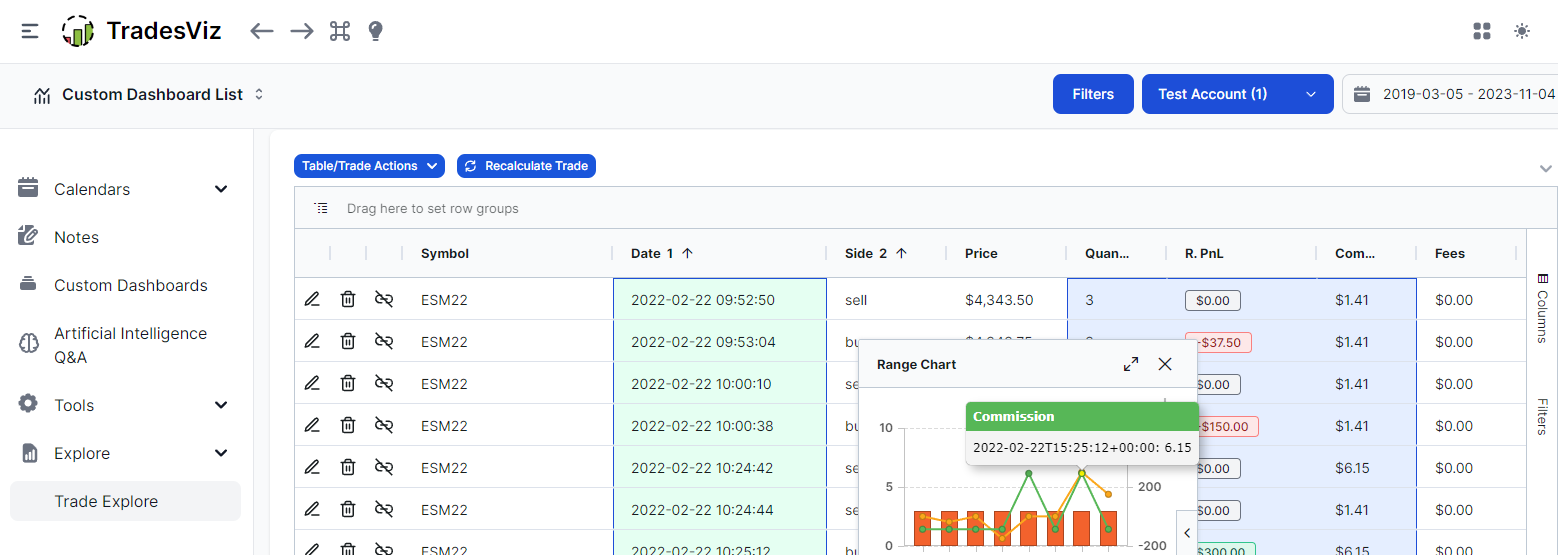
Also, did we mention that this type of charting is possible in every grid? Here's an example on the trade explore page. Another cool fact is that the charts change automatically when you filter/sort and you can customize the charting settings by clicking on the small arrow button on the right side of the chart.
5. Table Filtering
Our advanced filtering features still exist!
If you were a power user of the old TradesViz and are wondering where the search boxes are - don't worry, instead of search boxes, you can now enter all your queries in an easy-to-use dropdown-based search constructor.
A query like the following in the old dashboard
Becomes:
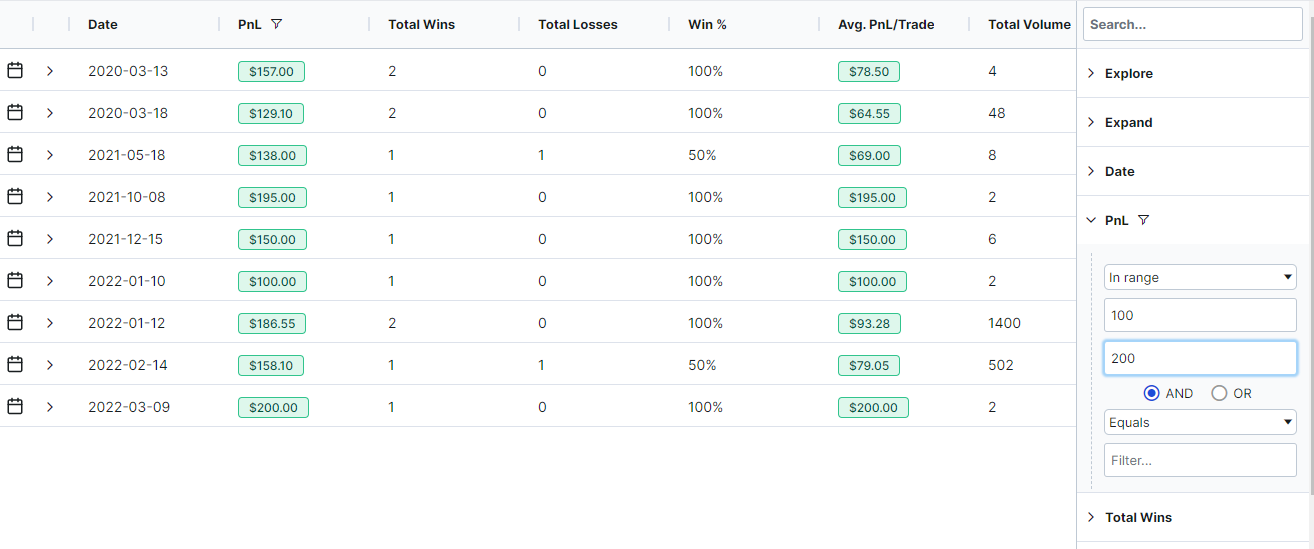
Searching for the column + learning the syntax for conditional filtering was difficult for many traders. We shifted to a dropdown-based filter system for an easier filtering experience for users of all experience levels. You can access this side tab by clicking on the "Filters" button on the right side of any grid. This filter too, has conditions - AND/OR (AND means both conditions must be satisfied, OR means either one of the conditions can be satisfied).
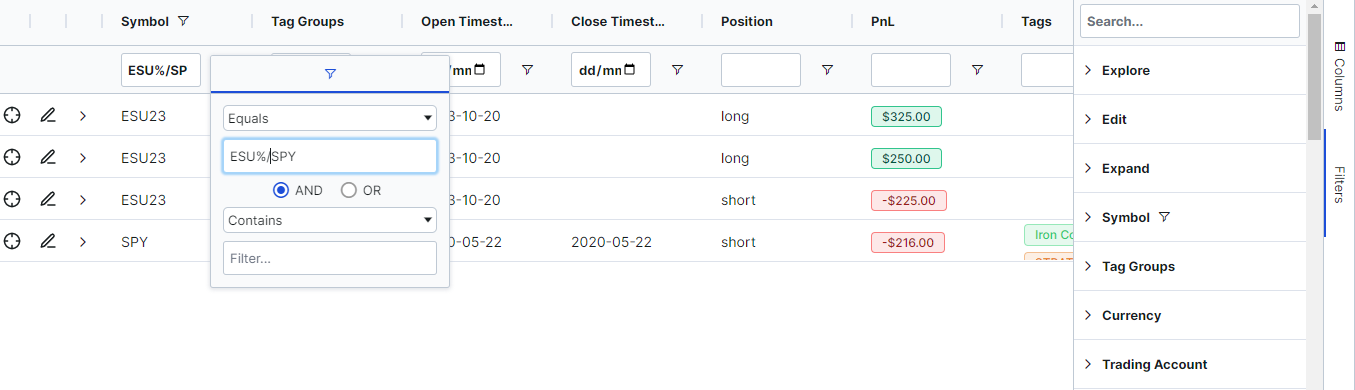
These conditions can also be applied via in-line column filters (enabled via the checkbox selection by the table settings/actions):
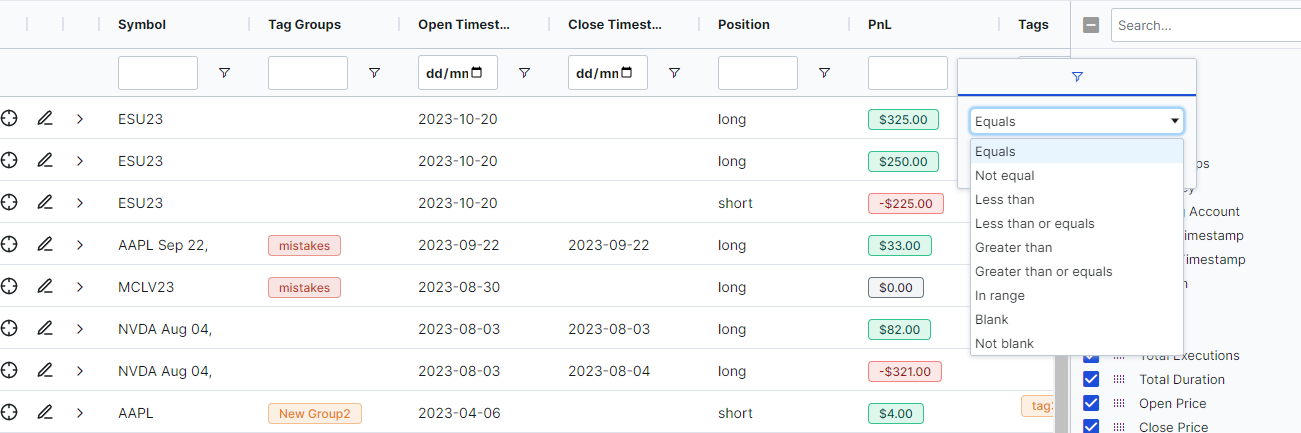
In case you were a fan of the versatile tag and symbol filtering syntax like `SPY%` or `!AMD` etc., all of these are still available and work if you use it in the "Equals" section of any text-based column like symbol or tag:
That's it! These are all the functions you can do with the latest grids. Much more than the old tables that were part of the original TradesViz. If you need even more advanced features like pivoting, row grouping, etc., please check the original pivot grid.
Here's a short list of important steps/features we think you will need to set upon logging in based on your preferences:
- Check the same row height option to make the table show more data if necessary
- Increase the page size to 20 or so to view your trades with less scrolling and pagination
- Use only the necessary columns - this will speed up your UI because the table has to render lesser no. of elements
- Finally, don't forget to save your table's state by clicking on Action > "Save state" or by clicking on the 3 dots icon (in tables other than on the main trades tab) and then "Save state".
This should deliver a vastly superior tabular data viewing experience than the older TradesViz and also compared to any other trade journaling solution. You are getting nearly all of the features of Excel but without any of the complexity or learning curve. This will be the future of TradesViz - simplicity, but without taking away the utility.
Do you see any improvements that can be made? New types of grids? Visualizations that can help you be efficient? Let us know! We are always looking forward to your feedback and it was only through lots of feedback that we've made TradesViz v2.0. Together, let's make your journaling experience smooth, efficient, and seamless!