We introduced the equity curve feature to track user's deposits and withdrawals in April 2021. Since then, a lot of new features have been added to the equity curve and the overall UI has also been greatly improved since the launch of TradesViz v2.0.
If you've had questions like how you can add your initial account balance or how you can manage expenses, and other broker fees/charges and make sure they are all accurately reflected in your overall PnL curve, then this blog should answer all your questions.
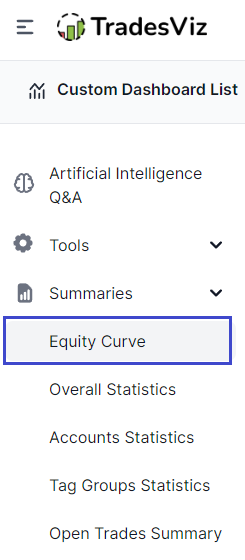
You can access the "Equity Curve" tab under the "Summaries" section on the left side of your TradesViz dashboard.
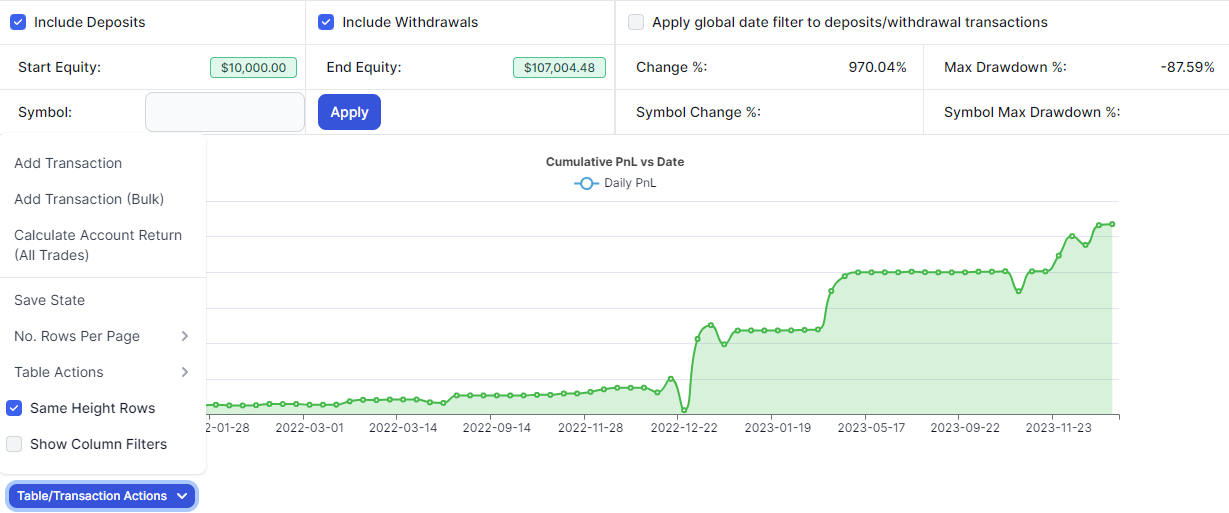
This page contains 3 sections: the control panel at the top with various options, the chart in the middle (the actual equity curve), and the table at the bottom reflecting all the transactions you've added so far.
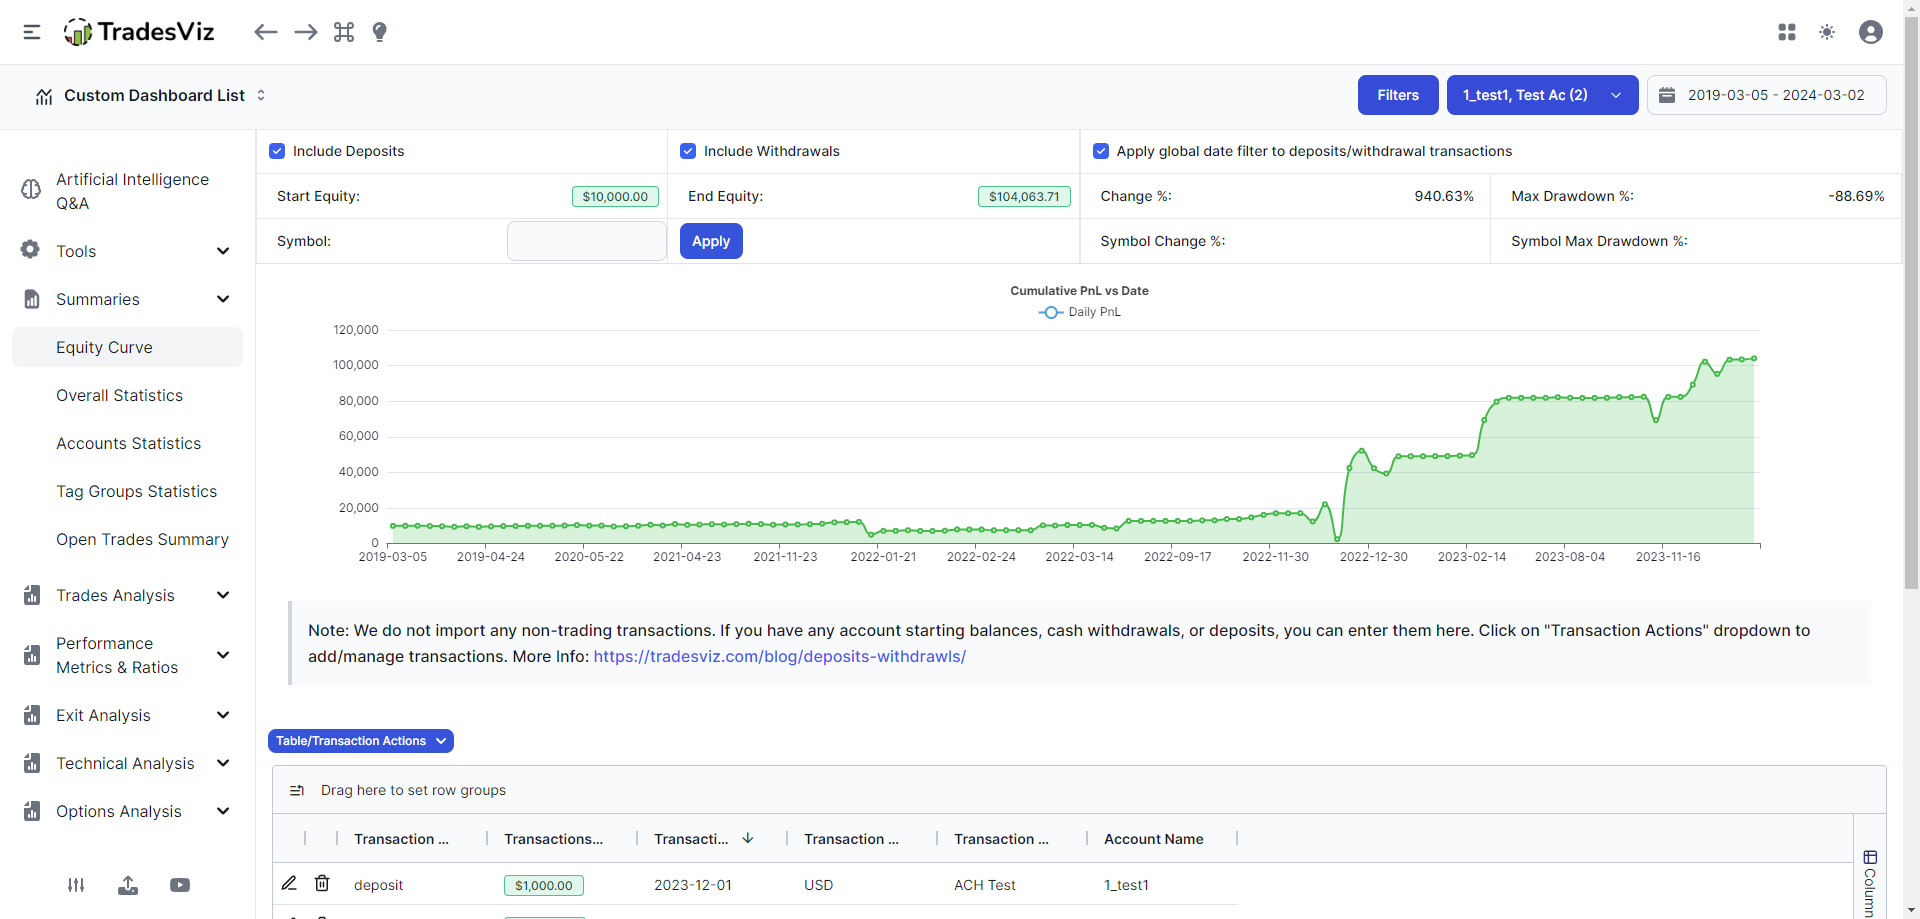
Your total account(s) equity graph is inclusive of trading profits and all withdrawals + deposits accounted for. Note that this is the only chart in TradesViz where deposits and withdrawals are included. All other charts in other tabs include ONLY PnL obtained from trading. Tip: The equity curve can also be added as a widget in the TradesViz custom dashboard.
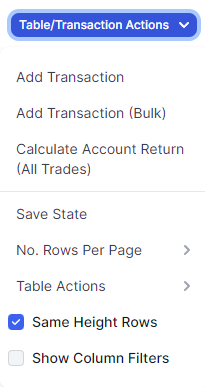
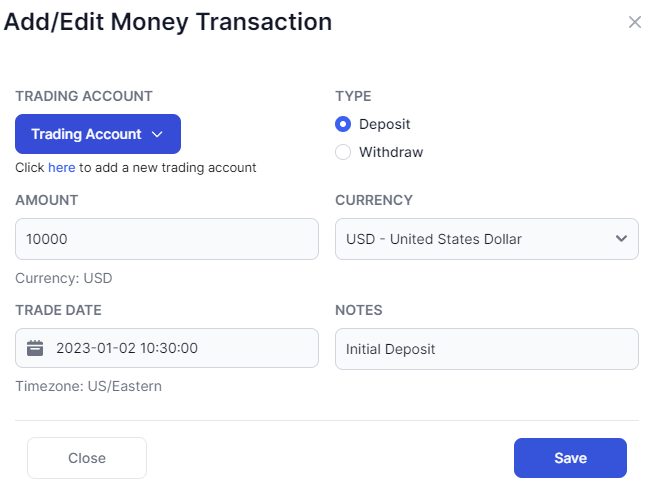
Let's first explore the main functions: How to manage transactions. To add deposits, click on "Table/Transaction Actions" and then click on "Add Transaction".
This will open up a box where you can add your deposit or withdrawal amount along with the date and note info. Fill in your info and click save to see the transaction. You will immediately see the equity curve change.
Apart from adding, you can edit or delete the transaction by clicking on the pencil or the trash icon respectively in the transactions table below the chart.
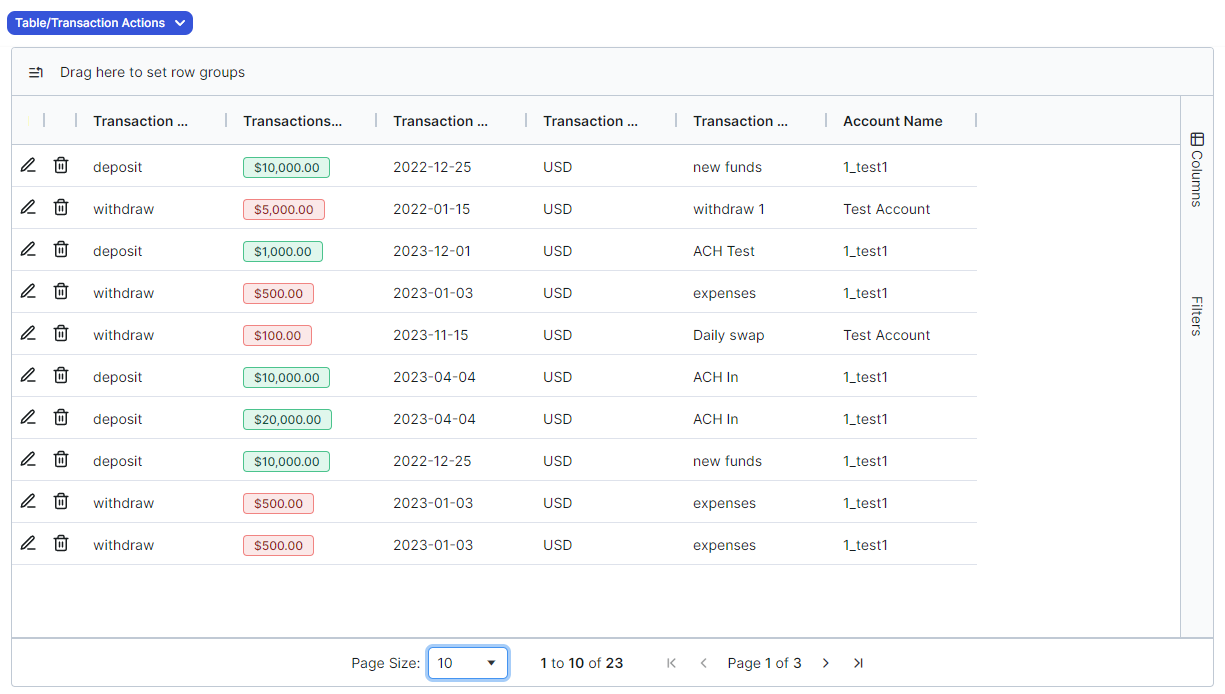
Because we use the same advanced grid technology for all our tables in TradesViz v2.0, you can sort, filter, chart, export, and do ALL the table functions that are explained in our tables in-depth guide.
In addition to adding transactions one by one, you can also add a lot of transactions at once using the bulk add transactions feature in the table actions dropdown.
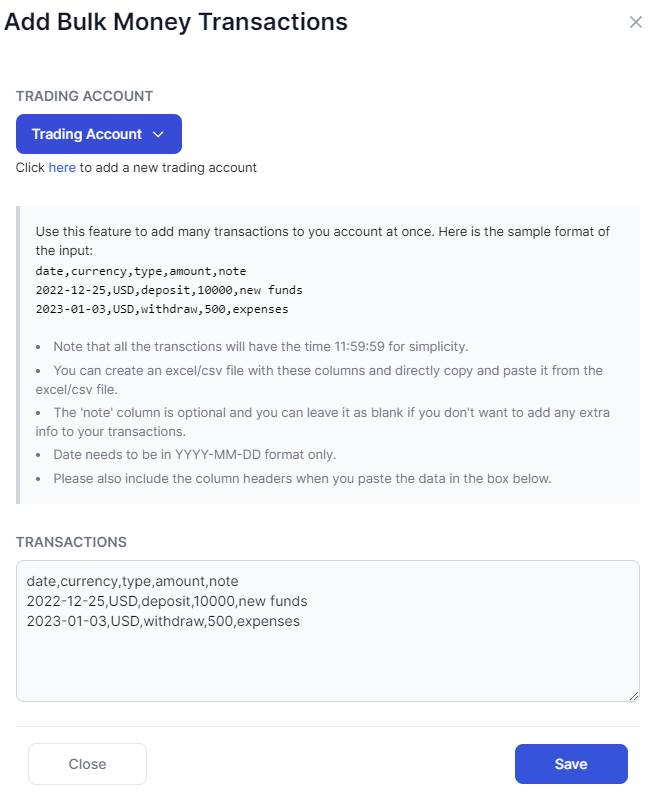
Simply add all your transactions in a csv (comma-separated value) format and click on save to add all of the transactions.
Finally, the 3rd operation you can from the table actions dropdown is to trigger a mass/group recalculation of all return %-%-based stats for trades. Why is this required? since the addition of the equity curve, we've started to use it as a way to get account-based % statistics also for trades. This means, that whenever you edit or add a transaction, trades based on when it was executed (before or after the deposit/withdrawal transaction) need to have its account return % recalculated. This is done automatically when you import your trades, and you can also trigger it manually via this action.
Remember that you need to click on recalculate return % when you do any transaction-related action from the equity curve. This is not done automatically for every change you make.
You can see the account return % of a trade (based on all the deposits made till before the execution of the trade) throughout the TradesViz interface:
- In the trades table (Account return %)
- Trade explore (Acct. %)
- Calendar > Month view (per week account %)
All of these stats such as deposits, withdrawals, and % change with respect to deposit ONLY are also shown in the Overall Statistics tab under the Summaries section.
Up next, we will explore the control panel at the top of the equity curve tab.
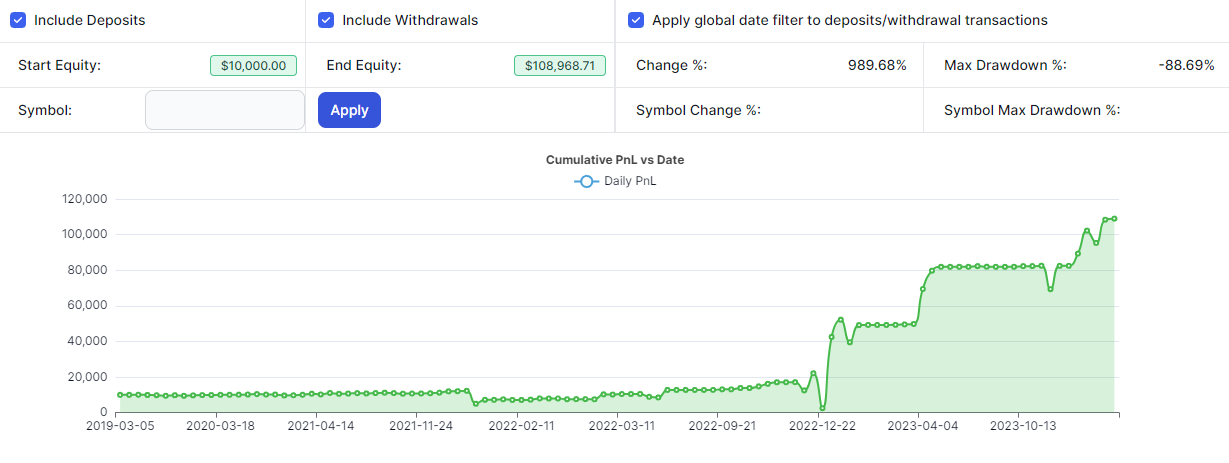
The first two checkboxes are simple - they can either include or remove your deposits/withdrawals from your graph. This is very useful if you want to see how much of an effect your transactions are having on your equity curve. By default, both of these are checked.
The next checkbox is required if you only want the transactions made within the global selected range range to be used. For example, if your global date range is from 2019-03-05 to 2024-03-02 and if you made a transaction on 2019-01-10, this transaction will not be visible IF this option is checked because it lies outside the current global date range. Once unchecked, you will be able to see this transaction added as part of the graph.
The next row shows you the start equity or the value at the leftmost point of the graph and the end equity or the value at the rightmost point in the graph. Change % is the change between these two ends and max drawdown is the lowest point reached in your equity curve.
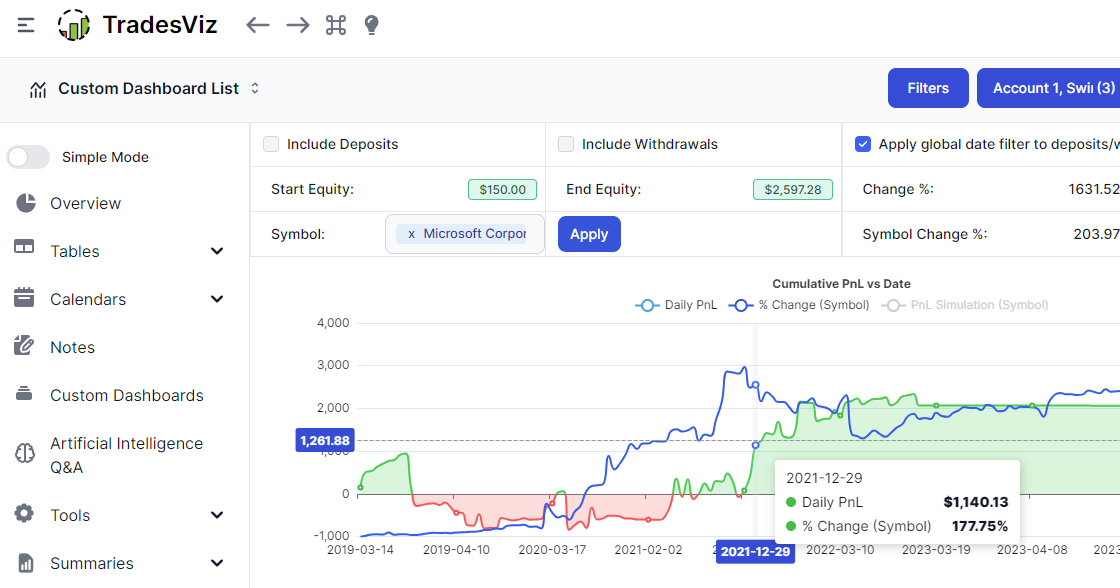
Finally, it is possible to compare your equity curve to another symbol or an index. We will not explore this feature in this blog post as we have a dedicated blog post for it.
Important distinction between % increase in overview vs equity tab's % increase :
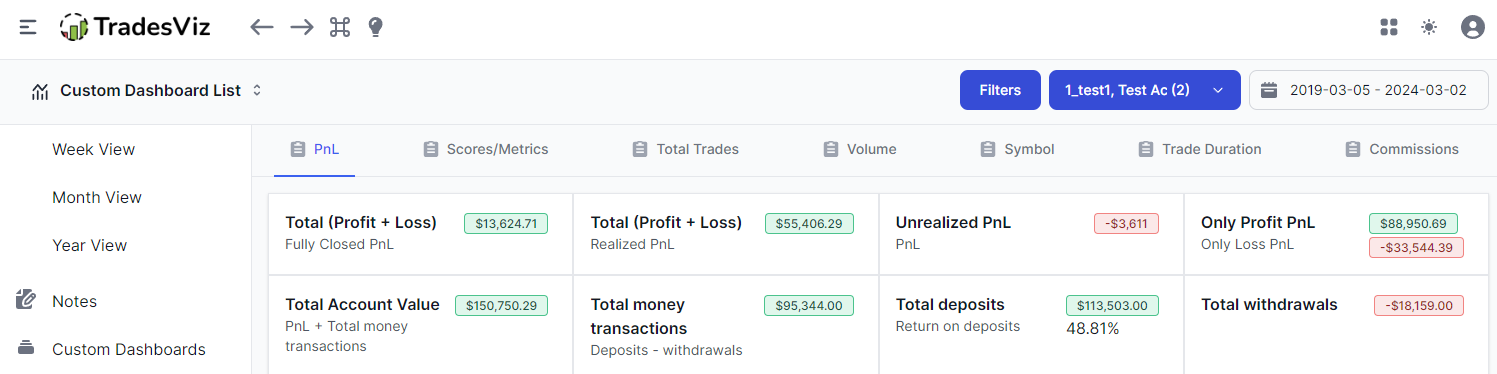
The chart you see on the main dashboard is ONLY PnL-based and so far the % increase is above the chart. Here's an example of what you might see in the overview dashboard:
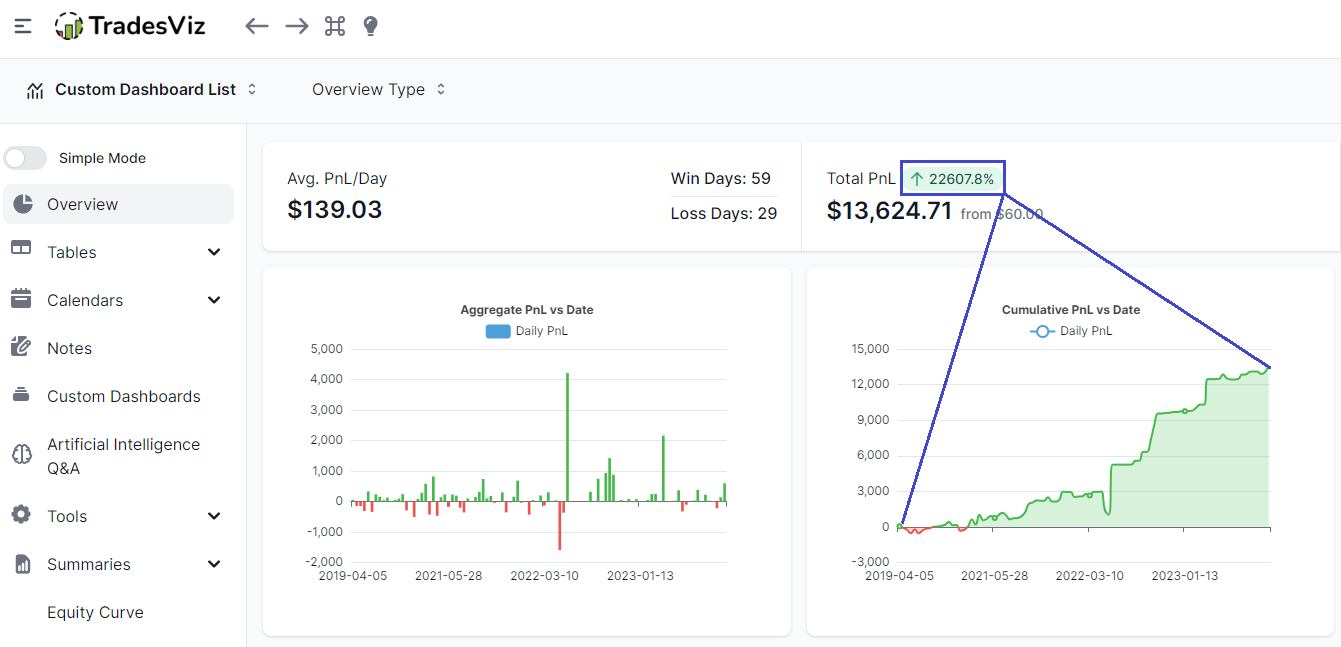
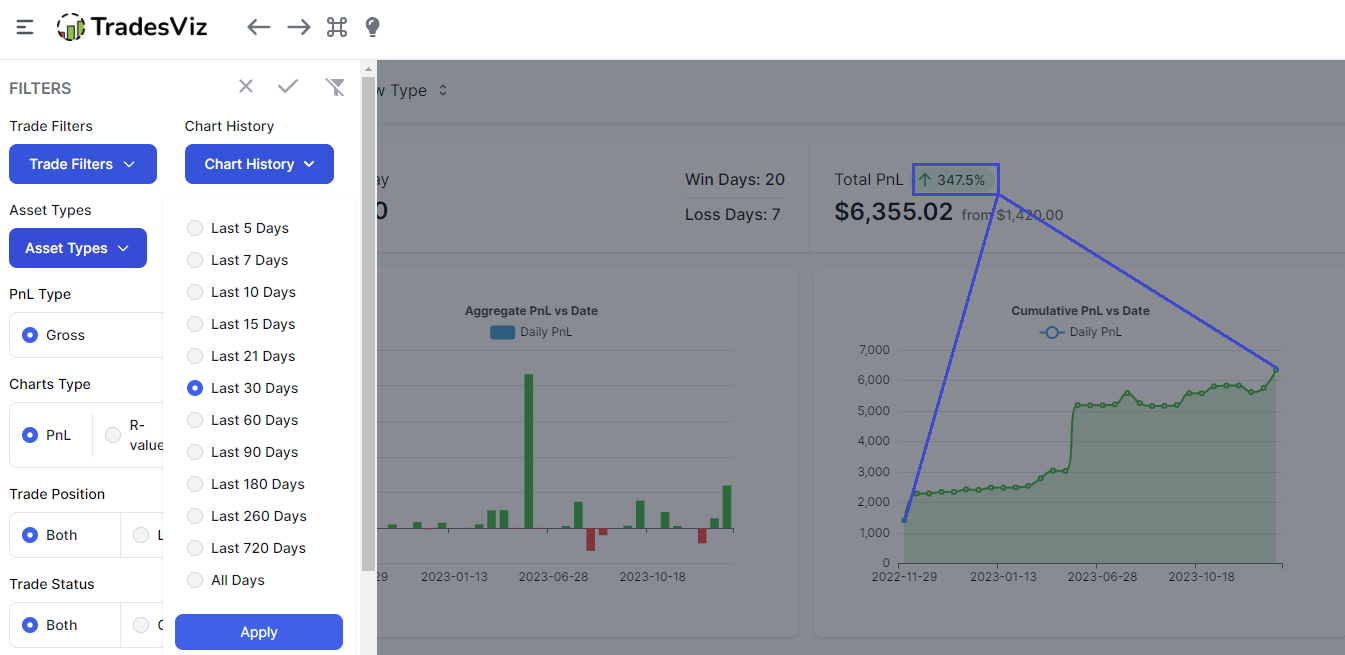
The % increase of 22607.8% is from the starting point on the left side of the chart - i.e. $60 to $13,624. This % is primarily used when you want to check the % increase from say, 30 days ago till now:
Last updated: March 3rd, 2024
We hope this feature is useful to traders of all levels - intraday, swing, and long-term, etc., If you have any questions, bug reports, or additional feature requests, please don't hesitate to contact us at [email protected]