You have seen charts, advanced charts, tables, advanced pivot grids, auto-insights, and a lot more that were introduced by TradesViz first in the trade journaling field.
But this feature is going to change the future of how traders interact with the data in their journals.
Another first in the trade journaling world: The use of A.I. to be able to ask your journal any questions you want about your data.
This is the first real usage of AI in a trading journal so far. If you have seen "powered by AI" anywhere in any other journal, we implore you to ask the creators, where and how the AI is used - you will probably not get a satisfactory answer...
As with all features on TradesViz, we fully describe how this works, how to use it, and how you can benefit from this feature in this in-depth AI query guide for TradesViz.
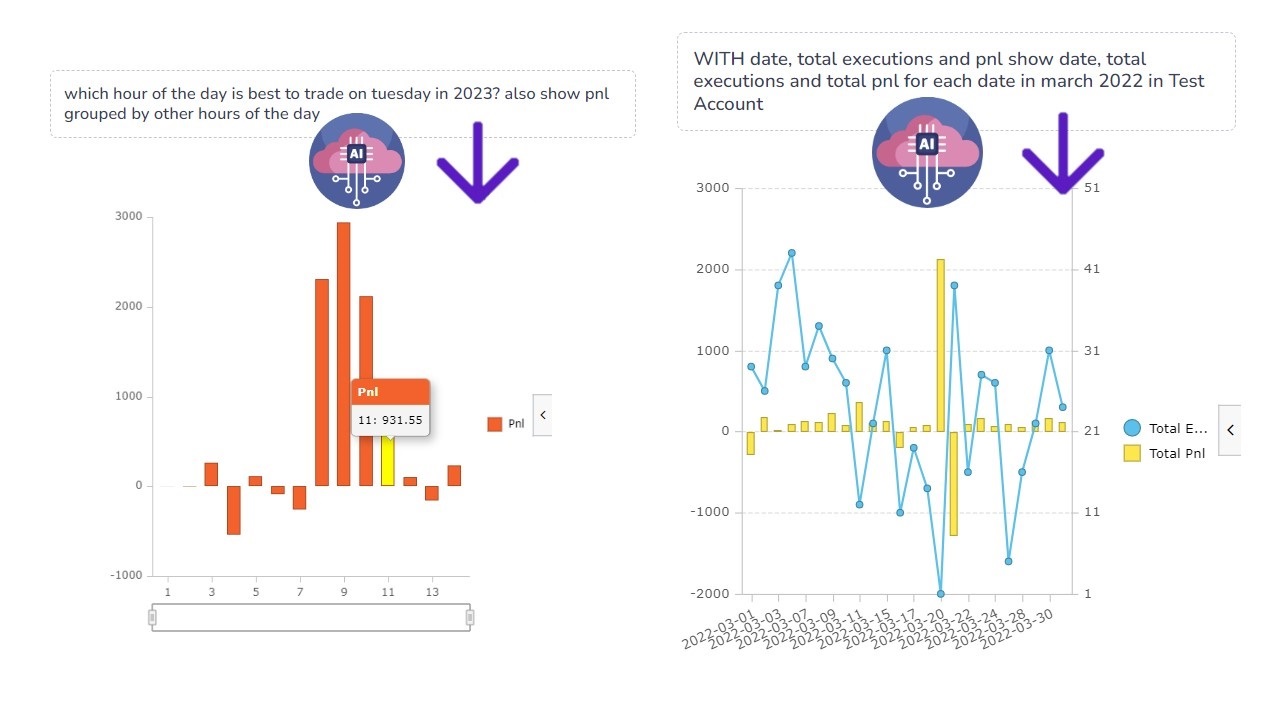
Have you ever had questions like:
or...
or...
TradesViz can now answer these questions.
Ask and you shall get the data and charts you are looking for.
Zero time spent in manual charting/table operations.
This is how you leverage bleeding-edge technology to become a 10x trader. Read on to learn more.
What does this feature solve?
So far, there we have introduced many advanced charting and tabular-based tools to quickly query your data and visualize them. It started with just simple charts, and tables and then later, we moved to custom dashboards. Finally, we launched pivot tables and charting that allows anyone to create almost any type of chart from 90+ data points.
All of these features require you to understand how the charting or tabular/grid system works. Once you get past that initial minor learning curve, you are able to leverage the full power of the TradesViz analytics system to visualize your data in any way you want and get extremely useful insights that can be game-changing.
We asked ourselves this: what if we can eliminate this learning curve?
What if, instead of the user having a question like "What was my best trade with the tag XYZ in the last 3 months" in their mind and then doing the filtering, sorting, grouping, etc., before arriving at the result, the user just asks the question and are presented with the answer?...
After all, the underlying data isn't going to change. All we're asking the users to do is to use the tools we have to query the data they have. So the goal became: how to eliminate the querying part. For this, we are using Artificial intelligence.
How does it work?
Enter OpenAI.
We're sure most users who are reading this blog are aware of the rapid advancements of AI models (to be more specific, at the time of writing this blog post, LLMs (large language models) and how OpenAI, Google, etc., are at the forefront of it (as of now...).
We are using OpenAI's GPT models to turn your natural language query into something the system/database understands so that instead of YOU manually searching, filtering, etc., the system does all of this for you and just gives you the answer to your question.
Your next obvious question would (or rather, should) be - is your data being sent outside our servers? The answer is a definite NO.
As defined in our policies and terms, we will never share your data outside. You own your data, you have full control over it.
We only use OpenAI's APIs to convert your natural language query to a database query that is then applied internally in our databases. This means, no data is shared from our side.
The downside? All queries are strictly objective only. You cannot ask the system for ways to improve your trading, you cannot ask the system what could have been done to avoid that loss. These types of questions require you to expose your data outside. However, currently, the system is limited to objective questions like "What is the best time to trade on the last week of February?", "What is the winning percentage of my trades made between 9 am 10 am on tuesdays and fridays?" - These questions can be answered by the system easily. It is also possible to construct very specific queries that even currently not possible to query manually via the tabular or charting systems.
That's exactly why we think this is a game-changer in trade journaling.
We get so many questions every day from users on how they can get a particular chart/data to be displayed in the way they want. Even though most of these queries can be achieved using our latest pivot grid system, there is a little bit of effort required.
But do keep this in mind: it's not even possible to do a fraction of what you can with TradesViz's analytics system on ANY OTHER ONLINE/OFFLINE journaling solution. If you are looking for a proper, well-designed way to analyze your data, there is no other alternative to TradesViz. Feel free to compare our features with ANY journal available.
This AI feature only takes the utility of TradesViz to another level. With guaranteed data protection, leveraging the most advanced technologies to help YOU find the answers to YOUR questions, TradesViz trading journal's analytics prowess is next to none.
Going forward, there will be many more features in TradesViz that leverage our current query system to provide you with better ways to interact with your journal. We also expect other journals and similar solutions to catch up using proper AI tech to provide users with better solutions - if not, you are simply not getting the value for your money.
While traders using TradesViz are able to quickly leverage our advanced charting, tabular, and AI solutions, traders of other journals are left to spend their precious time working with primitive technologies. Choose wisely going forward. Trading is a field where you try to build as many edges as possible and TradesViz's AI Q&A is the most powerful way to find your edge with your trading data.
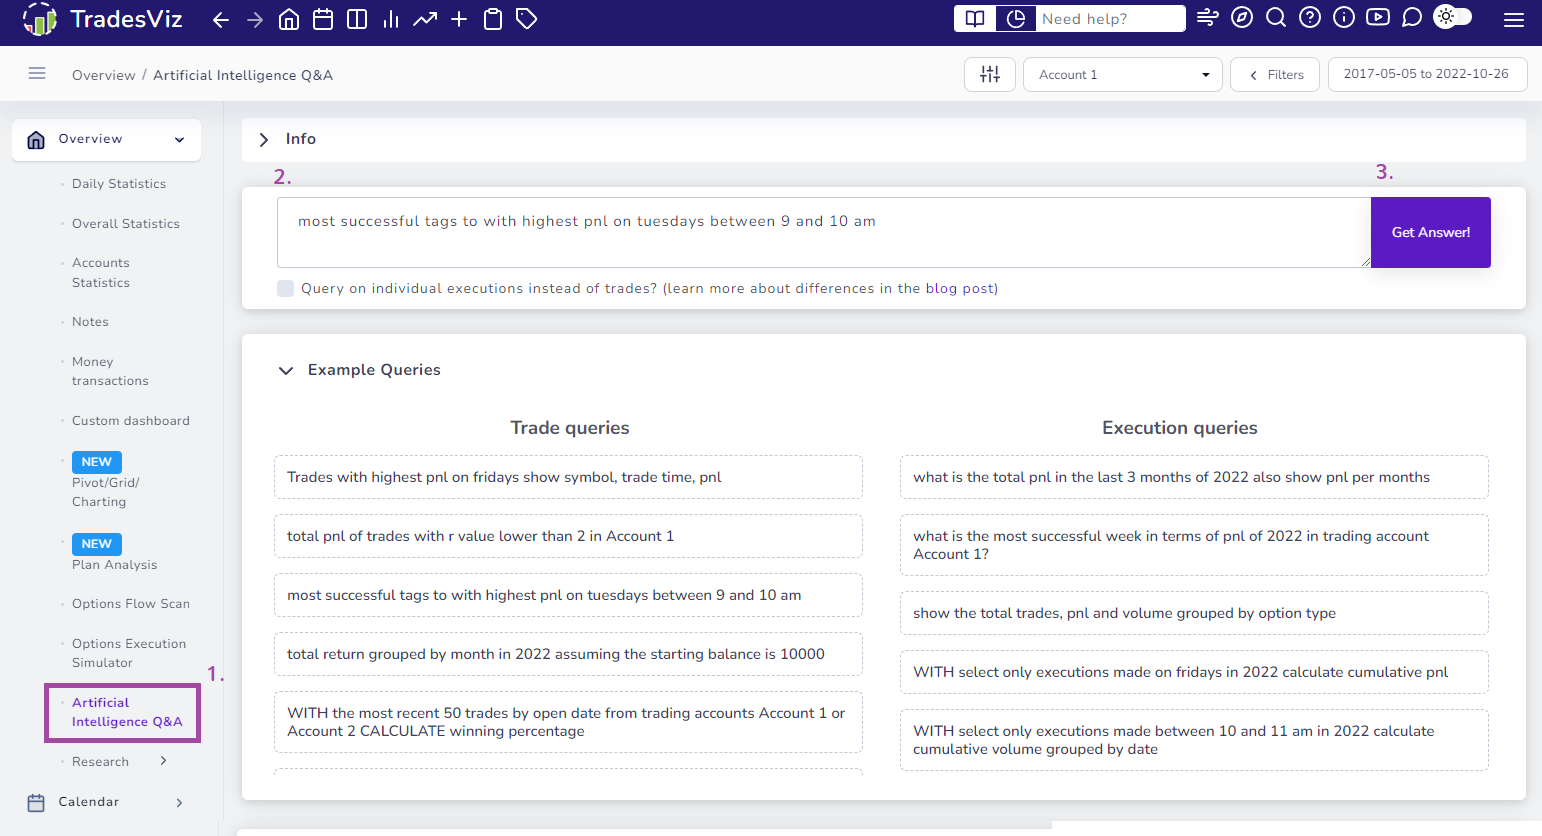
How can I use it?
Simple. Head over to the new Artificial Intelligence Q&A section by clicking on the relevant tab on the left side of your dashboard under the overview section, enter your query, and click "Answer". That's it.
Here are some FAQs you may have regarding usage:
A: At the moment, it's limited to Pro and Platinum.
A: Yes*. It's included at no extra charge.
* = 20 unique queries per day for Pro and 30 unique queries for Platinum tiers. Info on the query limits and how queries work in more detail in further sections of this blog post.
July 2023: The limit has been increased by 2x for both Pro (10 to 20) and Platinum (15 to 30).
A: Yes*.
* = Additional charges are applicable for an increase in the limit/usage of AI queries. These charges are separate from your Pro/Platinum subscription costs. Please contact us at [email protected] for more information.
How to construct these queries and how does the query system work?
The best way to think of this is as a system or a bot that understands precise and specific questions about your trading data. You may need to get used to the way you query the system initially, but keep in mind that as an AI system, even though this IS the state-of-the-art language model, there are limitations of understanding capabilities - especially when we are using the system to translate your query into an underlying language that can be understood by the databases.
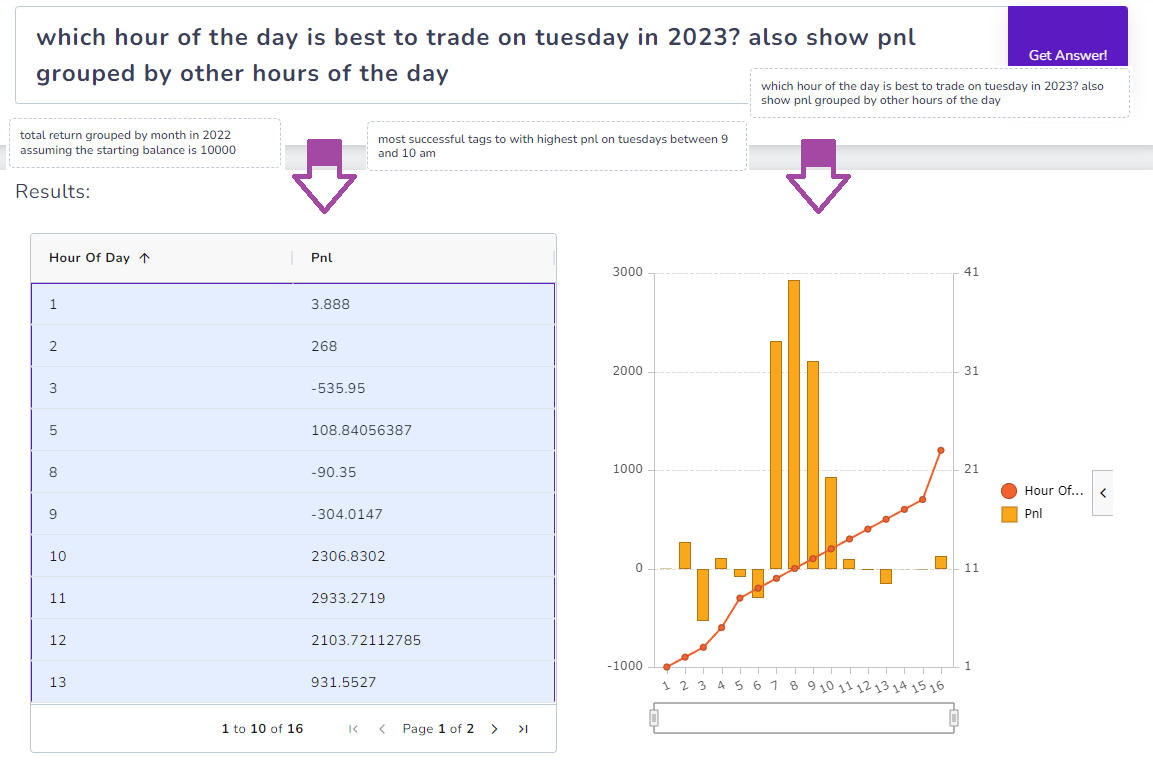
You can use almost all the columns you see in the trades table - pnl, volume, date, time, symbol, duration, etc., in your queries. Once the query result is returned, you will see a simple table and a chart next to it. This charting system and grid system are linked together (like just like in the pivot table). Meaning, the sorting table also sorts the charts, you can choose different types of visualization, choose to visualize specific data points, etc.,
Here is a complete example (click on the video to play):
Here are the important points to remember when constructing a query:
1. Data field names
Use only the column names in the trades table or names that are derivatives of the original column names. For example:
Why is the second query incorrect? because we don't have a "volume" field in the trades table. Remember you are essentially querying and visualizing the trades table.
2. Trading accounts
When you write a query without any trading account name, the system will apply the query on ALL the trading accounts you have.
Make sure to use the prefix "in trading account" before entering the exact trading account name.
Also, you need to make sure that you are providing the *exact* trading account name (correct spacing, capitalization) if you want the system to use only that account. Providing an incorrect account name OR providing no account name will result in the query using data from all your trading accounts.
3. Trades vs Executions
The system can query from both the executions data and the trades data.
What's the difference? The trades table has much more data w.r.t each trade because we're working with a fully completed trade. Data points such as r-value, trade duration, MFE, MAE, etc., are queriable if you use the trade table. This is the default query mode.
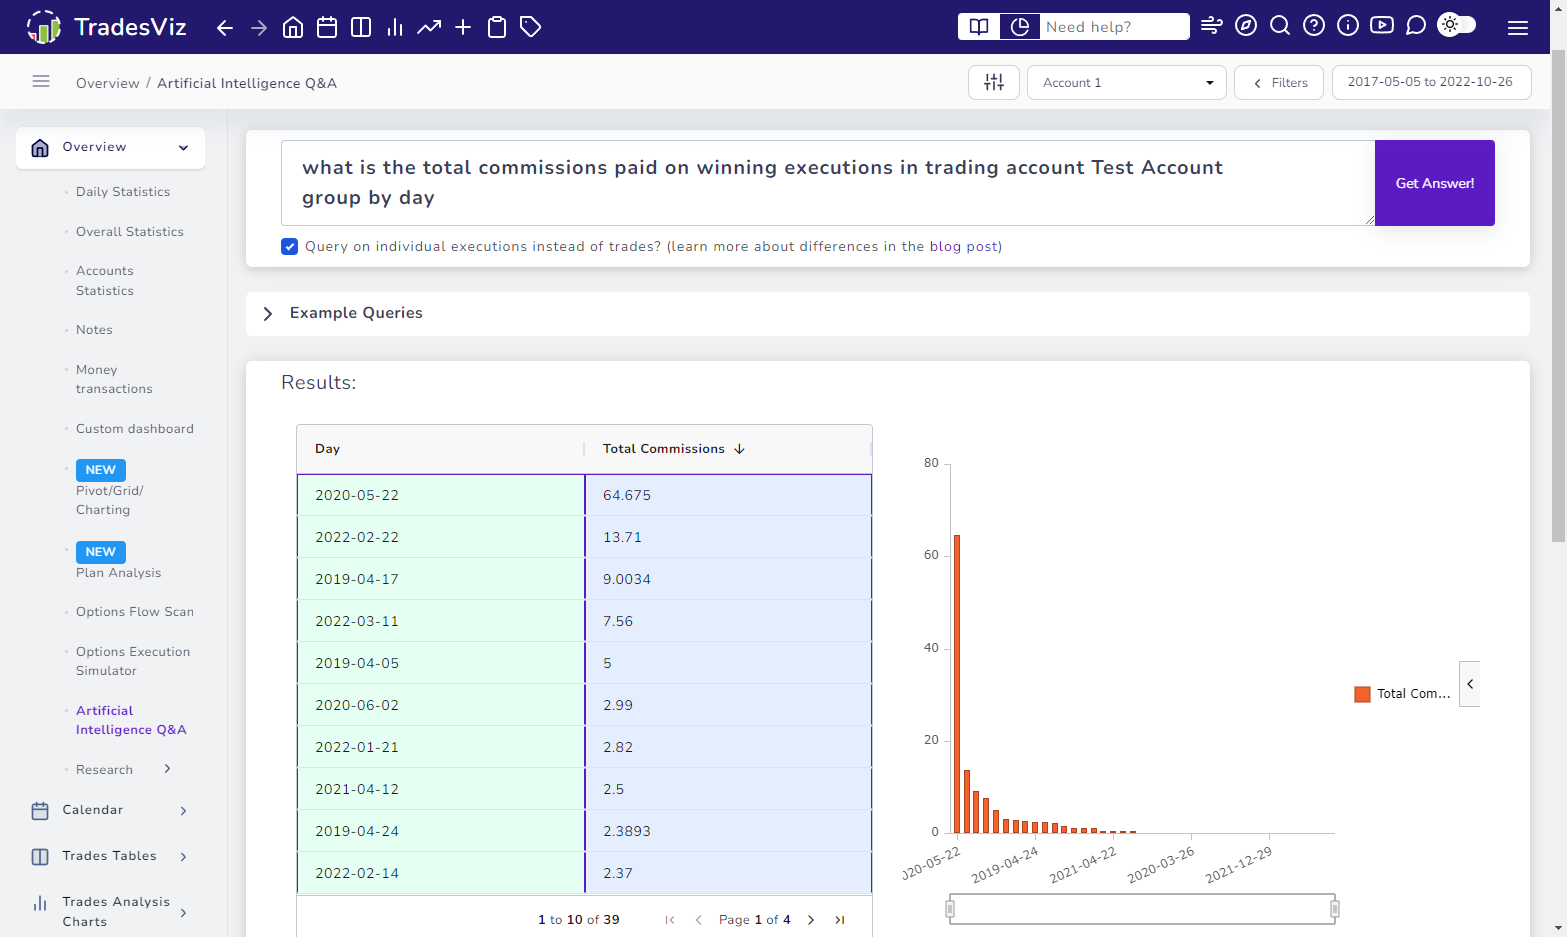
If you want more precise control in your query, you need to use the executions query mode which you can turn on by clicking on the "Query on individual executions instead of trades?" checkbox below the query input.
For example, here is a query that can only be done in the executions mode:
group by day
Result:
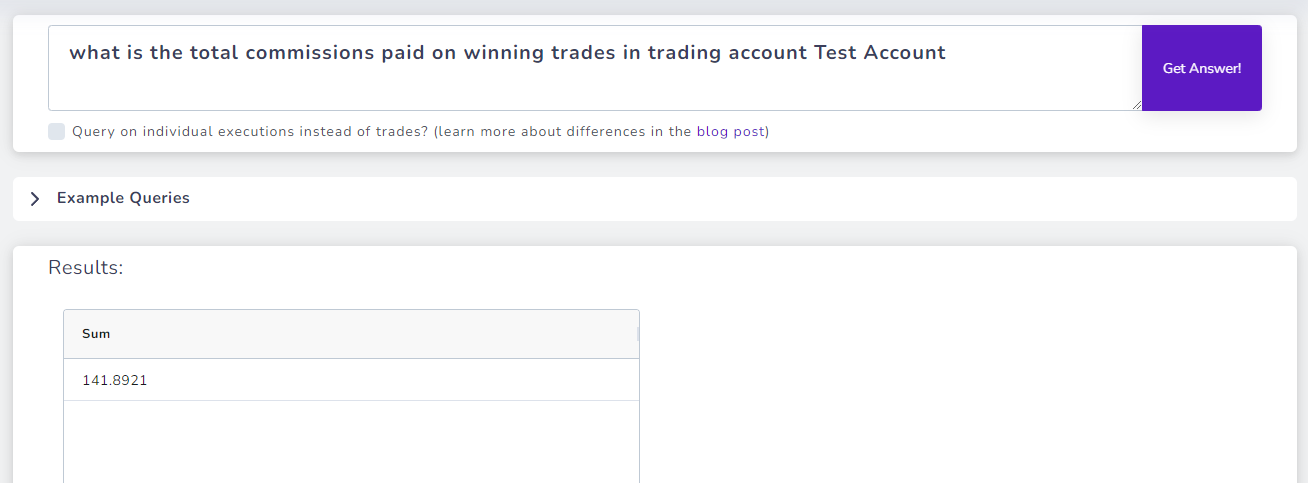
versus the following made on the default trades mode:
group by day
Result:
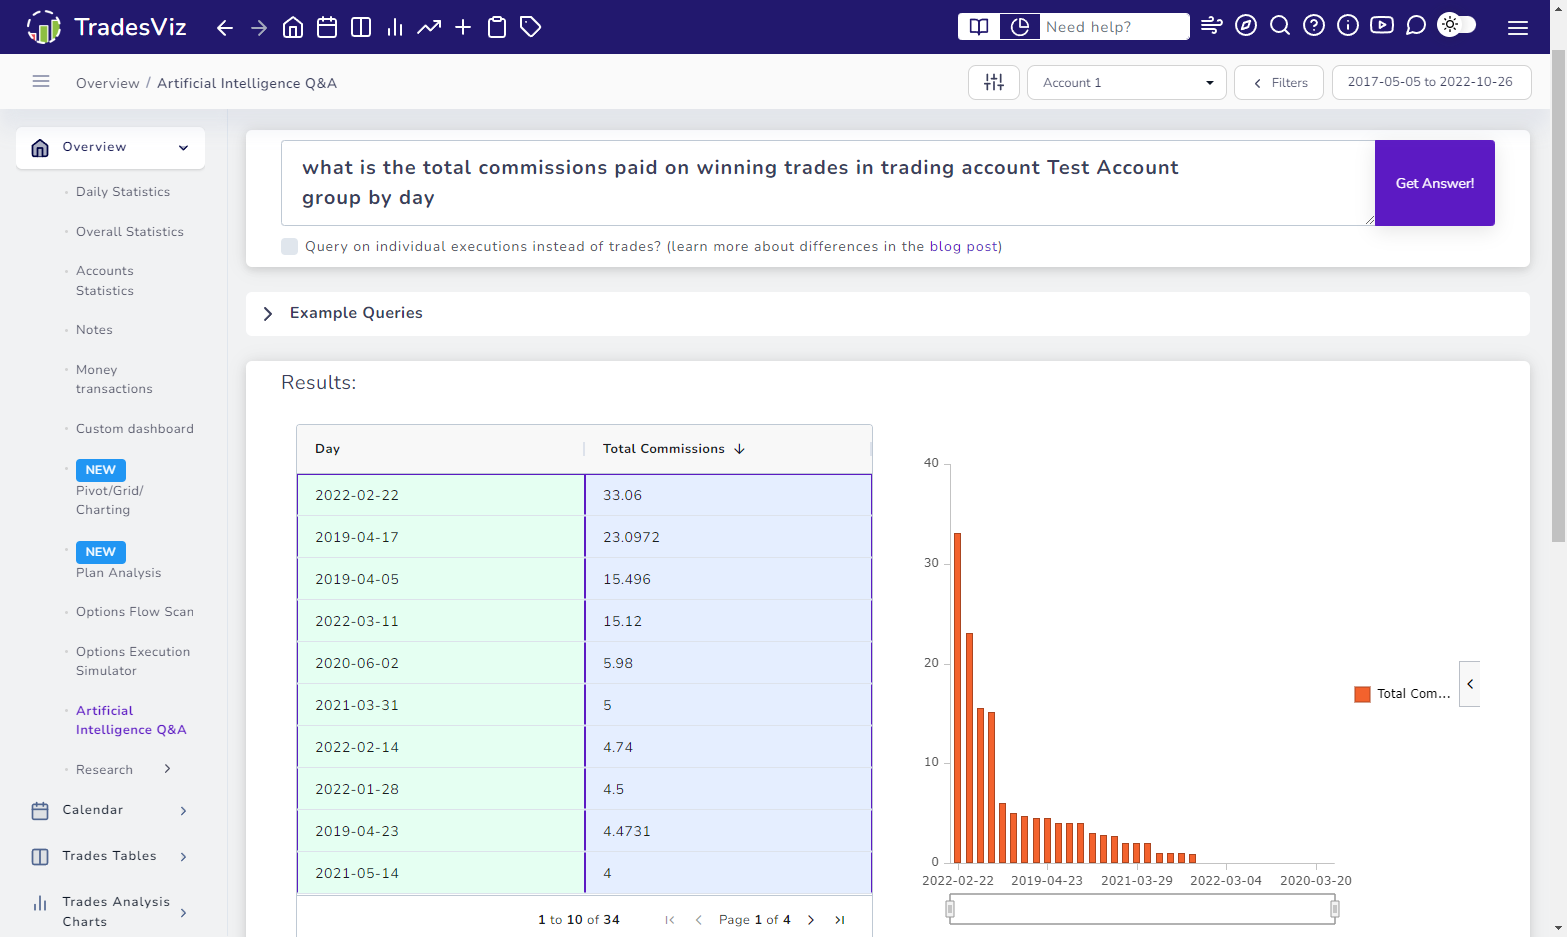
The former query will consider every single execution whereas, the latter will consider only the trades opened on Tuesdays and will consider the ENTIRE commission cost of the trade (whether the trade was swing or intraday). Please note you get completely different results by just changing a very small part of the query.
Similarly, if you trade a lot of options, you can use options fields like strike, expiry, and call/put in your query when you are using the executions mode.
4. Advanced query constructs
You might have noticed in the previous examples that we used a second line in our query:
group by day
This is to give specific instructions to the system on how the data should be processed - think of this as a pre or post-processing instruction - i.e, you are giving the system a step-by-step instruction on how you want the data to be processed.
Without the second line, the query:
Would simply return the following:
This may or may not be what you wanted to see. The additional query construction exists to give you more precise control over how you instruct the system to prepare the data.
There is no pre-defined list of constructs here. Our simple guideline is to be precise and unambiguous with your queries and additional constructs.
As we are dealing with natural language, there are countless combinations of valid construct queries - that's the beauty of this AI query system. Instead of a rigid system where you are only allowed to choose x or y or z, with this system, you have 100% freedom on how you want your data to be visualized to you.
It is also possible to add filters to your query. Like how you would add logical filters in tables, you can ask the same in natural language as a query. Here's an example:
where trade's quantity is greater than 10 and trading account is Test Account or Account 1 or Account 3
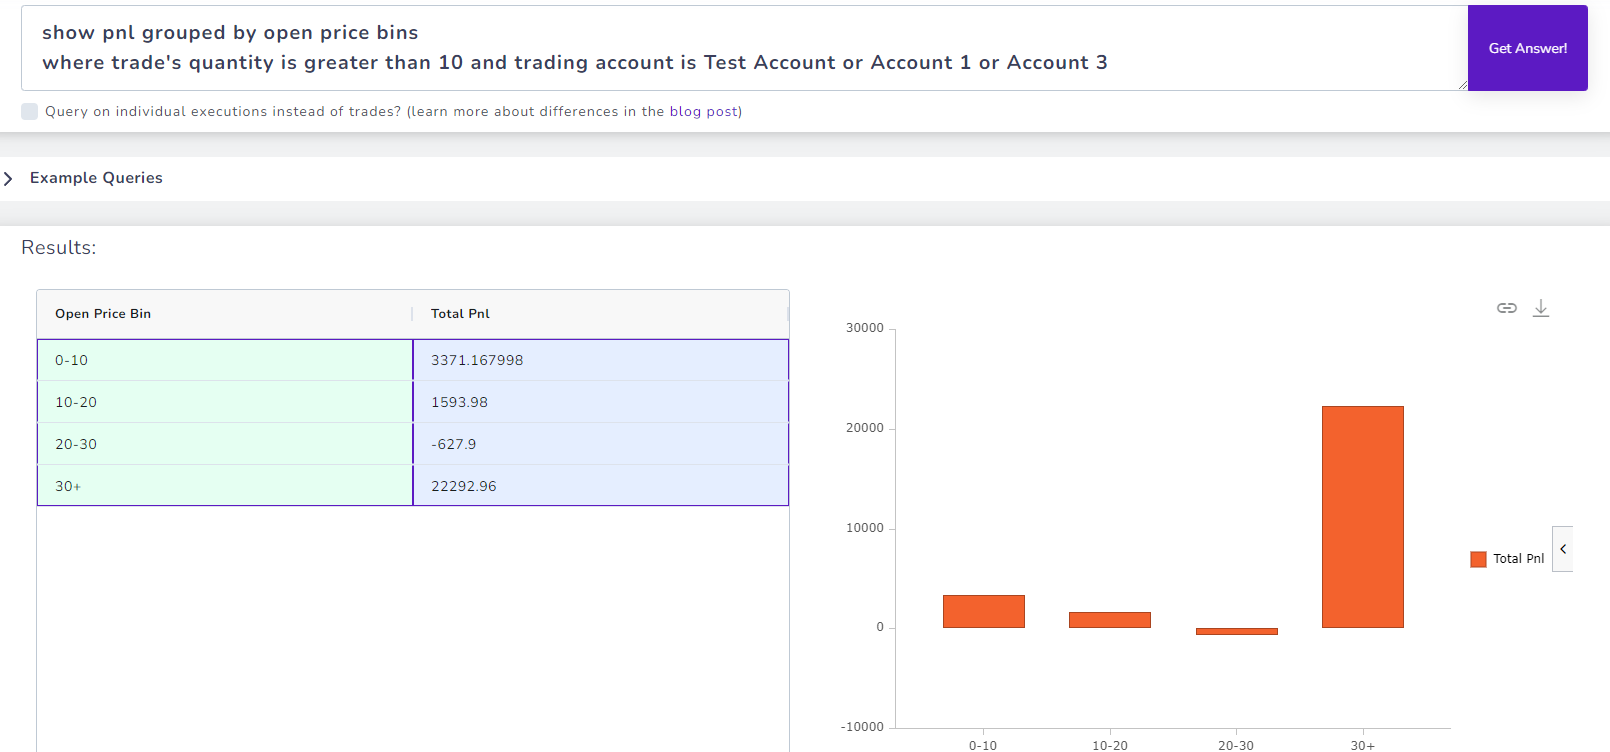
In the above complex query, we have used multiple filters and also have asked the system to create bins of a numeric field (open price). This is understood well by the system and the bins are created automatically.
While you can view this chart readily in the PnL anlaysis section, the point to understand is that even a complex function like binning + filtering + querying for specific data can now be accomplished by the AI Q&A tool saving you a lot of time when you want to do highly specific anlaysis.
To give you some real-world examples, we have a dedicated query examples section for each trade and executions types in the AI Q&A section itself:
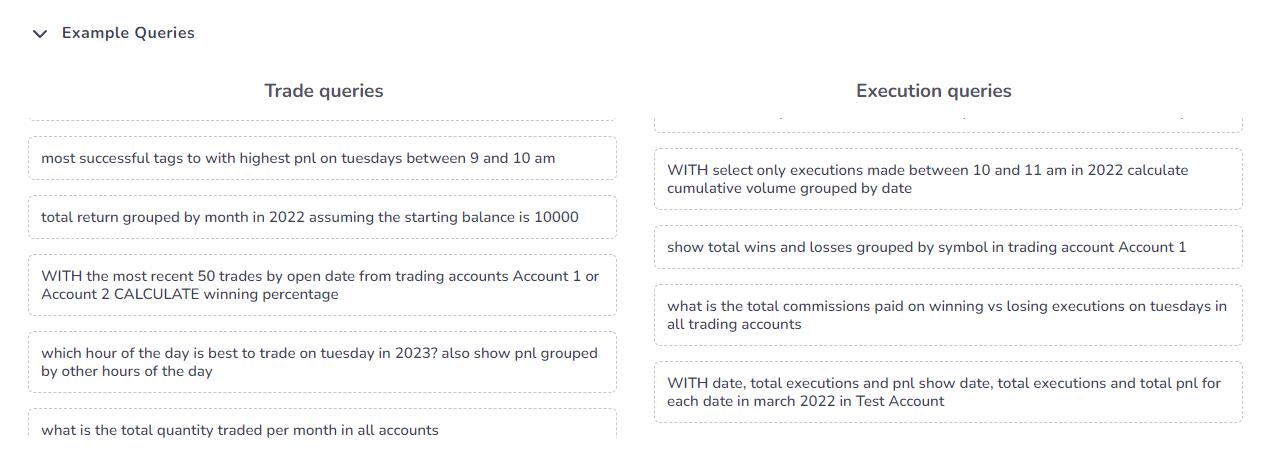
Click on any of the queries and it will be automatically copied to the query section. Use these examples as a starting point and start creating your own queries.
5. Query usage limits and cached queries (re-use)
Naturally, as you might have guessed, the potential usage of this system is going to be A LOT! Because, unlike rigid, structured systems, you may have 100s or 1000s of questions you may want to ask and potentially there are limitless combinations of questions because this is a natural language query system.
Since we are relying on OpenAI's API, we have to keep a cap on the free query limit to keep costs down. But don't fret - we have some cool tricks that you can use to essentially create a list of questions that are forever cached without depleting your usage.
You will notice that below the chart/data container, there is a table that shows all your queries and details about it:
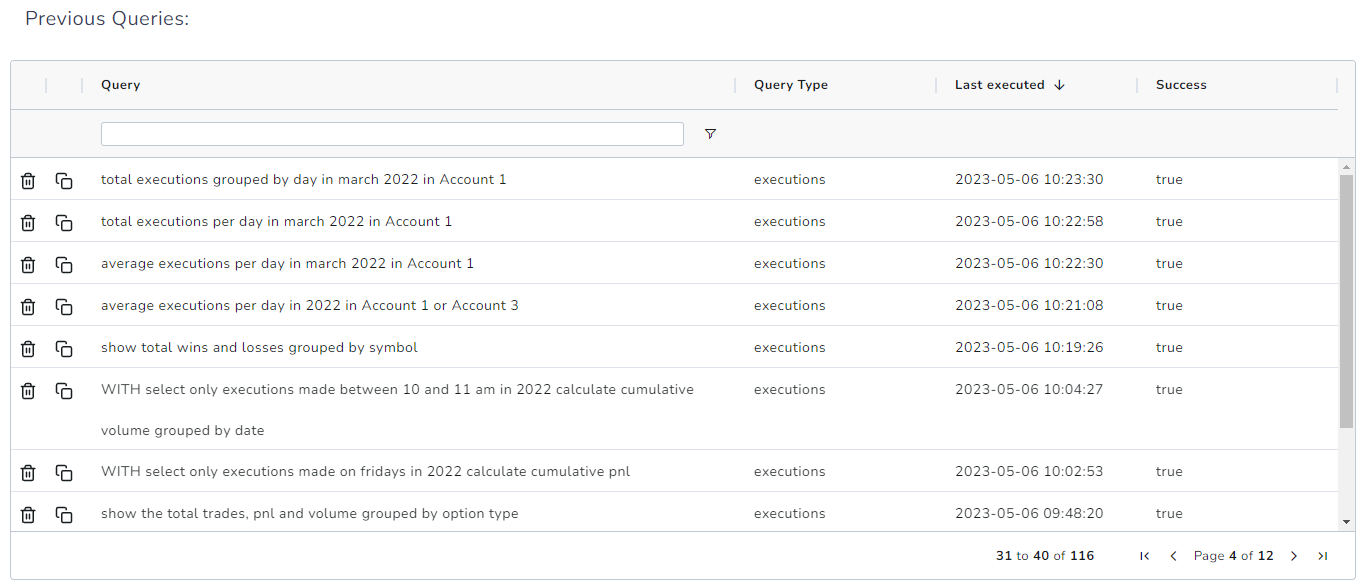
This table holds the record of all your queries, the type of query, the last date of execution, and whether it was successful or not. You can directly copy a query by clicking on the copy icon and delete a query by clicking on the delete icon.
Here's the important part: Executing an already existing query that previously ran successfully (Success: true) does NOT consume the daily Ai query quota.
This means you could have many pre-executed queries that are already cached and execute them anytime you want without depleting your AI query limit per day.
Note however that making even a single character change in the query will be treated as a new query and will consume the daily AI query quota.
Just as a reminder, the daily quota, for now, is 10 unique (now we hope you understand why we emphasize the unique part) queries per day for the Pro and Platinum accounts. We expect these limitations to gradually decrease - i.e. users being able to execute more queries per day as AI systems become more open and cheaper. But at the time of writing this blog and for the near-term future, we expect these limits to be adjusted to meet for demand for the usage of the AI query system.
Examples of the AI queries
The list of queries below are ones you can directly execute by clicking on the query in the example section in the AI Q&A tab. They are selected so that there is a certain variety in terms of the data queries and also in how the data is processed. They should serve as a useful boilerplate that you can modify to create more queries that are specific to your trading.
Trades AI queries:
-
Trades with highest pnl on fridays show symbol, trade time, pnl
-
total pnl of trades with r value lower than 2 in Account 1
-
most successful tags with highest pnl on tuesdays between 9 and 10 am
-
total return grouped by month in 2022 assuming the starting balance is 10000
-
WITH the most recent 50 trades by open date from trading accounts Account 1 or Account 2 CALCULATE winning percentage
-
which hour of the day is best to trade on tuesday in 2023? also show pnl grouped by other hours of the day
-
what is the total quantity traded per month in all accounts
-
on which symbols did I pay the most commissions and fees?
Executions AI queries:
-
what is the total pnl in the last 3 months of 2022 also show pnl per months
-
what is the most successful week in terms of pnl of 2022 in trading account Account 1?
-
show the total trades, pnl and volume grouped by option type
-
WITH select only executions made on fridays in 2022 calculate cumulative pnl
-
WITH select only executions made between 10 and 11 am in 2022 calculate cumulative volume grouped by date
-
show total wins and losses grouped by symbol in trading account Account 1
-
what is the total commissions paid on winning vs losing executions on tuesdays in all trading accounts
-
WITH date, total executions and pnl show date, total executions and total pnl for each date in march 2022 in Test Account
Be creative. There are no limits or bounds on what types of objective questions/queries you can create. Don't be restricted to the examples above. They are meant to be just a starting point.
Final notes
Going forward, we expect to use methods to make your analysis more efficient and seamless. With the AI Q&A system, you are now able to cut your analysis time down to mere seconds from a few minutes of searching, sorting, filtering, etc.,
TradesViz's charting and the tabular system are the most advanced and versatile in the world when it comes to trade journaling - this is SUPERSET of all features of every other journal and MORE.
You will not find TradesViz in the "compare" section of other journals that tout themselves as the "#1" or "most complete" or other useless platitudes. Why? Because the features we offer are far beyond what anyone else in the market has.
With this AI feature, we hope to give traders an even easier way to find their edge in the market in an effortless way. We hope to lead the revolution of journaling with the first journal to incorporate proper AI systems in the trade journaling world to provide useful, non-gimmicky trading edge-defining features to every trader in the world.
Want to learn more about how you can design advanced queries? Here's our new dedicated guide for advanced AI query examples:
https://www.tradesviz.com/blog/advanced-ai-journaling-guide/
April 2026 Update:
You can now directly add your AI query result to your custom dashboard!
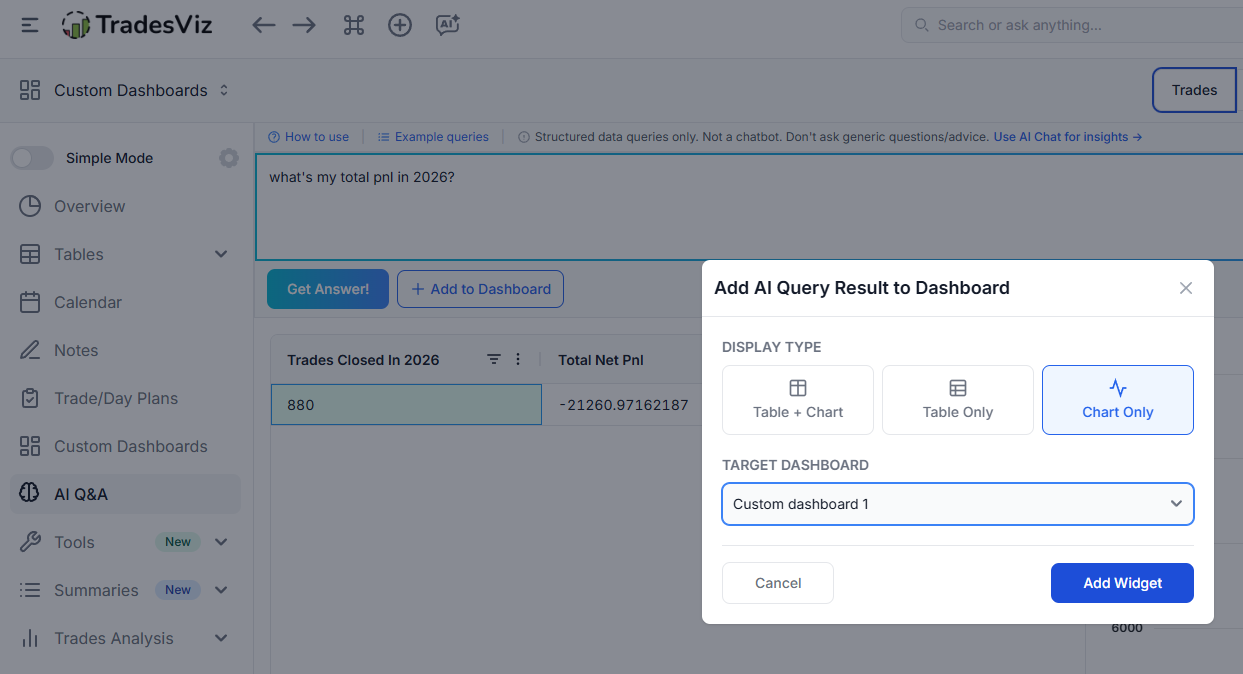
Read more about AI widgets here: https://www.tradesviz.com/blog/ai-custom-dashboard-widgets
Do you have any questions on building queries? More feature requests/ideas? Contact us at [email protected]!