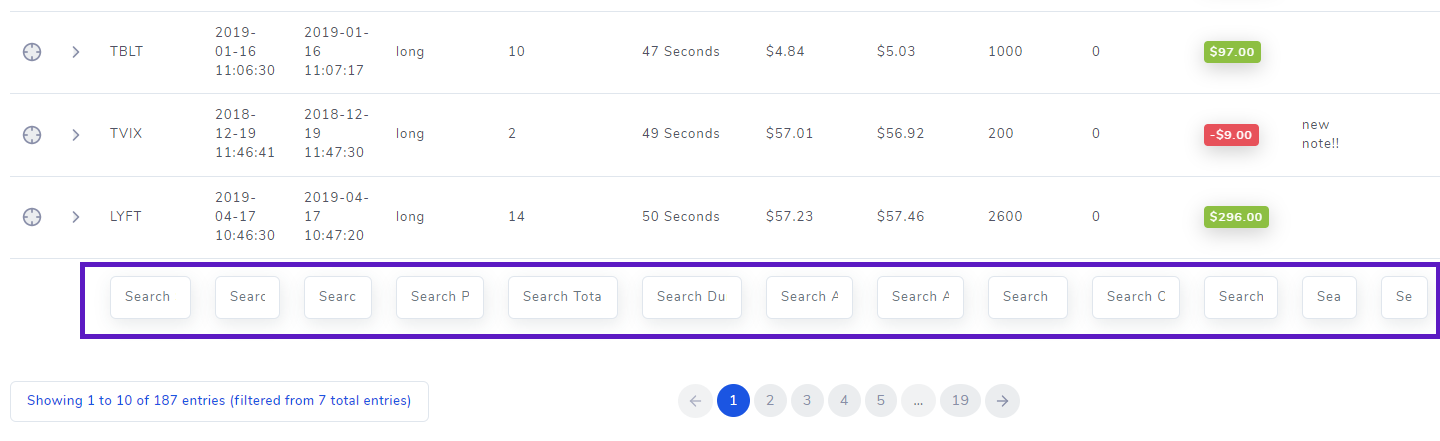
Note: Filters have been made VERY easy with the v2.0 dashboard update. Please check this blog for more info! You can access the search bar for each column by clicking on the 3 lines icon that appears when you hover over any column! This works for ALL grids in TradesViz v2.0!
A trading journal is not just a collection of 1000s of trades that are never meant to be looked at once it's logged. To make effective use of any journal, one must be able to quickly search and find the entries of a journal. Wouldn't it be nice if you can search for those winning trades you made a few years back shorting SPY? What about those swings you did just a few months back? how would you even go about accessing those trades quickly from a list of potentially thousands of trades? - You can do exactly this using the trades table filters!
There are about 16 columns in the trades table ranging from the open price of the ticker traded all the way to total % return on that trade. In TradesViz, you can individually filter every single column to exactly pinpoint the trades you've been looking for. We will group these columns into 2 broad categories. Ones where numbers are involved and ones where only text is available.
For all of these columns, there's a search column right at the bottom fo the table where you can enter text. You can turn any kind of query into a combination of logical expressions to get exactly the trades you want. We'll explore more about how to use this in this blog.
Numeric-based columns
The following columns are considered numeric columns:
- Total executions
- Duration (hybrid)
- Average open and close prices
- Total volume
- Open position
- PnL
- Total commission and fees
- Return %
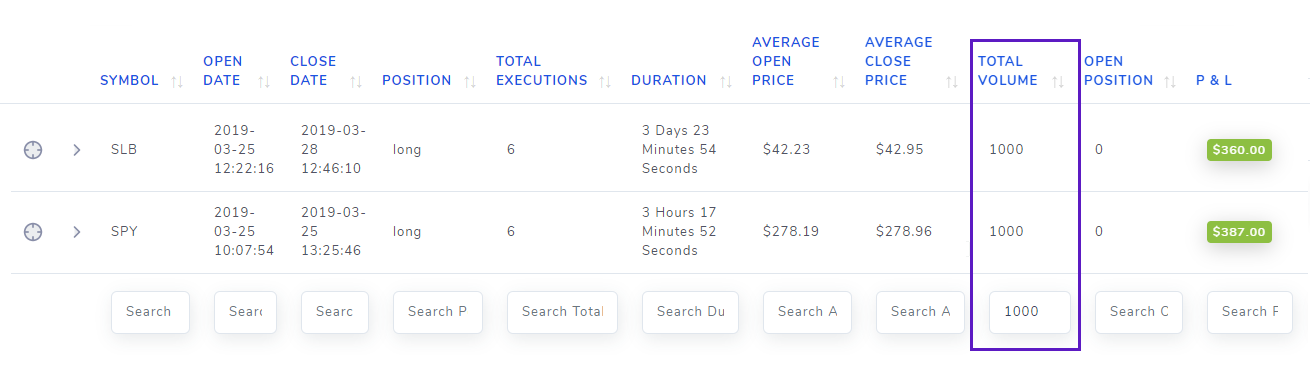
The search syntax and logic for all these columns are very similar. If you want to search for an exact number, just enter that number in the box. For example, if you want to search for trades with exactly 1000 volume (can be shares/contracts or any "quantity" based number for a particular trade), then enter 1000 in the box under the total volume column.
You can start to construct more powerful filters once you learn how basic logical operators work. For example, if you want to simply search for a range i.e, stocks between $10 and $20, then just input the following in the box under the average open price column.
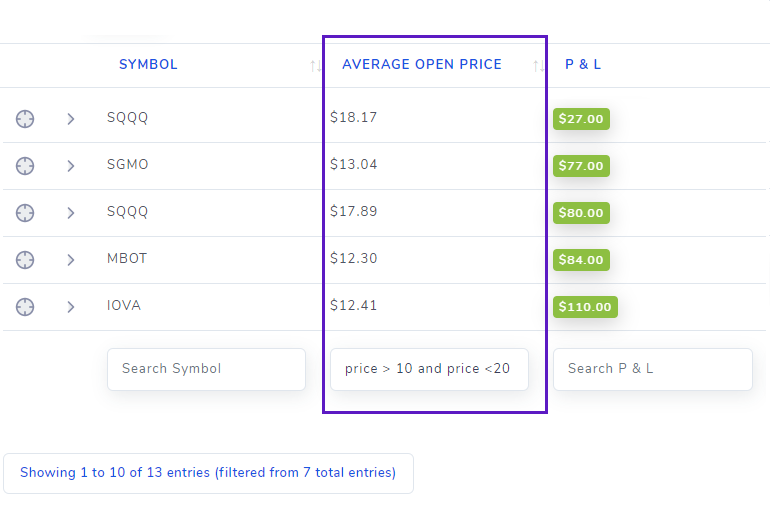
Similarly, you can also construct complex queries like:
With this, you can get a list of stocks whose price is either too low (but between a defined range) or too high. This is useful in several cases like for example if you wanted to compare and list trades of penny stocks and mid-caps and look at your PnL etc., If you want to compare such groups, then you would have to take a look at the compare grouped trades section which goes in-depth into how you can construct extremely customized groups (potentially pertaining to your strategies) and then generating graphs to compare them side by side.
Note here that, for the technically inclined that `price` is just a placeholder for any identifier. It can be `p` or `x` or word. What is important is the format and the syntax of the query.
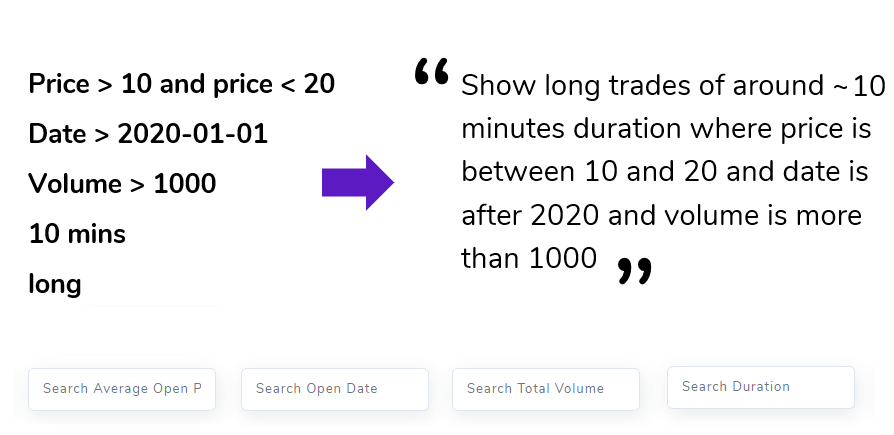
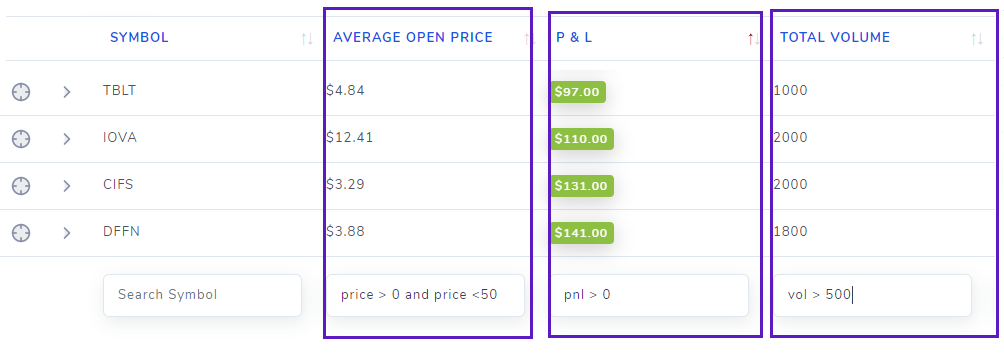
We'll end this section with an example of combing other columns to provide even more powerful filters. Note that, each of the individual column's filter is applied with an `AND` clause - meaning, trades will only be shown if all the filter queries of all the columns are satisfied. For example, if you wanted to look at all the winning trades where the price is between $0 and $50, and total volume is lesser than 500, then you would enter:
in the open price column text box
in the total volume text box
in the PnL text box
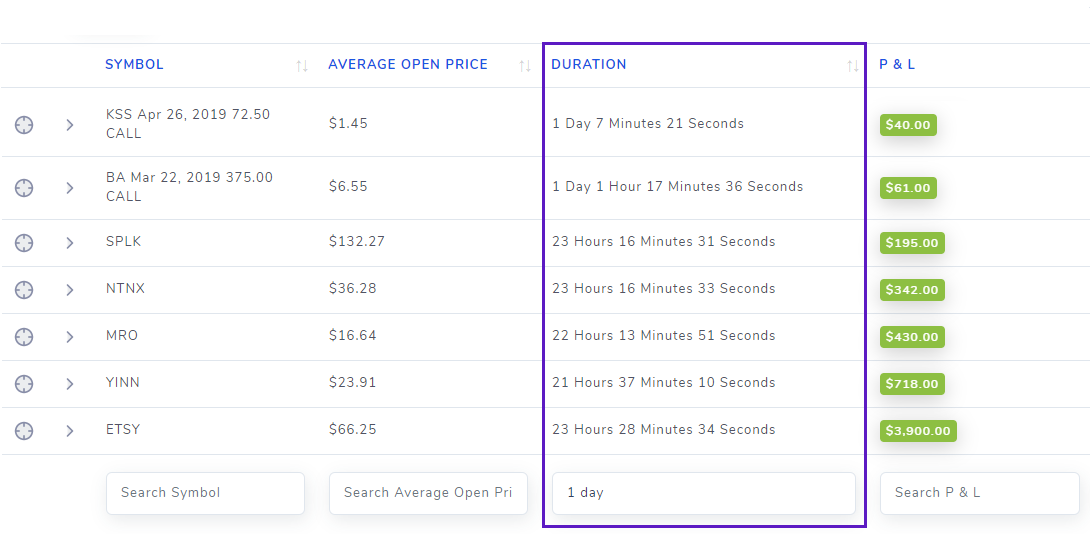
Finally, we could like to include a short note about the duration column which we marked as "hybrid" in the list of columns above. The reason we marked it is that you can filter duration in 2 ways:
Enter a duration string directly - which will search for trades that are around or are similar to the mentioned duration. For example, you can enter "1 day" or "1 d" and the trades that have a duration of approximately 1 day (+ or - 10%) will be shown.
Alternatively, you can also query duration just like price, volume, pnl, etc., by using logical expressions. But beware that the number input for comparison can only be in seconds! Meaning, if you wanted to find trades that lasted anywhere from 10 to 50 minutes, you would have to enter:
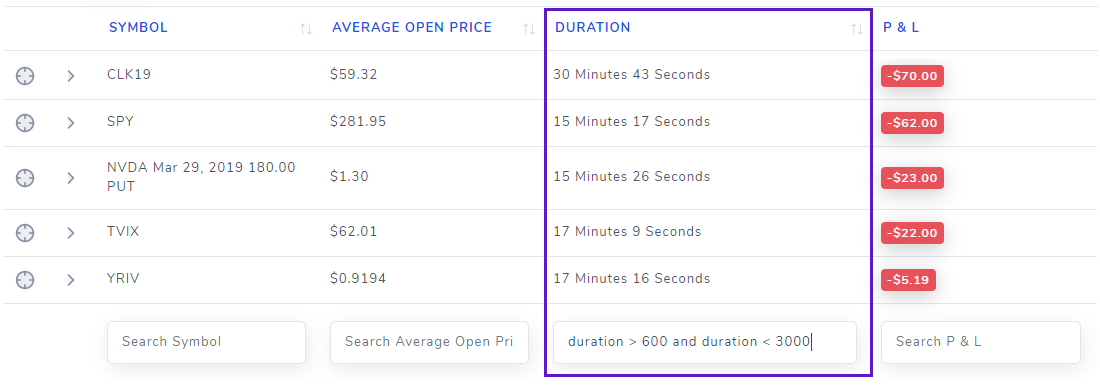
Coincidentally, we seem to have found a duration range that totally does NOT work for our trading style! :D This is the power of TradesViz filters!
Text-based columns
The following columns are considered text columns:
- Symbol
- Position
- Notes
- Tags
- Open and close date (hybrid)
Text-based columns are a bit simpler and limited in terms of searching capabilities compared to numeric columns with the exception of open and close dates which can be used exactly like numeric columns albeit with dates. For all other columns - symbol, position, notes, and tags, there are a few ways with which you can construct complex filters. Let's look at some examples below.
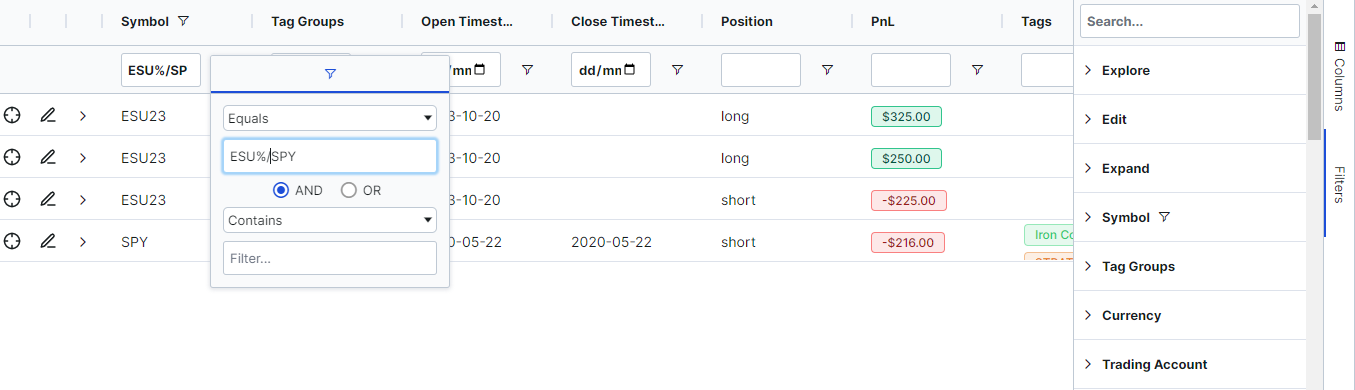
First, you can search for symbols using just the symbol's same - that's simple enough right? But you can also search for symbols similar to a given query! For example, entering the following in the text box below the symbol column returns only SPY stock trades.
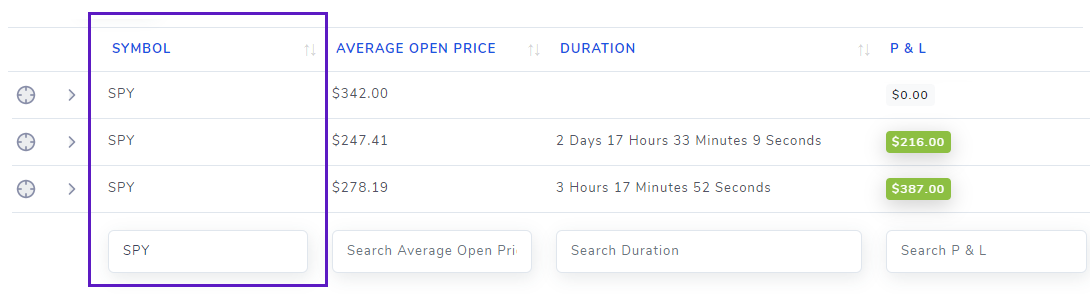
But, when you add the character '%' to the end of the input query string, you get this:
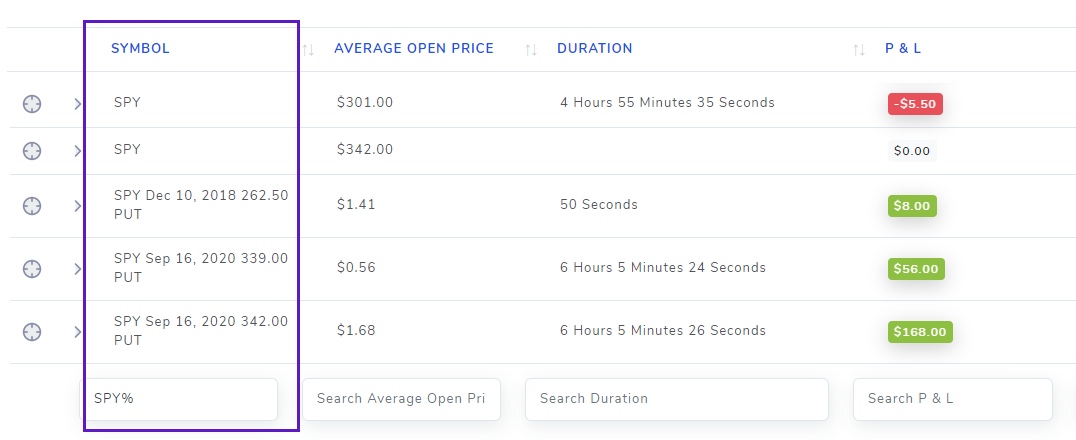
The difference? You now get all the symbols that start with SPY and end with any character/words - simply put, you can query for SPY options and/or just SPY stock with the inclusion or exclusion of the percent character.
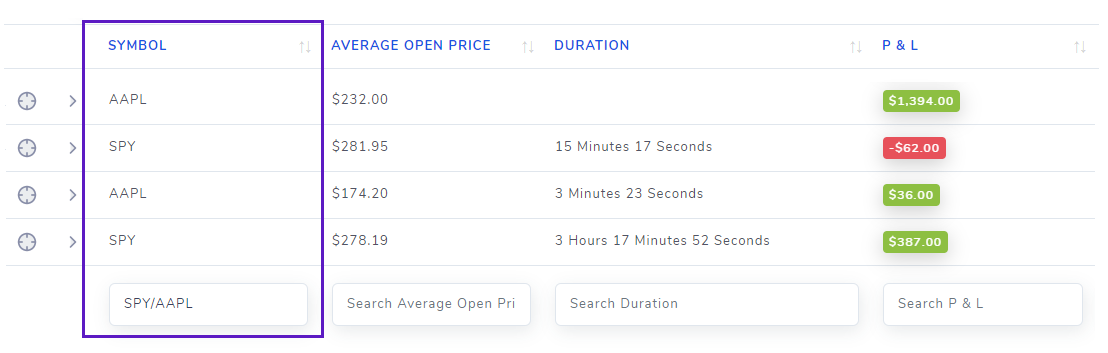
What if you want to search for more than one symbol? We've got you covered! Just add all the symbols you want to search for with a '/' character (a forward slash) in between them. For example, if you want to list trades on AAPL and SPY trades, then the input would be:
Finally, you can also exclude a stock by adding an exclamation mark before the symbol like below:
Note that this only works for a single symbol and you cannot enter any other symbols along with it. You can also combine the '%' wild card operator to exclude all symbols starting with a particular set of characters - for example: !SPY% to exclude all SPY stocks, options, and other symbols that start with SPY.
You can also exclude or exclude multiple symbols using a different separator:
The above will exclude all SPY stock trades and all AAPL stock and option trades since we also added a % sign at the end of the AAPL. Note the use of a comma (,) instead of a slash to tell the system that we want ALL the conditions to be satisfied.
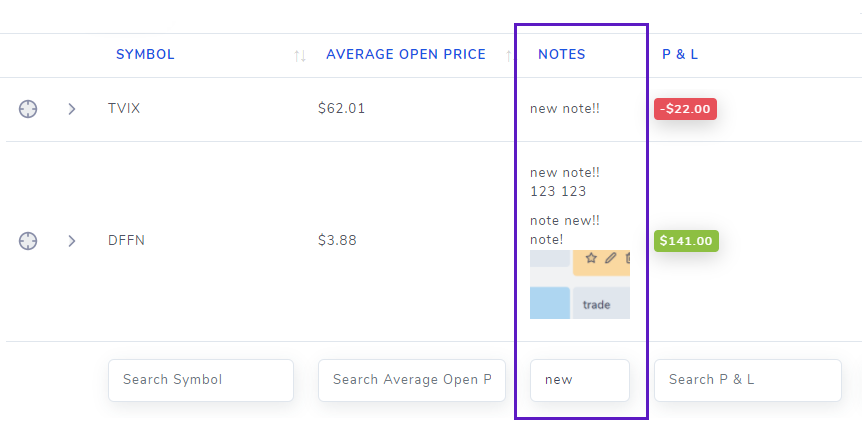
Next, we will look at examples of filtering notes and tags columns. Since pretty much any character can exist in your notes, any entered trades with notes that contain the input text will be shown. In the example below, we search for any note containing the text "new".
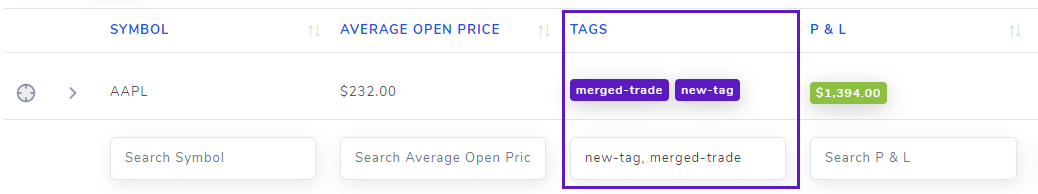
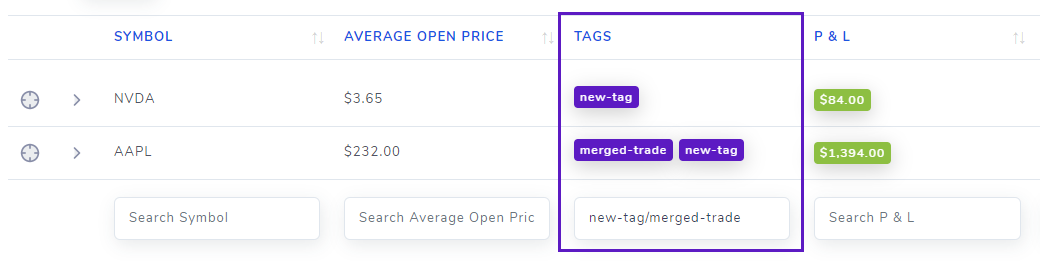
With the tags column, you gain a bit more freedom - you can search for single or multiple tags. There are 2 ways you can use multiple tags in the search input:
Split the search input tags by ',' (comma) character: This is the same as saying you want ALL the tags given in the input to be present in the trade. Example:
Split the search input tags by '/' (forward slash) character: This is the same as saying you want ANY of the given tags in the input to be present in the trade. Example:
For the side/position column, the input space itself is very less - just "long" or "short" will suffice if you want to show only long or only short trades.
Another nifty feature of the tag search is, you can enter the text %notag% and it will return trades that do not have any tags in them. This special tag can also be used in the global filters inputs on the top right of your dashboard.
The date column is also a hybrid column just like the duration column we discussed in the numeric column section. It can be used in 2 ways:
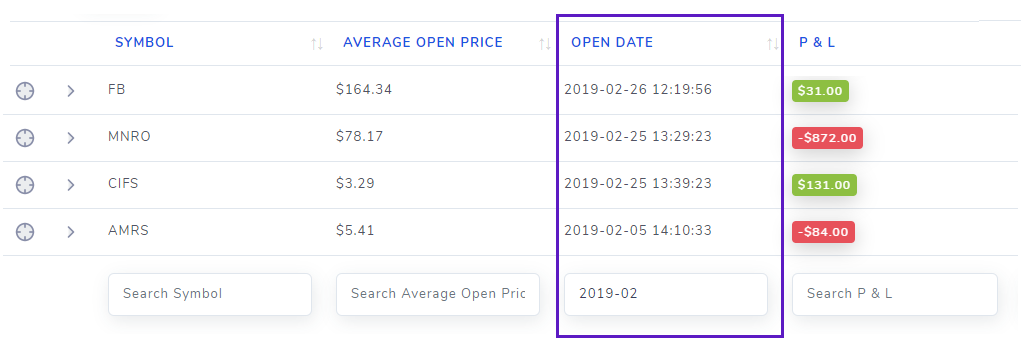
Querying for a particular date or month or year: In this case, inputs such as:
are all valid! For example, the 2nd query (2020-02) will return all trades made on Feb 2020:
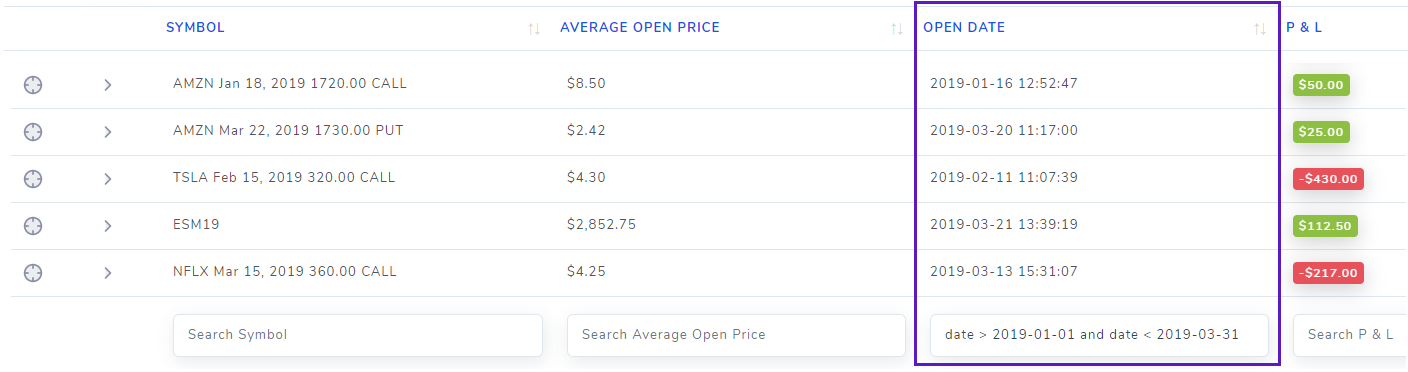
Using logical operators: Just like the examples in the numeric columns, you can query for ranges for dates - for example, displaying trades for only the first 3 months of 2019 could be written like this:
A combination of these filters can translate to pretty much any sort of filtering query you can think of. Getting used to writing complex queries to filter exact trades you want might be a bit difficult at first but it's highly worthwhile to explore this very powerful feature! You can always contact us at [email protected] if you need any assistance in creating queries or if you have any questions about query syntax.
With these features and filtering methods, there are potentially unlimited no. of ways for you to quickly access your trades from your trading journal on TradesViz. We are constantly working on adding new features based on your feedback! Please let us know your thoughts, feedback, and feature requests by sending an email to [email protected]