Introduction
15 min read
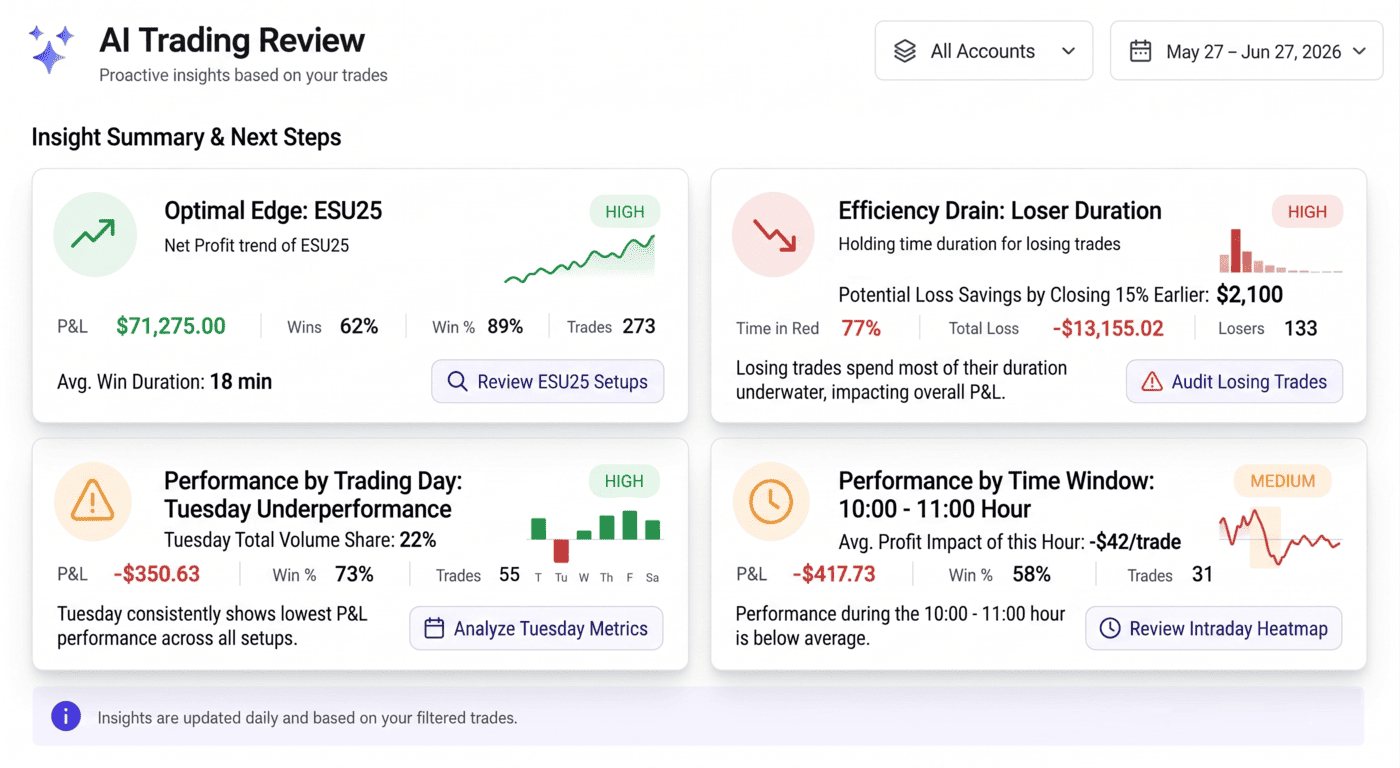
AI Trading Journal Insights: Proactive AI Coach For Your Trades
Proactive AI trading journal insights: TradesViz AI Coach runs sixteen statistical checks on your trades and shows the highest-impact leaks to fix next.
![[Updated] Chart View in TradesViz v2.0: Fastest way to review trades visually](/media/blog/chart_trades_view_new/chart_trades_view.png)
![[Updated] Everything you need to know about tags, managing and organizing tags in TradesViz trading journal v2.0](/media/blog/tags_complete_guide/tags_complete_guide.png)