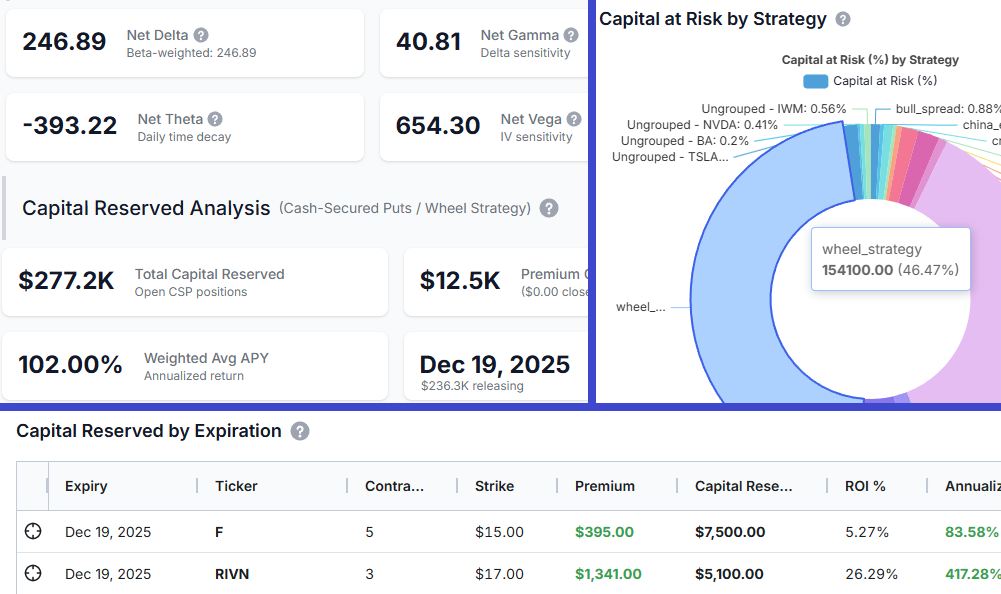
The Options Command Center Dashboard: Your Portfolio-Level Greeks & Strategy Management Hub
Introducing TradesViz's new Options Command Center Dashboard - a portfolio management hub for options traders. View aggregated Greeks (Delta, Gamma, Theta, Vega) across all positions, group multi-leg strategies with tags, analyze capital at risk with interactive treemaps, and track position-level details with drill-down leg views.
New Ways to Visualize Your Trades: Practical Examples Using Grids in TradesViz Trading Journal (AI, Pivot & More)
We've had a lot of new types of analysis created from the grids and charts of TradesViz over the years. We just launched an update to the no. of chart types you can make - this greatly improves the utility of pivot grids and the AI widgets! This new list includes box plots, treemaps, waterfall charts, range bars, and more!
[Updated] Chart View in TradesViz v2.0: Fastest way to review trades visually
Revisiting the original chart trades view feature introduced in 2022, updated with many features and enhancements over time. This still remains the fastest way to review your trades with charts in any online trading journal.
New Overview Type: All-in-one + New widgets + Multi-table mode
A new overview after a long time! Explore to learn about the design decisions!
New custom dashboard widgets: Pie charts, combined statistics and compact charts!
One of the most used features of TradesViz - the 100% custom dashboard gets 10+ new widgets and variants for ALL bar and line charts! With this, you can create compact dashboards that show you exactly the metrics you want visualized the way you want!


