Introduction
6 min read
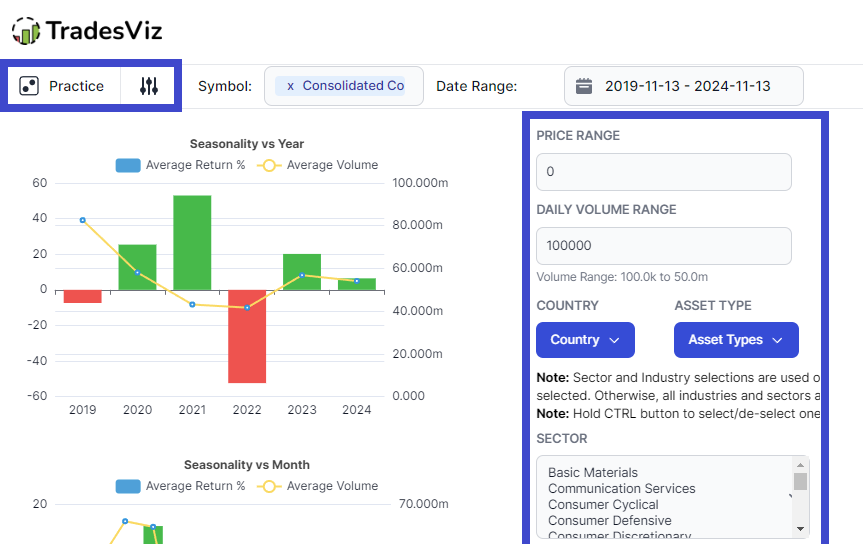
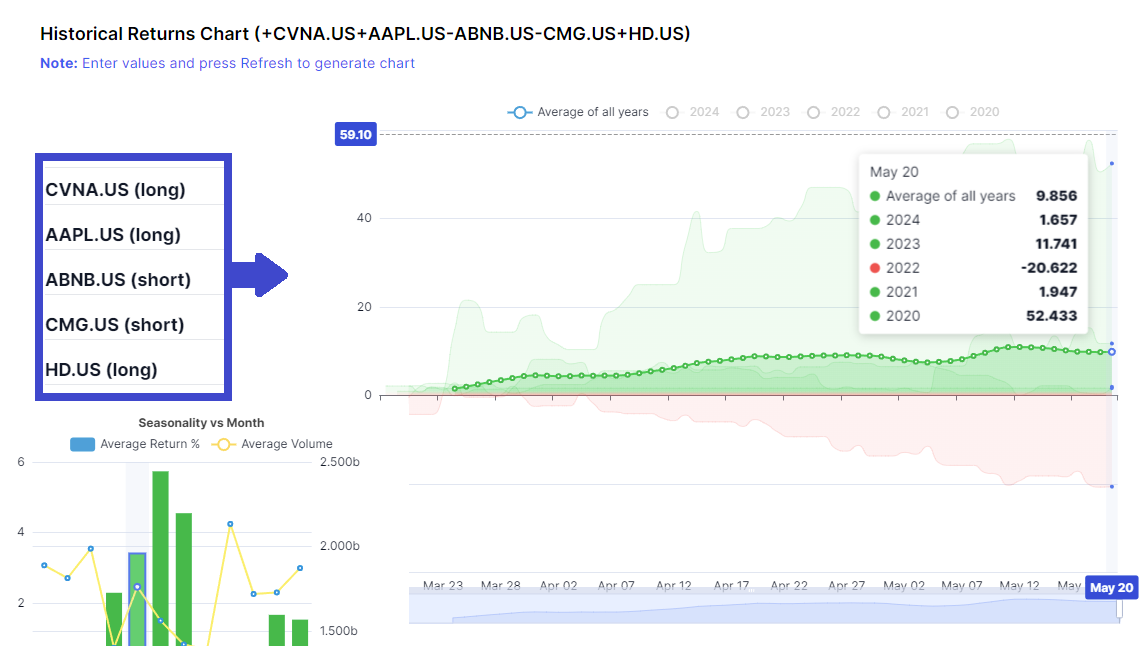
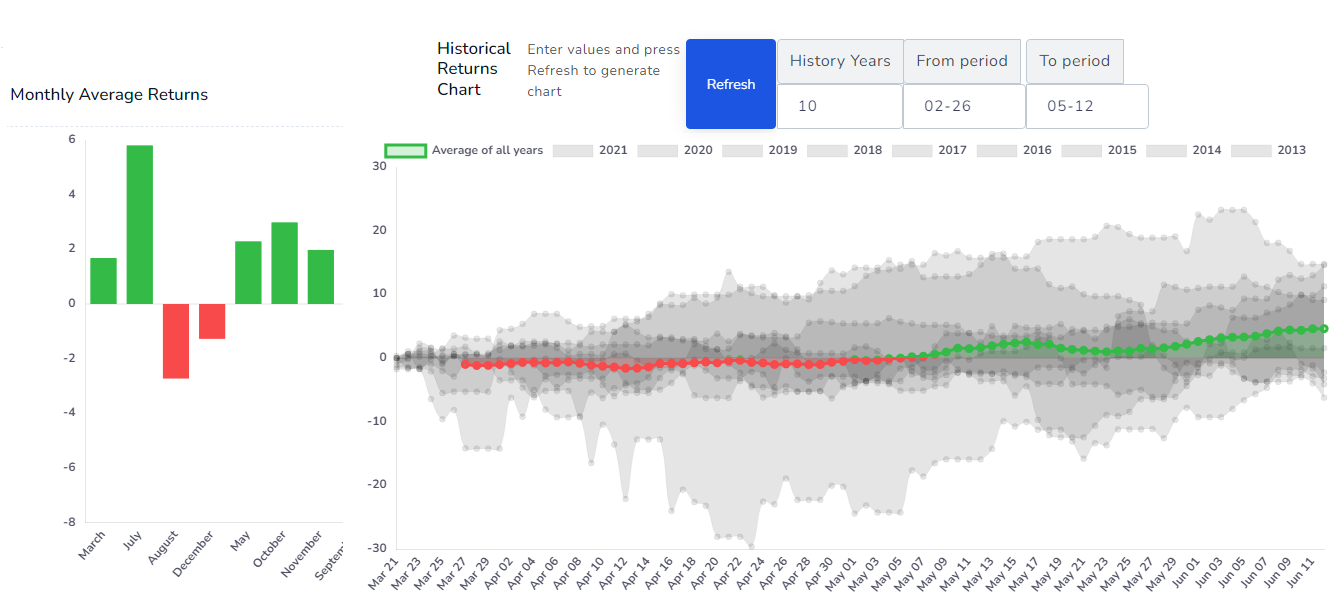
Seasonality Screener, Heatmaps & Sector Rotation: New Tools for Seasonal Trading
Find stocks with the strongest seasonal patterns using the new Seasonality Screener. Scan thousands of symbols, view month-by-month heatmaps, compare your trades against seasonal trends, and track sector rotation - all from one page.