blog-post-image
By TradesViz On in How-To

New visualizations and examples using grids in TradesViz (AI, pivot + more)

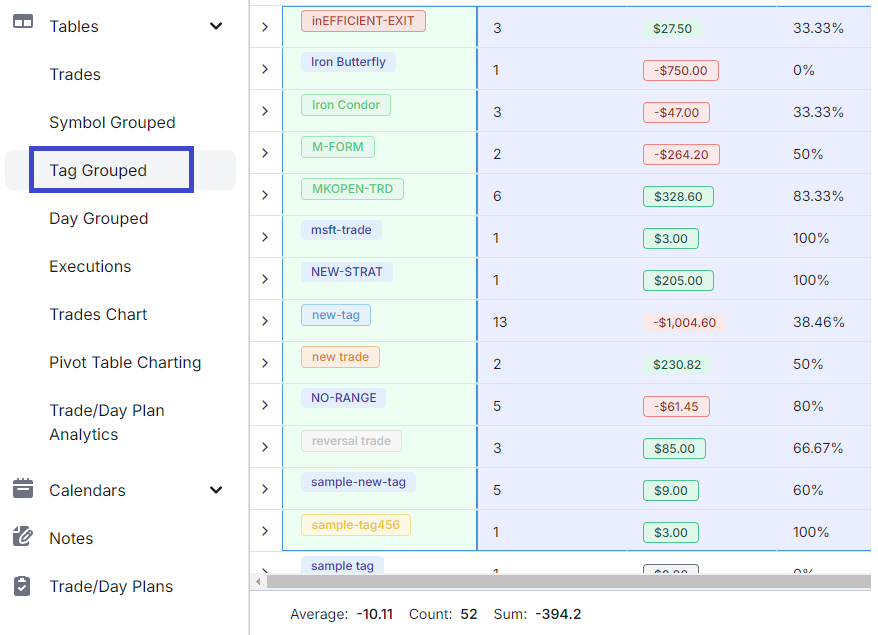
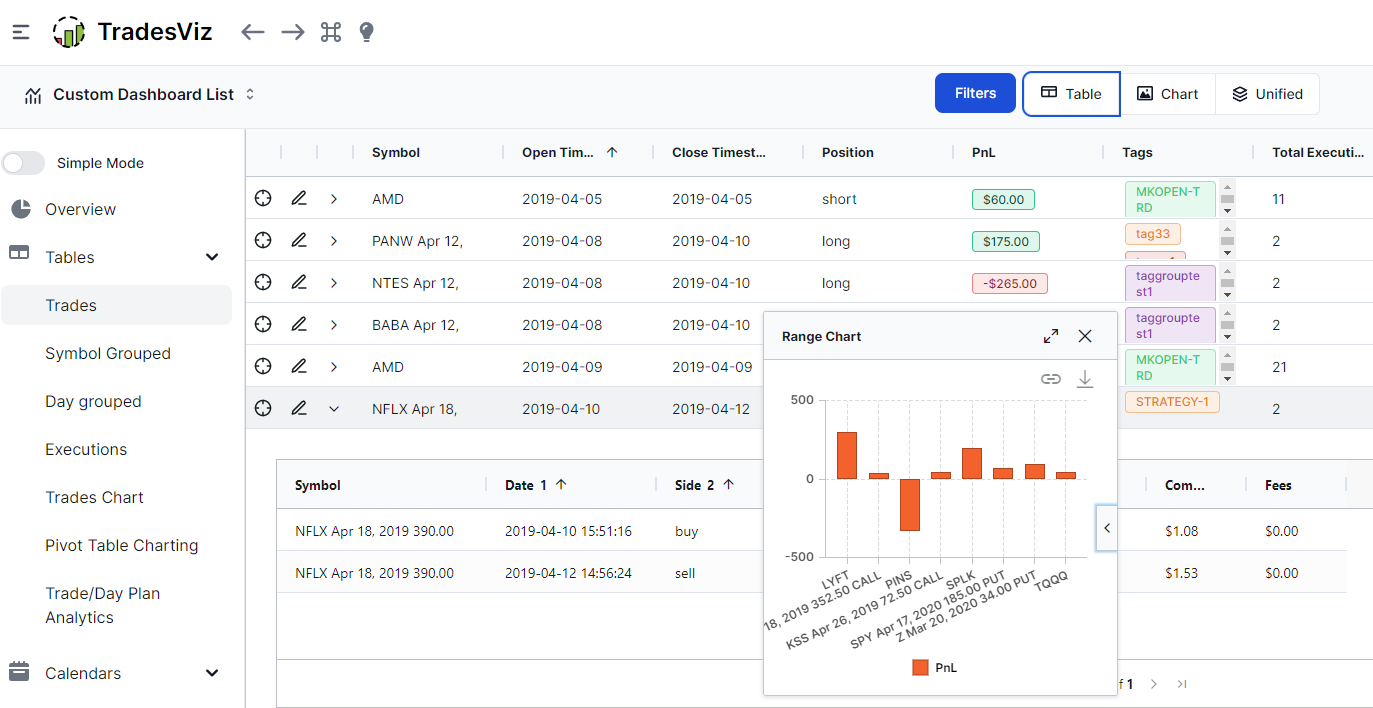
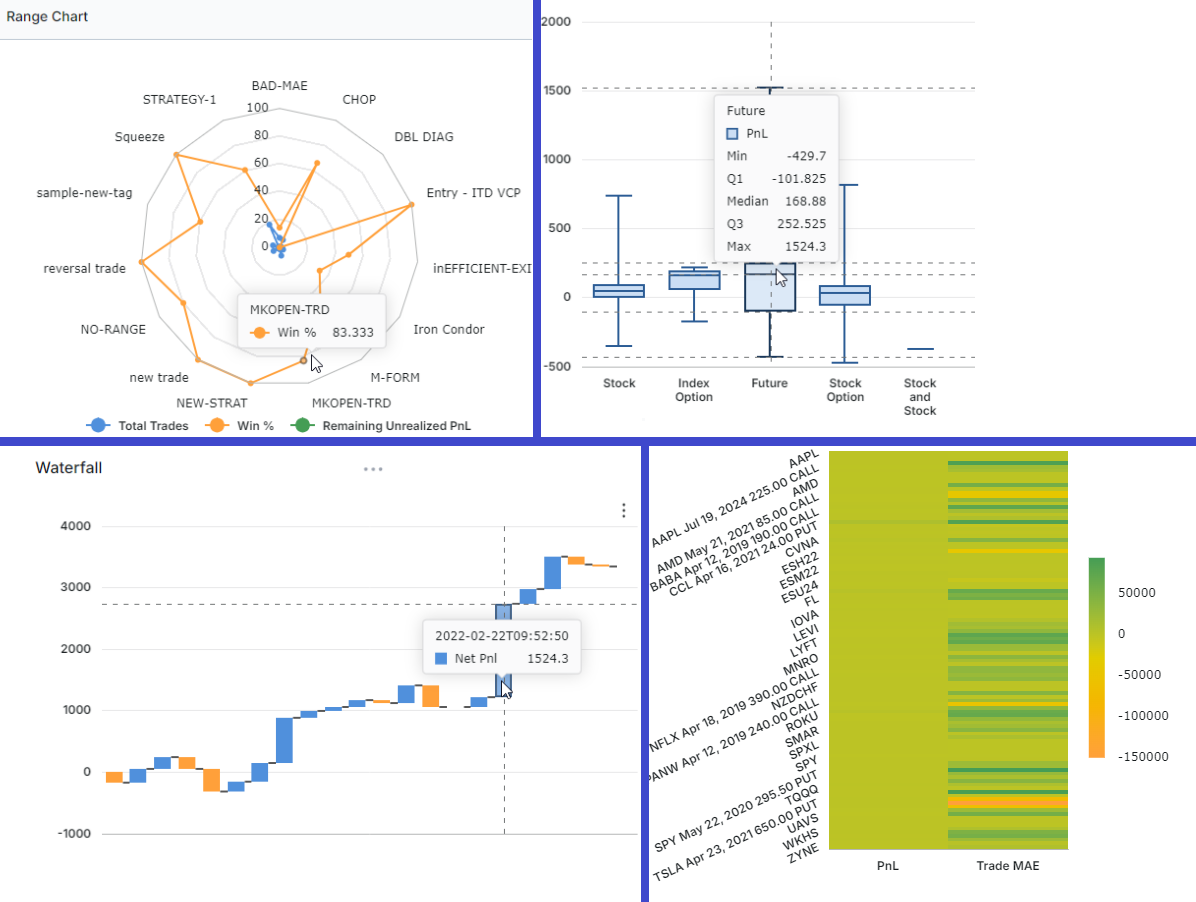
We've had a lot of new types of analysis created from the grids and charts of TradesViz over the years. We just launched an update to the no. of chart types you can make - this greatly improves the utility of pivot grids and the AI widgets! This new list includes box plots, treemaps, waterfall charts, range bars, and more!


blog-post-image
By TradesViz On in Introduction

New tab: Tag grouped table

The 5th main table in TradesViz: Tags table! You can now quickly view summaries based on tags and generate charts/export data and more with the tags table.


blog-post-image
By TradesViz On in Core UI

TradesViz Tables & Grids: Complete guide (Features, Customization and more)

With the introduction of TradesViz v2.0, we have completely changed all the tables of the main dashboard to be based on advanced and flexible grids. Read on to learn more about the new features and just how much better this is compared to any other tabular journaling solutions out there.