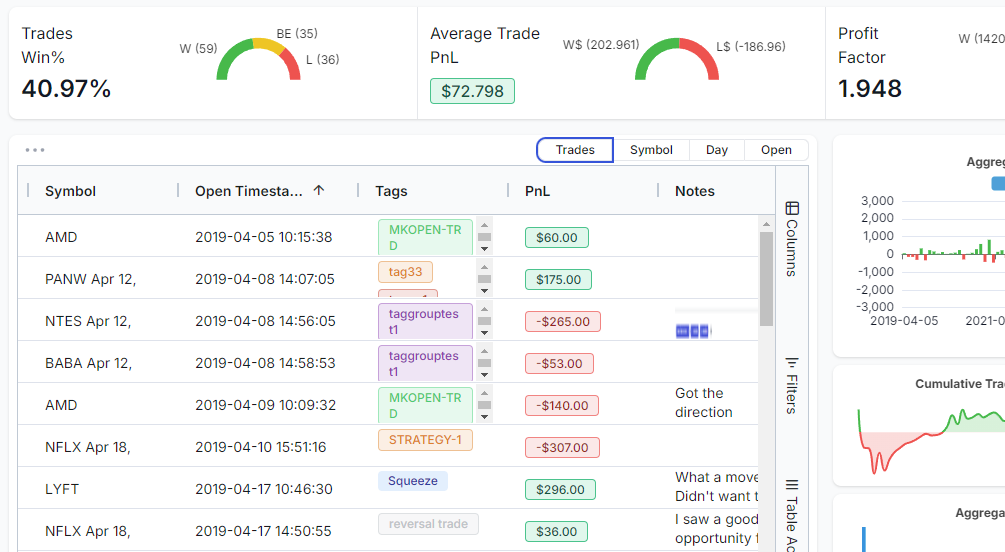
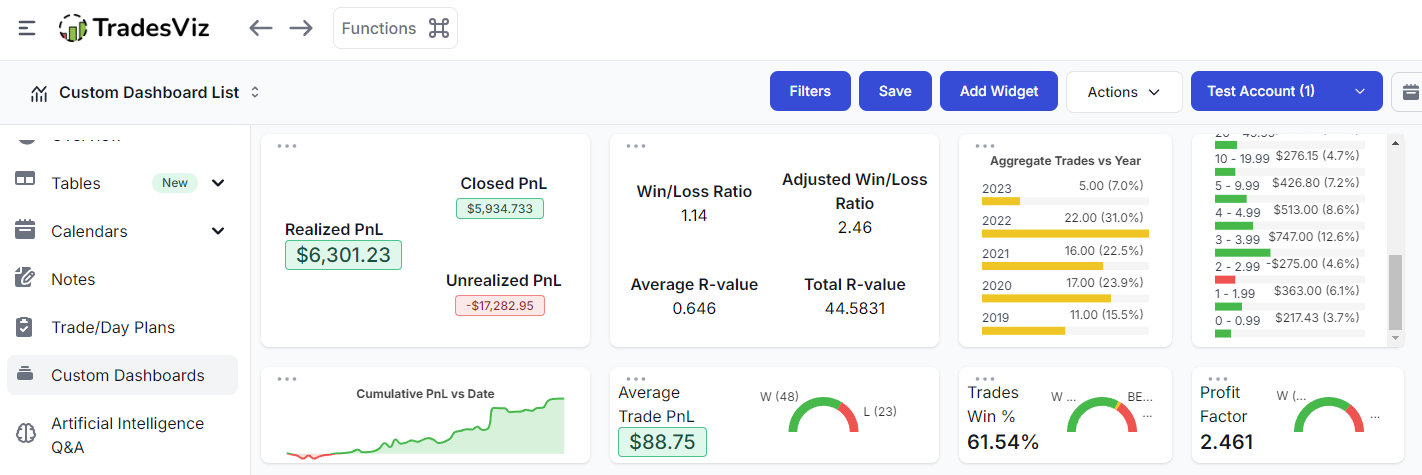
blog-post-image
By TradesViz On in Introduction

Comparing trading account performance: Account statistics in TaradesViz (v2.0 refresh)

The account statistics tab is a way to view and visualize 100+ KPIs across many trading accounts in TradesViz.


blog-post-image
By TradesViz On in How-To

New Ways to Visualize Your Trades: Practical Examples Using Grids in TradesViz Trading Journal (AI, Pivot & More)

We've had a lot of new types of analysis created from the grids and charts of TradesViz over the years. We just launched an update to the no. of chart types you can make - this greatly improves the utility of pivot grids and the AI widgets! This new list includes box plots, treemaps, waterfall charts, range bars, and more!


blog-post-image
By TradesViz On in How-To

All you need to know about automating stop losses and profit targets in TradesViz

The final solution for the manual-input-data problem? Learn all about stop losses, profit targets, the 4 types of targets, and how to automate them and apply them to all your trades at any time in a single click in TradesViz.


blog-post-image
By TradesViz On in General

New Overview Type: All-in-one + New widgets + Multi-table mode

A new overview after a long time! Explore to learn about the design decisions!


blog-post-image
By TradesViz On in Introduction

New custom dashboard widgets: Pie charts, combined statistics and compact charts!

One of the most used features of TradesViz - the 100% custom dashboard gets 10+ new widgets and variants for ALL bar and line charts! With this, you can create compact dashboards that show you exactly the metrics you want visualized the way you want!