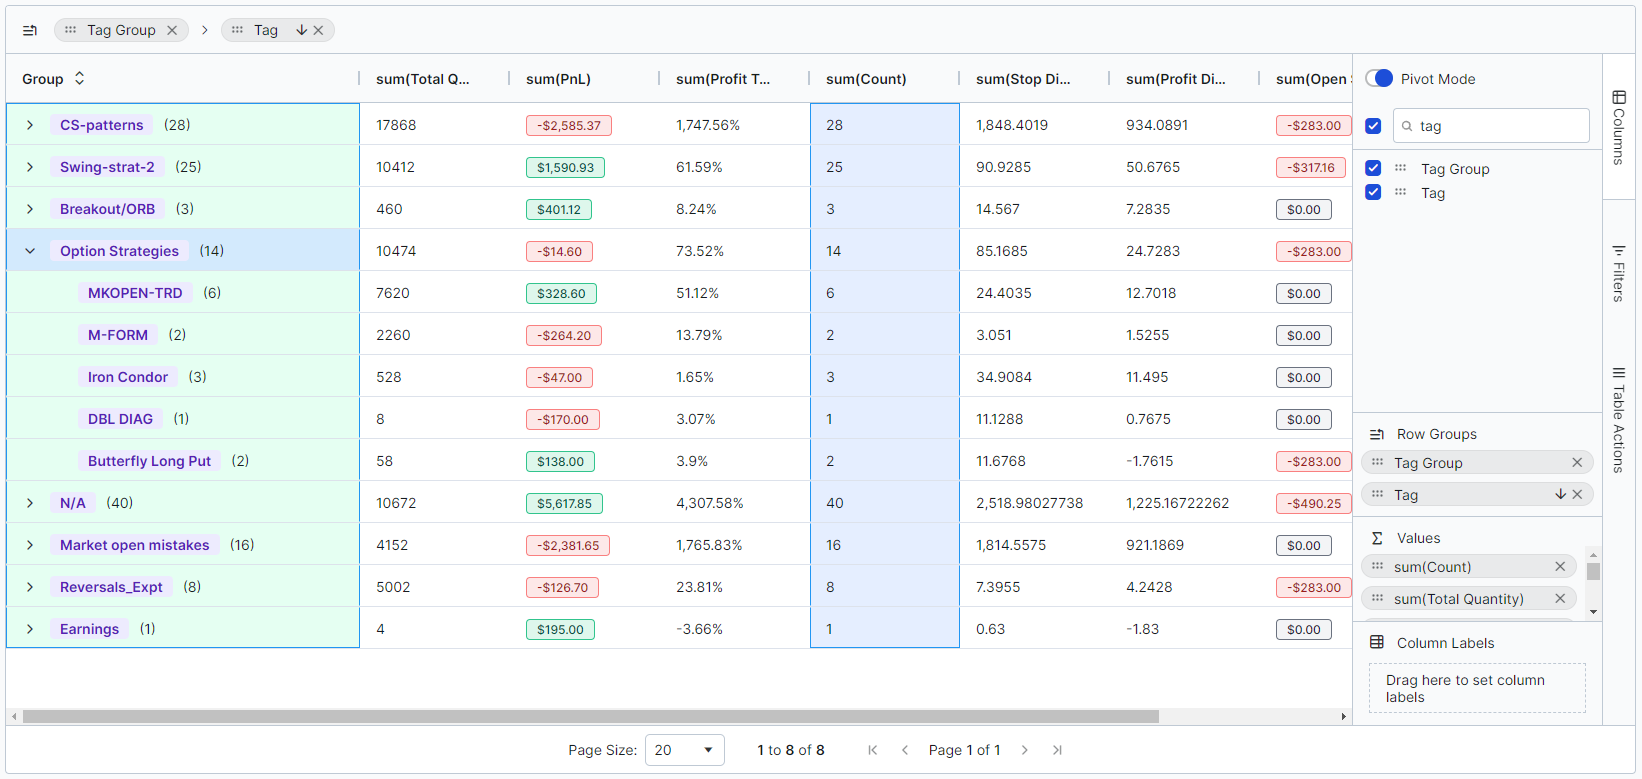
Tags have been interwoven into almost everything in TradesViz and we've always placed a high degree of importance on tags in trading. The reason is, that tags are the only trading attribute that a user can add that can bring qualitative analysis to your trading journal. We will discuss in this blog post how your tags are utilized in TradesViz and how each way of using tags can benefit you as a trader looking for insightful analysis.
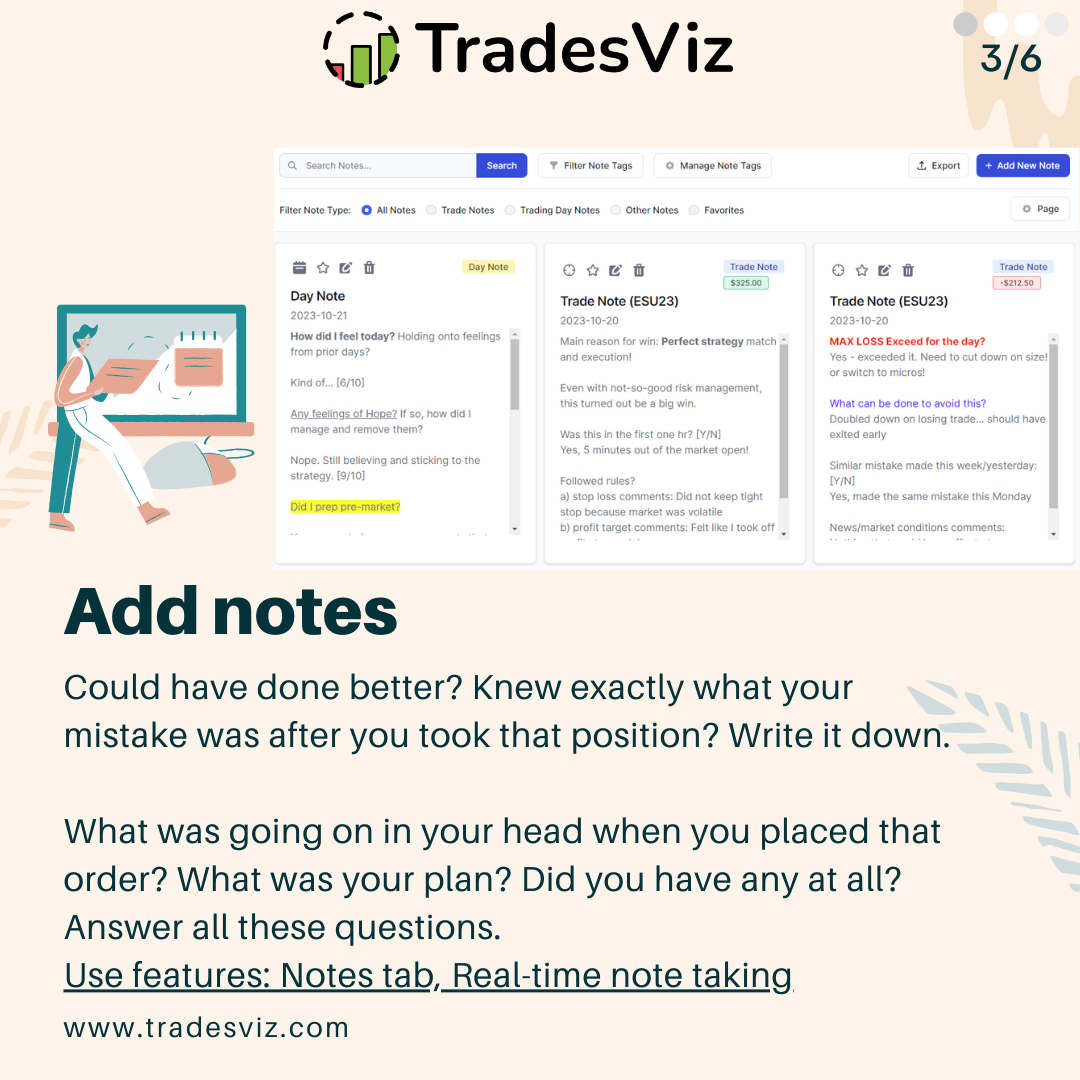
TradesViz is the only trading journal to have tags that can be attached to both your trades and your trading days.
There are many features of tags and many ways to interact with them on TradesViz. We will list them all in this blog post as a comprehensive guide.
This blog was originally posted on July 2023 and we've updated it on July 2024 with updated content that is relevant to much improved TradesViz v2.0's UI.
Some ideas on what to use as tags
TradesViz has 100s of technical charts that use the stats derived from your trades. From price ranges, best exit PnLs, MFE/MAE, R-value, etc., there are stats that would help every type of trader. However, there are some cases where what a trader needs is more than just technical statistical/numerically derived values. This is where tags come in.
The concept of tags allows you to define your own label and add it to a trade/trading day. This in turn can be used to create charts/metrics that were previously not available and ones that are very specific to the trader in question.
Due to this reason, we have thought about some general guidelines that one may keep in mind when designing tags. These may not apply to everyone and of course, there are no restrictions on what you can enter - but, there are just generalized ideas that may help you when creating a lot of tags.
- Check if the stat/tag's meaning is already converted through another stat. You can use the search box at the top of your dashboard (click on the pie icon to switch to charts-based search) to search for all the stats/charts in TradesViz. For example, it's not really worth your time to label the trades based on price range or time of day/day of the week, etc., because all of these can be found in pivot grids, and in pnl analytics charts in TradesViz.
- Focus on brevity. A tag that relates to a MACD strategy can be named `S_MACD` instead of `MACD_Strategy` - i.e., keep it short and simple.
- Tags should be atomic. Meaning, a single tag should convey/contain 1 piece of information. For example, don't use BacktestingStrategy1MACD, or BacktestingStrategy2MACD - you are repeating information and making it harder to search and analyze your tags here. Instead, use S_MACD_1, S_MACD_2 and group these 2 under "Backtesting" tag group.
- Don't use special characters like *, %, $, etc., this makes it harder to search for tags. Try to keep your tags alphanumeric with hyphens (-) and underscores (_) if necessary.
- If your tags have multiple parts in the name, make sure to order them. For example, S_MACD_2 and MACD_S_1 may convey the same information to you, but when you want to search for, say, just strategies, you can't do so here. Whereas, if the tags are named S_MACD_1 and S_MACD_2, then you can easily search using `S_%` which is short form for "find all the tags that start with S_ and ends with anything". Wild-card-based searching is only possible on TradesViz and if you name your tags keeping these simple rules in mind, you can make your trading journal work for you efficiently!
Different ways to add/delete/modify tags
As with most features on TradesViz, there are multiple ways to achieve the same goal/functionality. Before jumping into the different ways to add/modify tags, you need to understand how tags are processed and stored in TradesViz.
- There is no need to add tags to a central area or to your account before you can use them in the trades. When you add a new tag that you have not used before, TradesViz automatically creates entries for that tag.
- Once you have a tag attached to at least one trade in your account, it will automatically appear as a suggestion whenever you start typing in any of the tags' input areas.
- There is no need to manage tags separately - everything is taken care of automatically.
- A tag will exist in your account as long as it is attached to at least one trade.
- If a tag no longer shows up in the auto-suggestion drop-down, it means it is not linked to any trade - i.e. essentially the tag does not exist in your account.
Here are the different ways you can add tag(s) to trades:
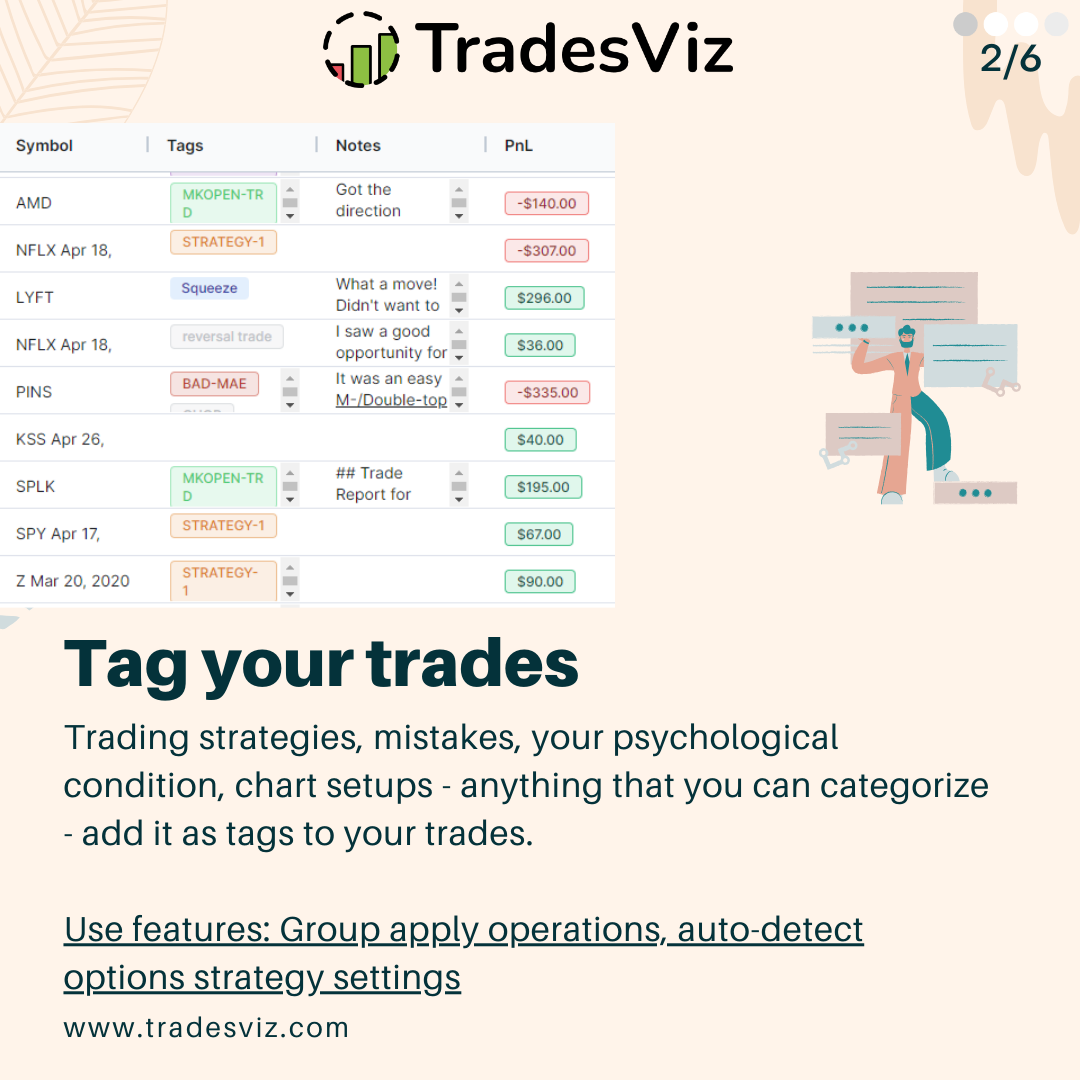
- Adding each tag manually by clicking on the pencil icon in the trades table
- Exploring a trade and clicking on the edit trade button or the 3 dots icon on the top right corner of the tags section
- Adding a tag to all trades during import by entering tags in the tags area on the import page
- Applying tags in bulk using Group apply function on the trades table.
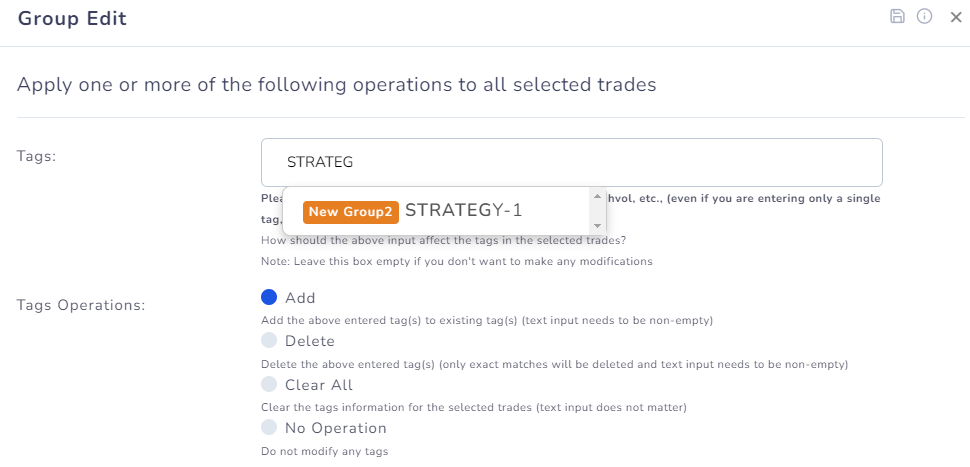
- You can also add tags in bulk to be used later using the bulk add tags feature in your account settings. Learn more here: https://www.tradesviz.com/blog/bulk-add-tags/
Here are the different ways you can modify existing tags:
- You can replace tags in trades using group apply in 2 operations where first you will search for the tag > remove it and then group apply again and apply the new tag.
- You can rename tags using the "Rename tags" function in your account settings

Here are the different ways you can delete existing tags:
- You can clear tags in trades using group apply where it will clear a matching tag
- You can completely delete all instances of a tag by using the "Remove tags" function in your account settings
- Deleting all trades that have a particular tag will also remove the tag from your account
For trading days, you can only add/remove/delete tags via the day explore page.
How to search for trades with tags
One of the reasons to tag your tags is to find trades easily. Of course, you can filter by price, date, name, etc., but tags can represent a group of numeric indicators and more that cannot be inferred by the system.
Here are the multiple ways to search for trades with tags:
- Using normal trades table search. We have an in-depth guide written about this here: https://www.tradesviz.com/blog/efficiently-filter-trades/. At the bottom of every column in the trades table, you will see an input box. You can type in your tag name there and get results immediately. Interesting features include: AND/OR searching (tag1/tag2 for OR and tag1,tag2 for AND), exclusion search (!tag), and wildcard search (ta%).
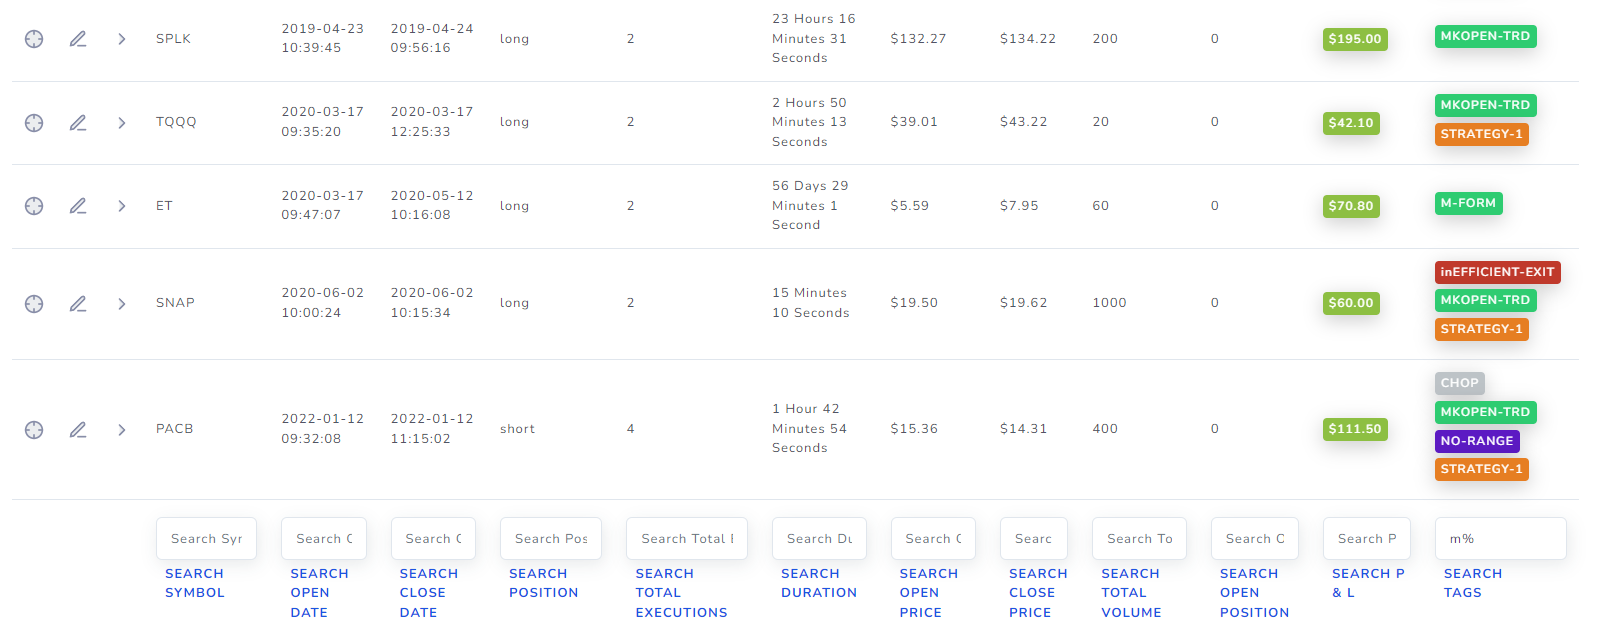
In the example above, we are searching for tags that contain the word "strategy" or ('/' slash character) "mae". "strategy%" means "search for any tag that starts with strategy". You can also simply use the normal AND/OR operators to do this as shown below:

If you wish to learn more about the new grid's features, please check out the v2.0 grid guides here.
- Use the filter button at the top right corner. All the rules mentioned above and in the efficient filtering guide apply here. The difference between the table-based search and filter-based search is that any change in filters applies to the entire dashboard whereas the text search in tables applies only to the current table you are working on.
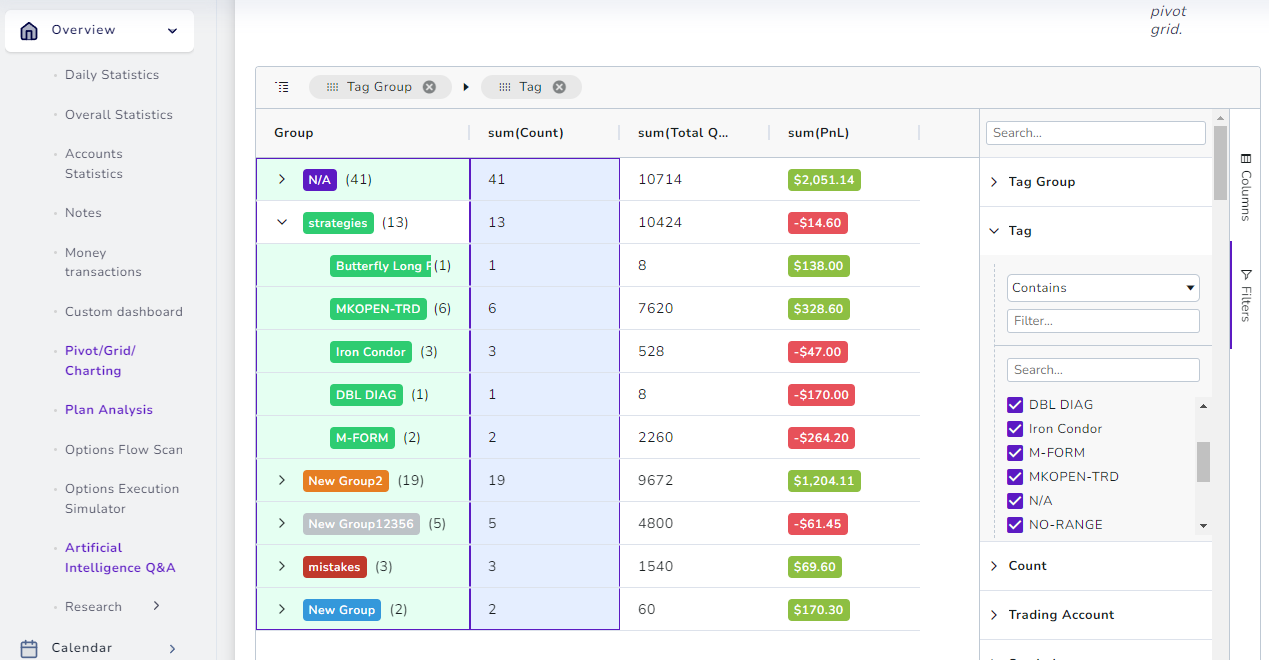
- Finally, the pivot grid provides a lot of very easy ways to search and analyze tags. You will be able to both search for and select tags as categories once in pivot mode.
How to organize tags
Organizing of tags can be split into 2 sections: properly naming tags and properly grouping them. We have explored ideas for naming at the beginning of this blog post. We have explored tag groups and how to use them effectively in another dedicated blog post: https://www.tradesviz.com/blog/tags-grouping-analysis/
How to analyze using tags
All of your efforts in tagging your trades are so that you can achieve 3 things:
- Easy visual identification of trades
- Easy filtering
- Qualitative analytics
We have explored the first two in this post as these are very objective topics. Analysis, however, is a very subjective topic where each trader's way of analyzing would differ.
We have seen plenty of online journaling solutions where there are very limited tagging features and because of that, we've seen users putting off trading as a difficult task. With TradesViz, this is not the case. You are looking at the most versatile journaling platform in the world that has processed hundreds of thousands of tags inputted by traders.
With all the features we have explained above, tagging your trades - even if there are 100s, takes mere minutes to do.
Once you tag them, you can get analytics from these features:
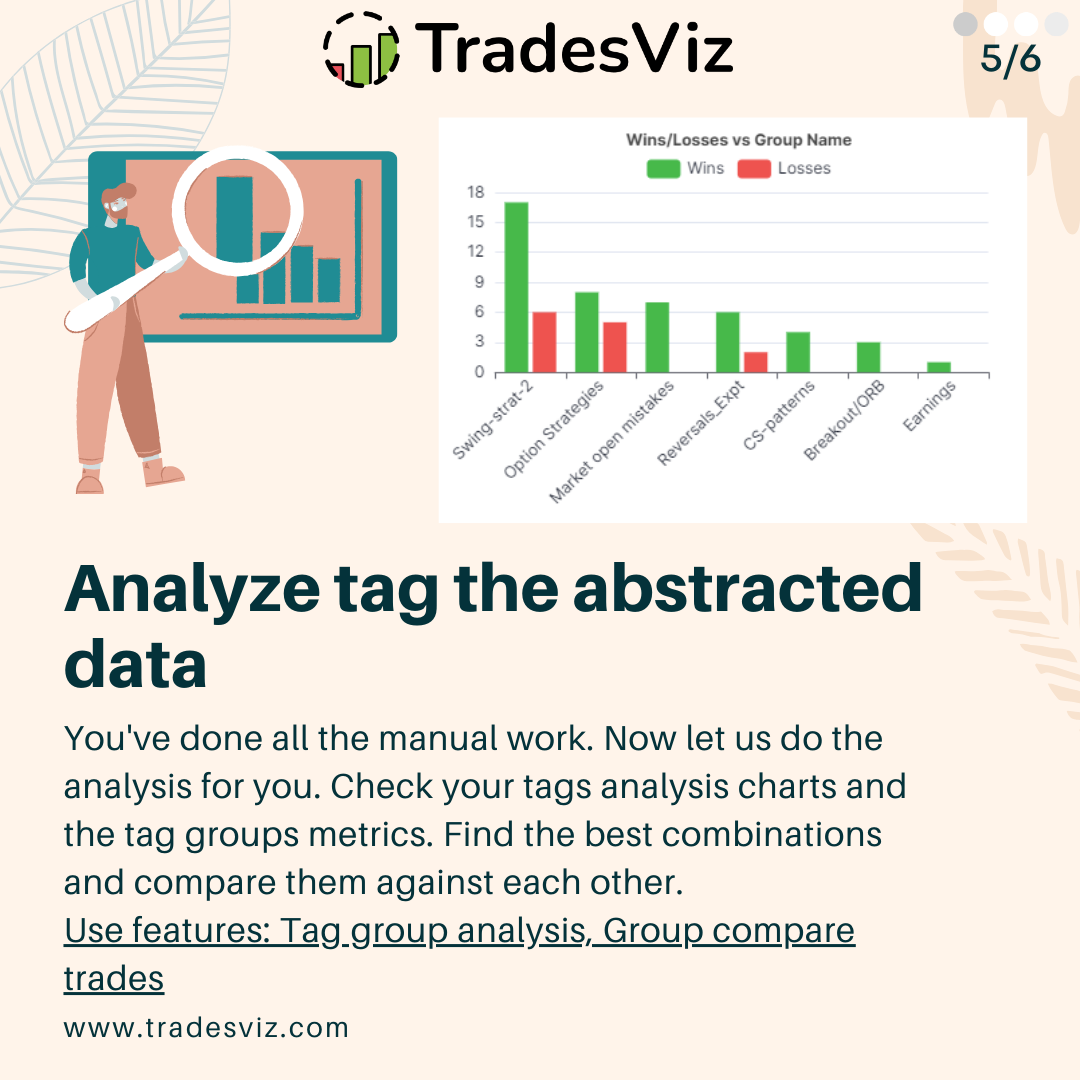
Trading performance analysis > Tags charts
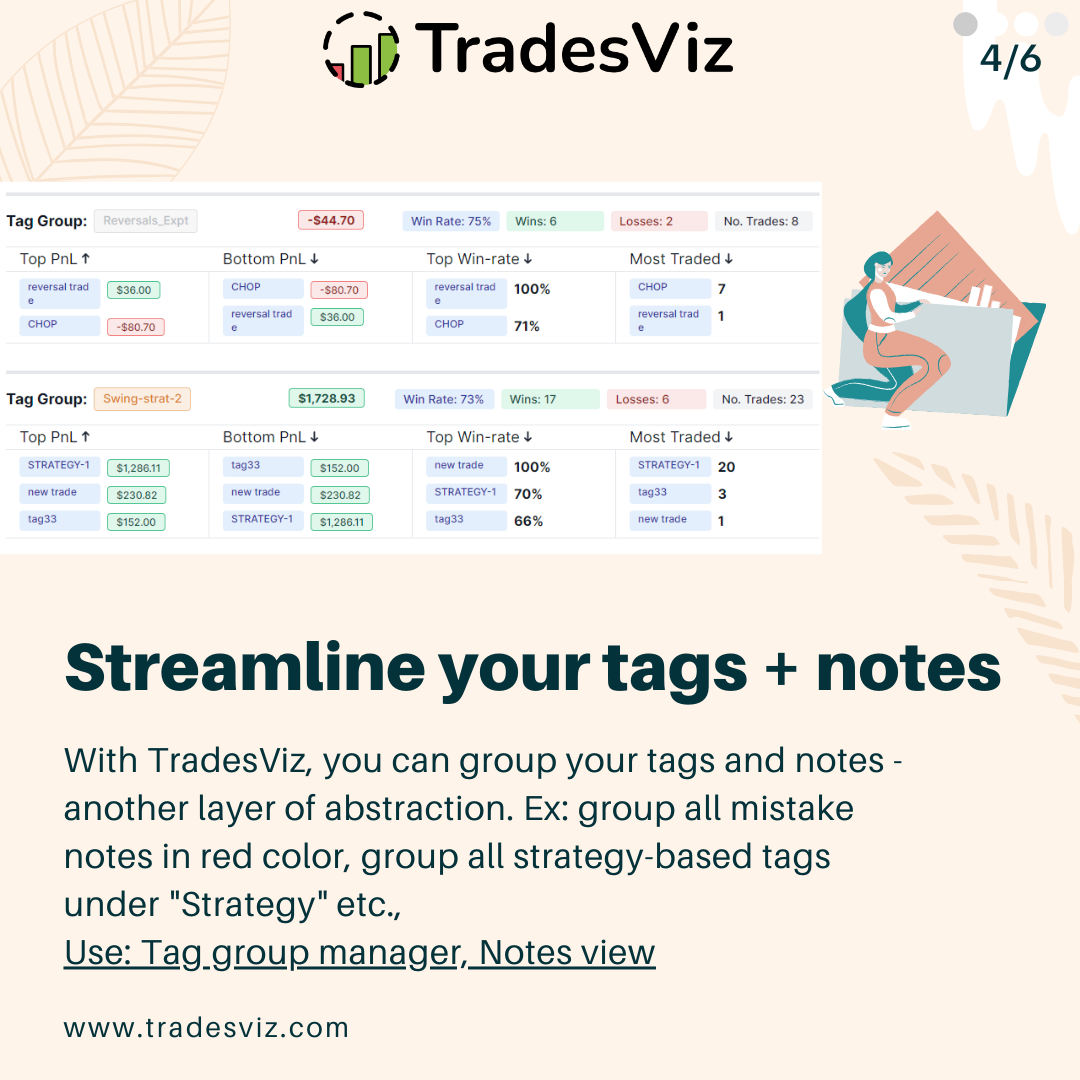
Trading performance analysis > Tag group charts (More info on tag group analysis)
Trading performance analysis > Tag group summary (More info on tag group analysis)
Pivot grid > Unlimited grouping/pivoting analysis (More info on pivot grid / More info on advanced analysis on pivot grid)
Artificial Intelligence analytics > Limitless potential in getting previously unobtainable insights that are derived from multiple data sources (More info on advanced AI query)
Without using tags, you are limiting yourself and the full potential of these features to help you find better insights.
 |
 |
 |
 |
 |
 |
Where are tags used?
Ok, now you've entered all your tag data. Where do analyze it? or where can you see the stats? Here's the list:
Pivot/Normal Grids
These elements (tables) already show you the tags and it's possible to chart your tags vs ANY numeric data. Refer to our pivot grid guide and the normal grid guide to learn how to utilize these powerful features.
Charts
There are 20+ charts related to tags and tag groups. These are under the Trades anlaysis section of your dashboard. Click on any image below (or anywhere in any of our blog posts to zoom in and see the full page).
 |
 |
On top of this, it's possible to create limitless charts using AI queries. We will not go in-depth into AI query construction as there are very detailed blog posts here, here, and here. Here's an advanced example:

In this example, we are seeing the cumulative pnl of trades for 2 tags overlayed in the same chart.
Tag groups statistics
We've already explained a lot about how to use tag groups in this blog post and also in dedicated blog posts here and here. Under your summaries section, tag group statistics tab can show you, on a single page, what your most optimal tag group combinations are.
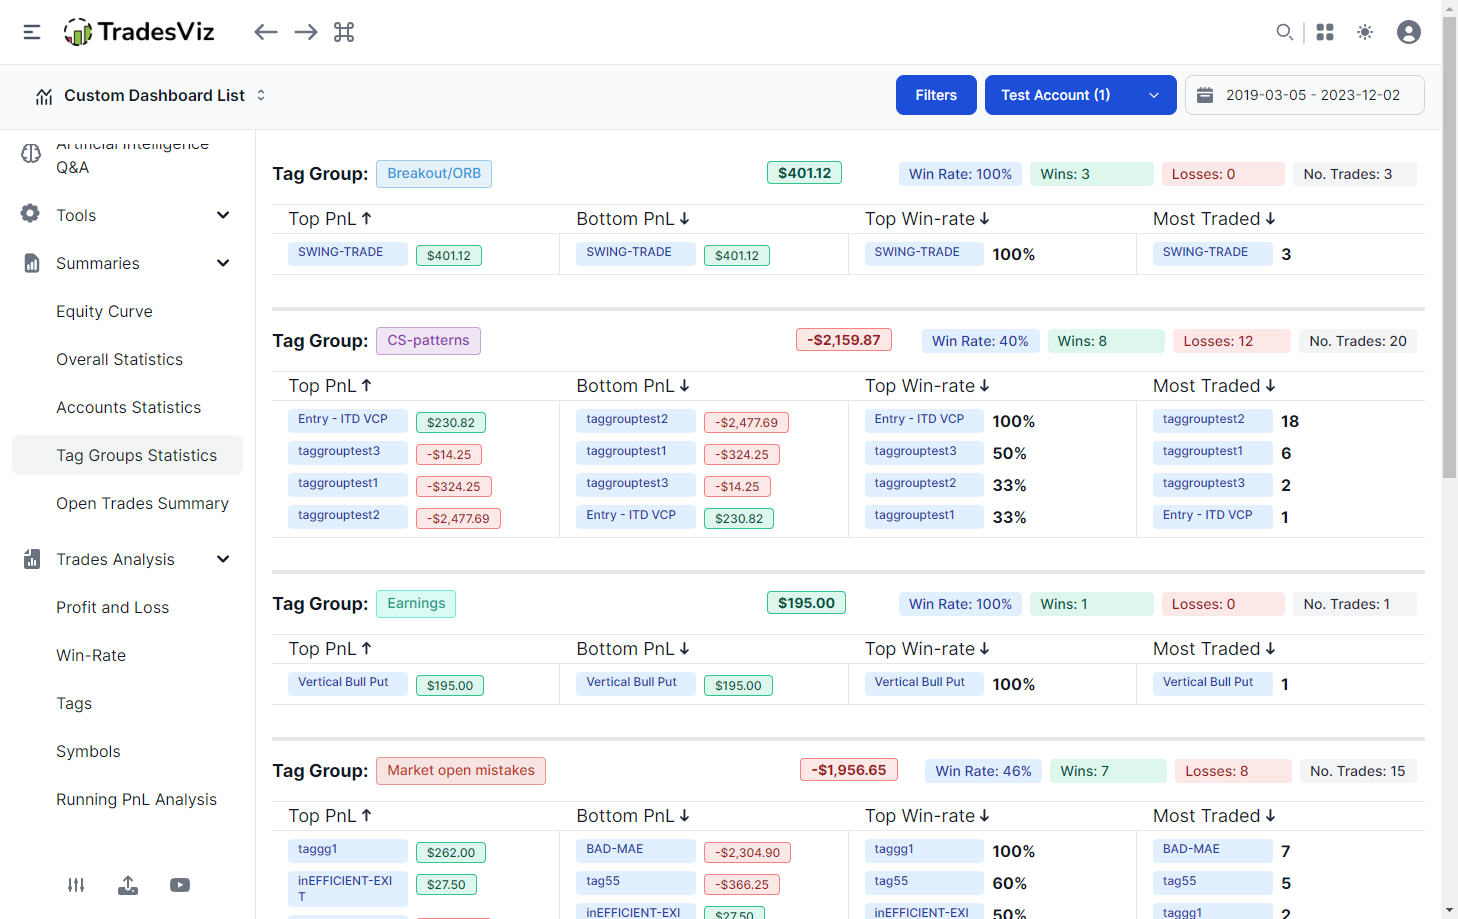
If you are looking for the simplest, but the most useful summary without any charts or complexity, this is it - Provided, you filled in your trades with tags :)
AI Daily Summary
Yet another dedicated AI feature that makes use of your tags. Here it's all automated. The gist is that this feature uses all your trade data (qualitative (tags) + quantitative (pnl, time, quantity, etc.,) to get a summary of the top 5 or 10 actionable insights every single day. For more info on how this feature works, please check our dedicated blog post.

We hope this blog post has shown you all the features you can do with tags on TradesViz and more importantly, how much valuable they are as a data source for analytics. Each feature's efficacy and value are augmented with tags. Pivot and grid tables alone can potentially show you 100s of charts with just trade tags and tag groups.
There is no other platform with this level of flexibility and ease of use of tags - MUST use feature/attribute if you trade a lot. Do you have any questions?
We highly suggest taking a look at our recent advanced AI query guide and pivot analytics guide if you want to learn more about this.
Feedback or feature requests? Please drop us an email at [email protected]
