The TradesViz's pivot grid has been one of the biggest updates we have done so far this year. Since the launch, we have added multiple features that take advanced of the grid like trading plans anlaysis.
In this blog, we will use the main trades table pivot grid and explore various examples using the features of the grid to create charts that are not possible to visualize using the traditional anlaysis sections of TradesViz - in fact, these types of analysis are not possible to do on any platform other than TradesViz at the moment making every other journal old and outdated.
1. Tag/Tag groups vs Categorical values analysis: Trends over changes in trading attributes
You may have many tags or tag groups and would have seen PnL charts for it. However, have you noticed changes in performance within any given tag? or a tag group?
Say, you have a tag named strategy1, how well do you know your strategy's performance with respect to seasonality? does your strategy perform similarly throughout the year? across various asset types? across different days or times of days?
This type of anlaysis requires a 3rd dimension - that's why we turn to the pivot feature of the grid:
Visit the pivot/charting tab
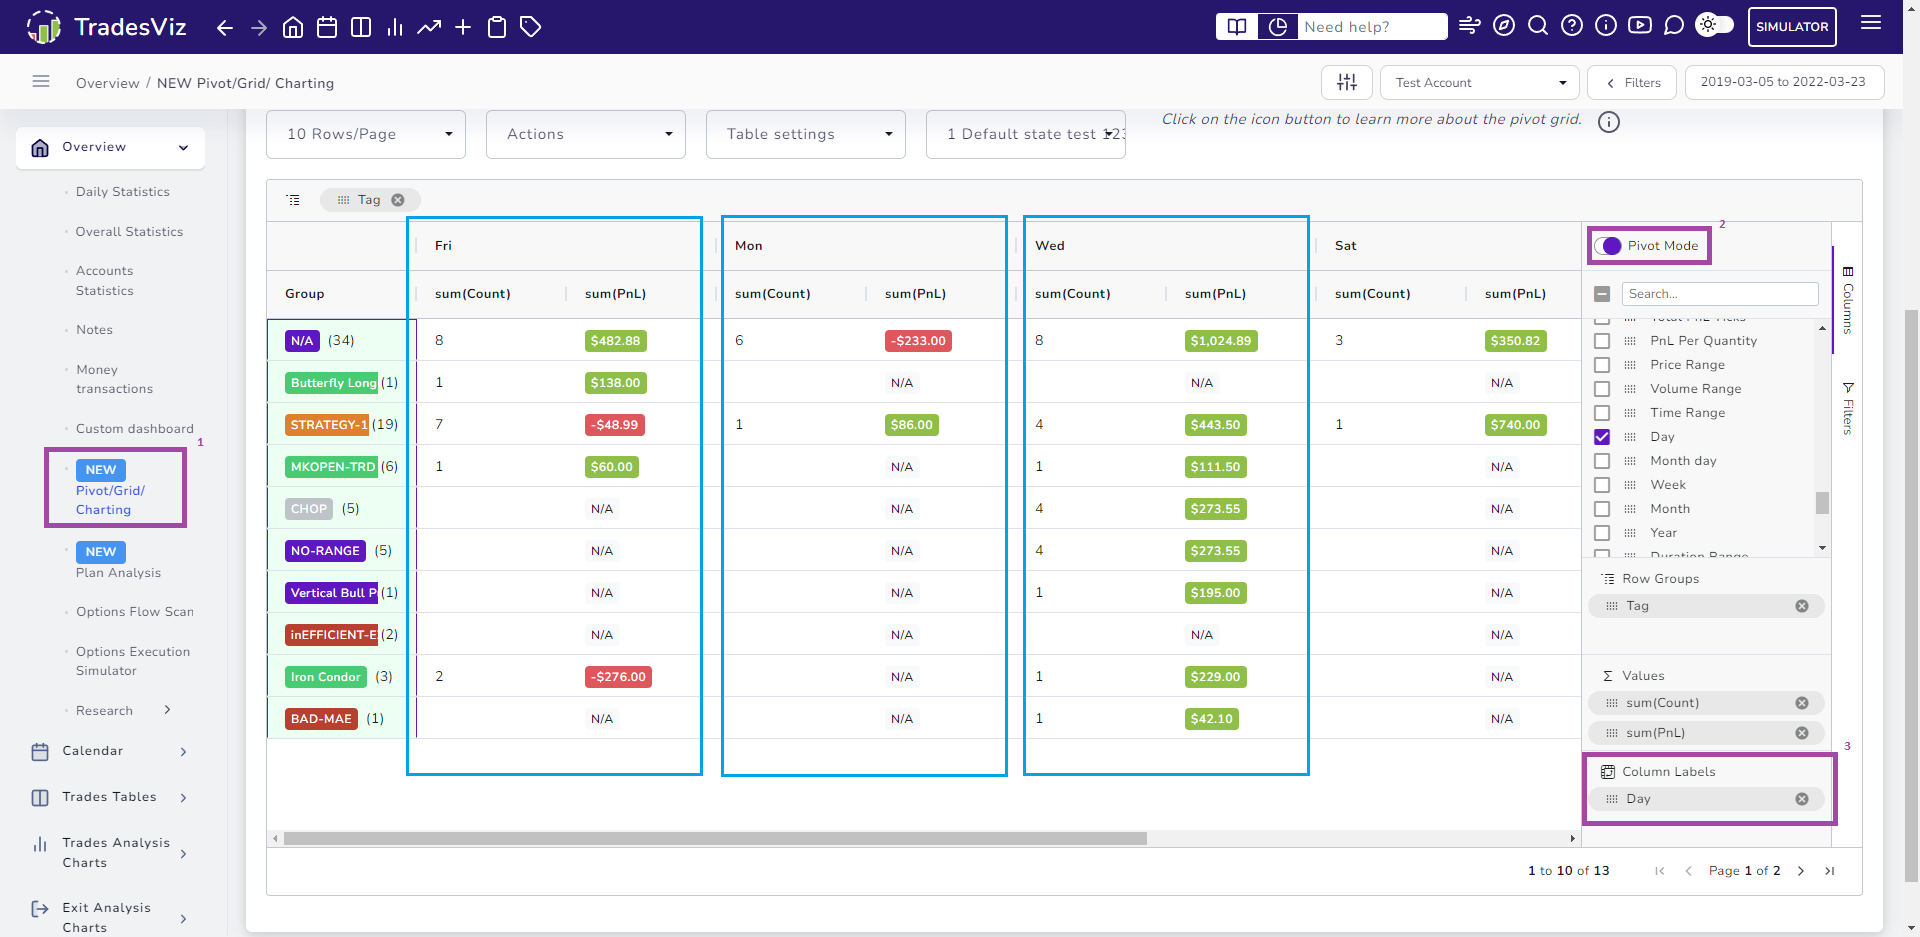
- Turn on the pivot mode by clicking on the Pivot mode toggle
- Select the columns you want to see as a summary: pnl, volume, total trades, etc., and add them to the values section on the right side section of the grid by dragging the column. In this example, we have used PnL and total trade count.
- Select the tag or tag group column as the row group (our first compare dimension)
- Finally, add the third dimension as the column label. Ins this example, we want to compare the performance of our tags across days of the week and learn how the tag's performance varies throughout the week.
Once you have added the pivot, you will see the Extra header appear on top of the table.
As we can see in the table example above, we see a clear outlier on Wednesday compared to the other days. This means we need to check the trades made on Wednesday and see if there is anything we can do to replicate it on other days or at least learn the reason why the performance difference has occurred.
Here's a video of the entire process:
Like this, you can try the following changes:
- Use month as pivot
- Use R-value as the summary
- Use Symbol as row group
There are limitless no. of combinations you can use to visualize data and create extremely insightful analytics that can help you trade better.
2. Being able to quickly see total PnL other metrics via the integrated charts - Simulating "what-if" scenarios
In both the grid and pivot, there are 2 types of charts - one is a "cross" chart and the other is a normal grid chart. Cross charts have the "cross chart" option checked in the chart box. More info is available in the main blog post explaining the pivot grid. The important difference we are exploring here is the ability to click on a data point in the cross chart and have the other charts/table reflect accordingly.
Think of this as a very fast and efficient trade explore (chart data > click > explore trades). Here's an example of how the chart selection feature works in the pivot chart dashboard:
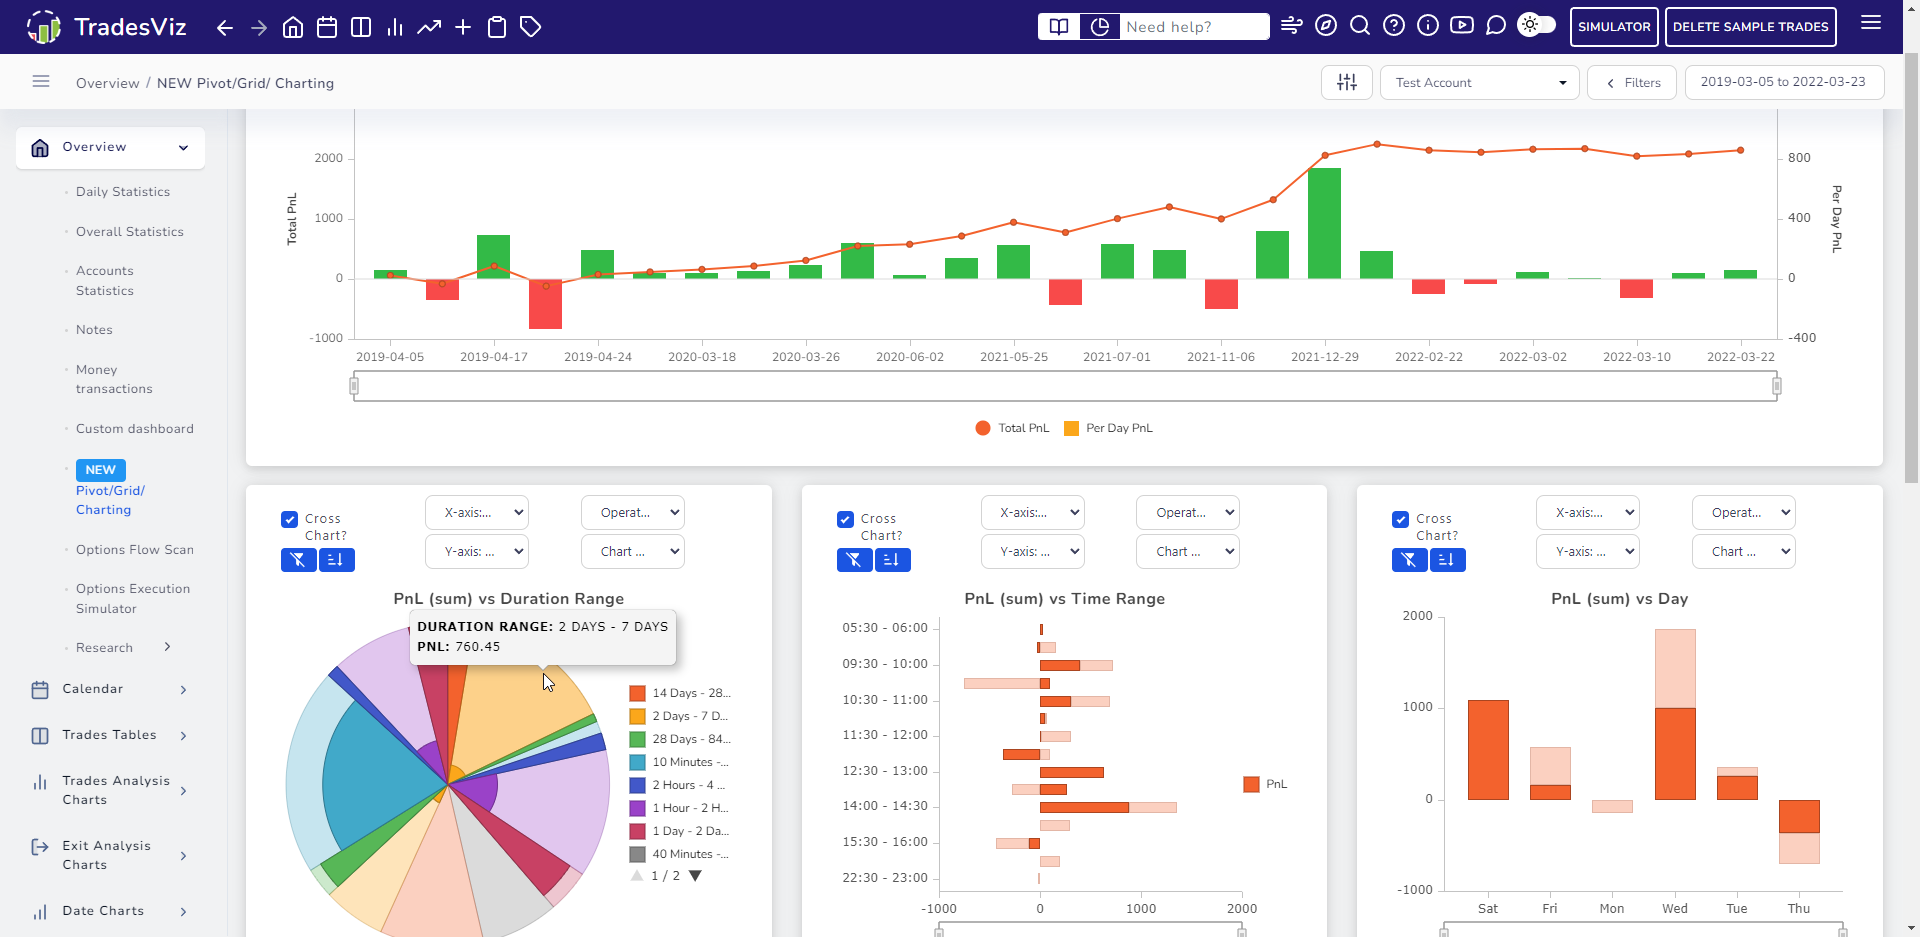
In this video initially, we use the pie chart to select only specific asset types and quickly view the trades in the trades table below. Note that this also updates the charts by making only the data where the filtered trades exist as highlighted areas. This filter-on-click feature is only available on cross charts (note the checkbox at the top left corner of each chart).
At the end of the video, we also convert the middle chart (initially a non-cross chart) to a cross chart and also try doing multiple selections on other charts where we can hold the control key and click to select multiple data points.
Finally, the main crux of this feature, or rather, one small application (in our opinion) is how the main pnl chart at the top also changes accordingly.
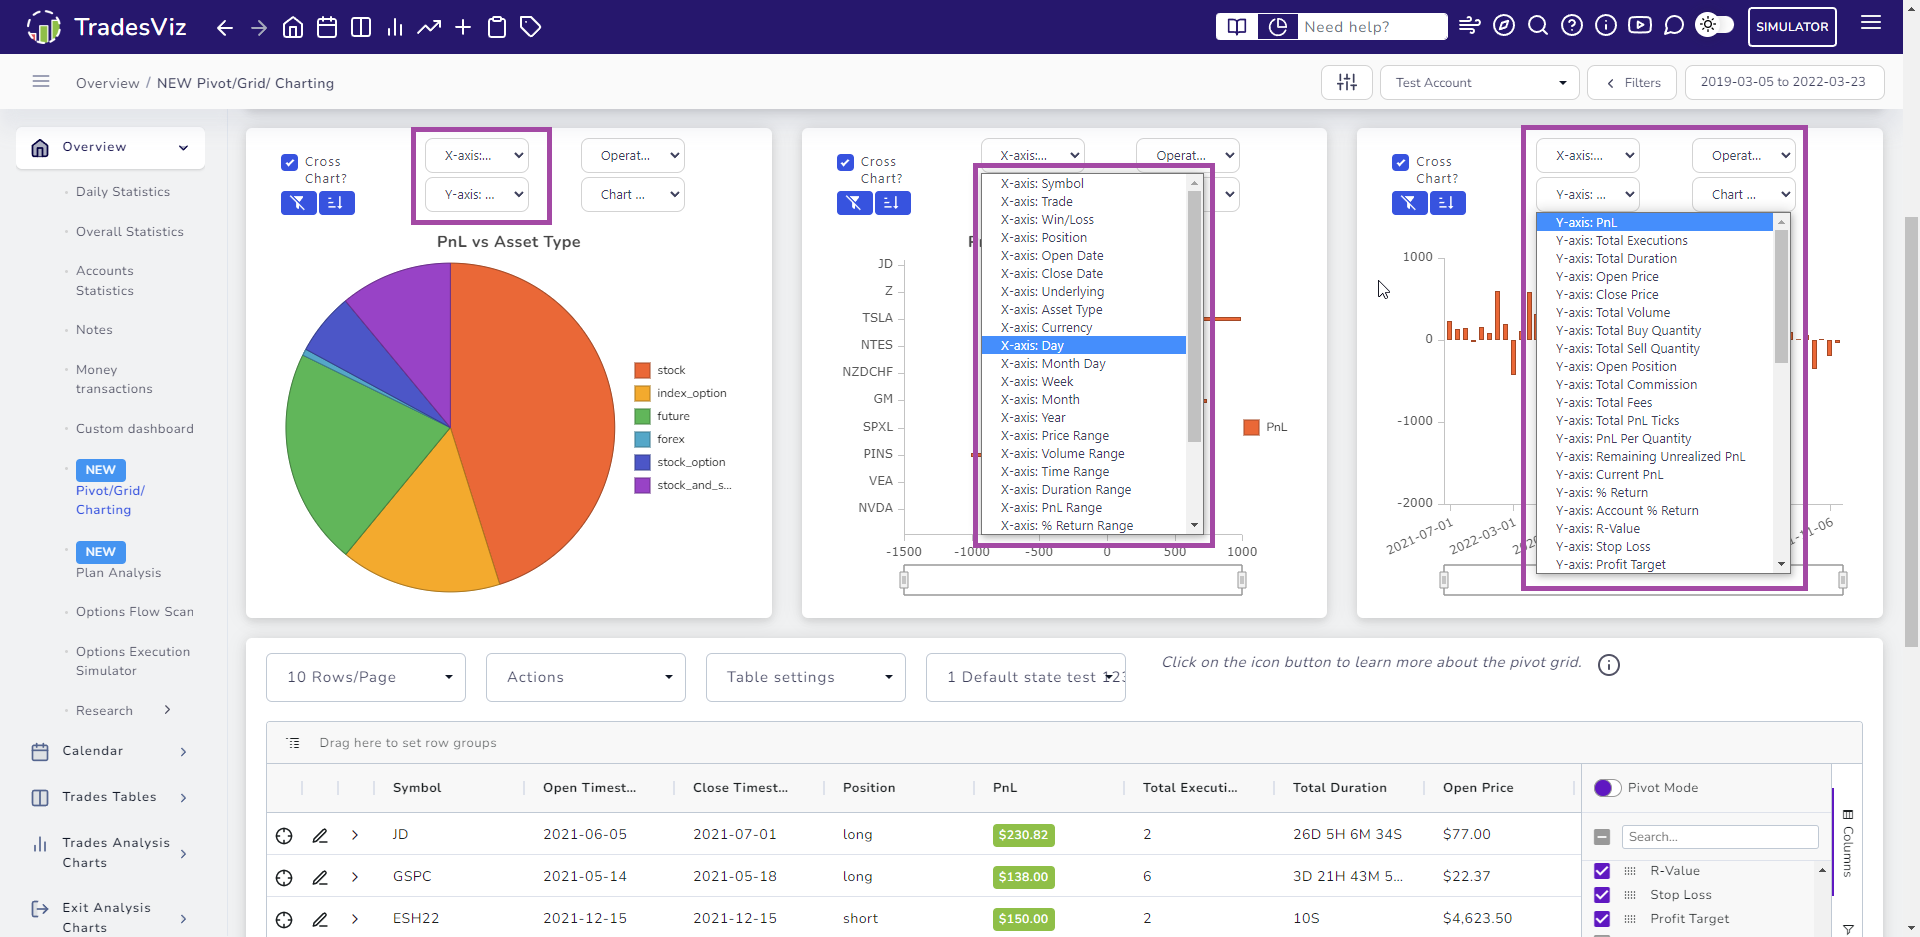
Using the combination of the features explained so far, you can easily ask yourself questions like the following and visualize the result:
- What if you traded future only on Fridays?
- Click on future in the Symbol pie chart and Friday in any cross chart where the X-axis contains days of week
- What if you traded stocks in the price range of $50-100 and held them for more than a few days?
- Click on stocks in the pie chart and 50-100 range in any cross chart where the X-axis contains the price range
- What if you only sold options in the first few hrs of the market opening every day?
- Click on options in the pie chart and Ctrl+click on the first few hrs in any cross chart where the X-axis is the time of day
Each of these questions can be answered in mere seconds using the cross charts and the filter-on-click capability.
Remember:
- You can choose: Bar, column, line or pie as the chart type
- Choose from nearly 100 data points for each chart
The possibilities are endless.
If you do not ask questions about your performance and start exploring, you will not improve.
Don't be a passive observer of the pnl curve. Be a curious trader seeing unique insights to find and improve your trading expectancy in any way possible. That's exactly why we built TradesViz to be such a powerful tool for retail traders.
3. Built-in charts exploring multiple levels of data
If you read the original pivot guide, you would know that even the data within the table can be visualized individually in a very customizable way.
This can come in handy in many ways. Here are some examples:
Here, we are visualizing ONLY the top 10 trades by PnL and checking their total duration:
Here are some more you can do: In the chart, you can overlay additional data points to get even more insights, and also:
- Try changing the data visualization types
- Try overlaying different data series via multi-chart type
- Try changing the table's sorting/filter to the chart data dynamically
If you want to say, visualize a small subset of data to understand the data better, there are no better alternatives if you want to truly understand your data in a seamless way.
4. Multi-level grouping using grid table
Finally, you have seen that we have grouped tables like symbol grouped, day group etc., under the Trades table section. This advanced grid takes this to another level.
You can group anything and have as many groups as you want. Here's an example of a step-by-step calendar grouping starting from year -> month -> day -> time.
You can add custom summaries to view ANY stat in a grouped way.
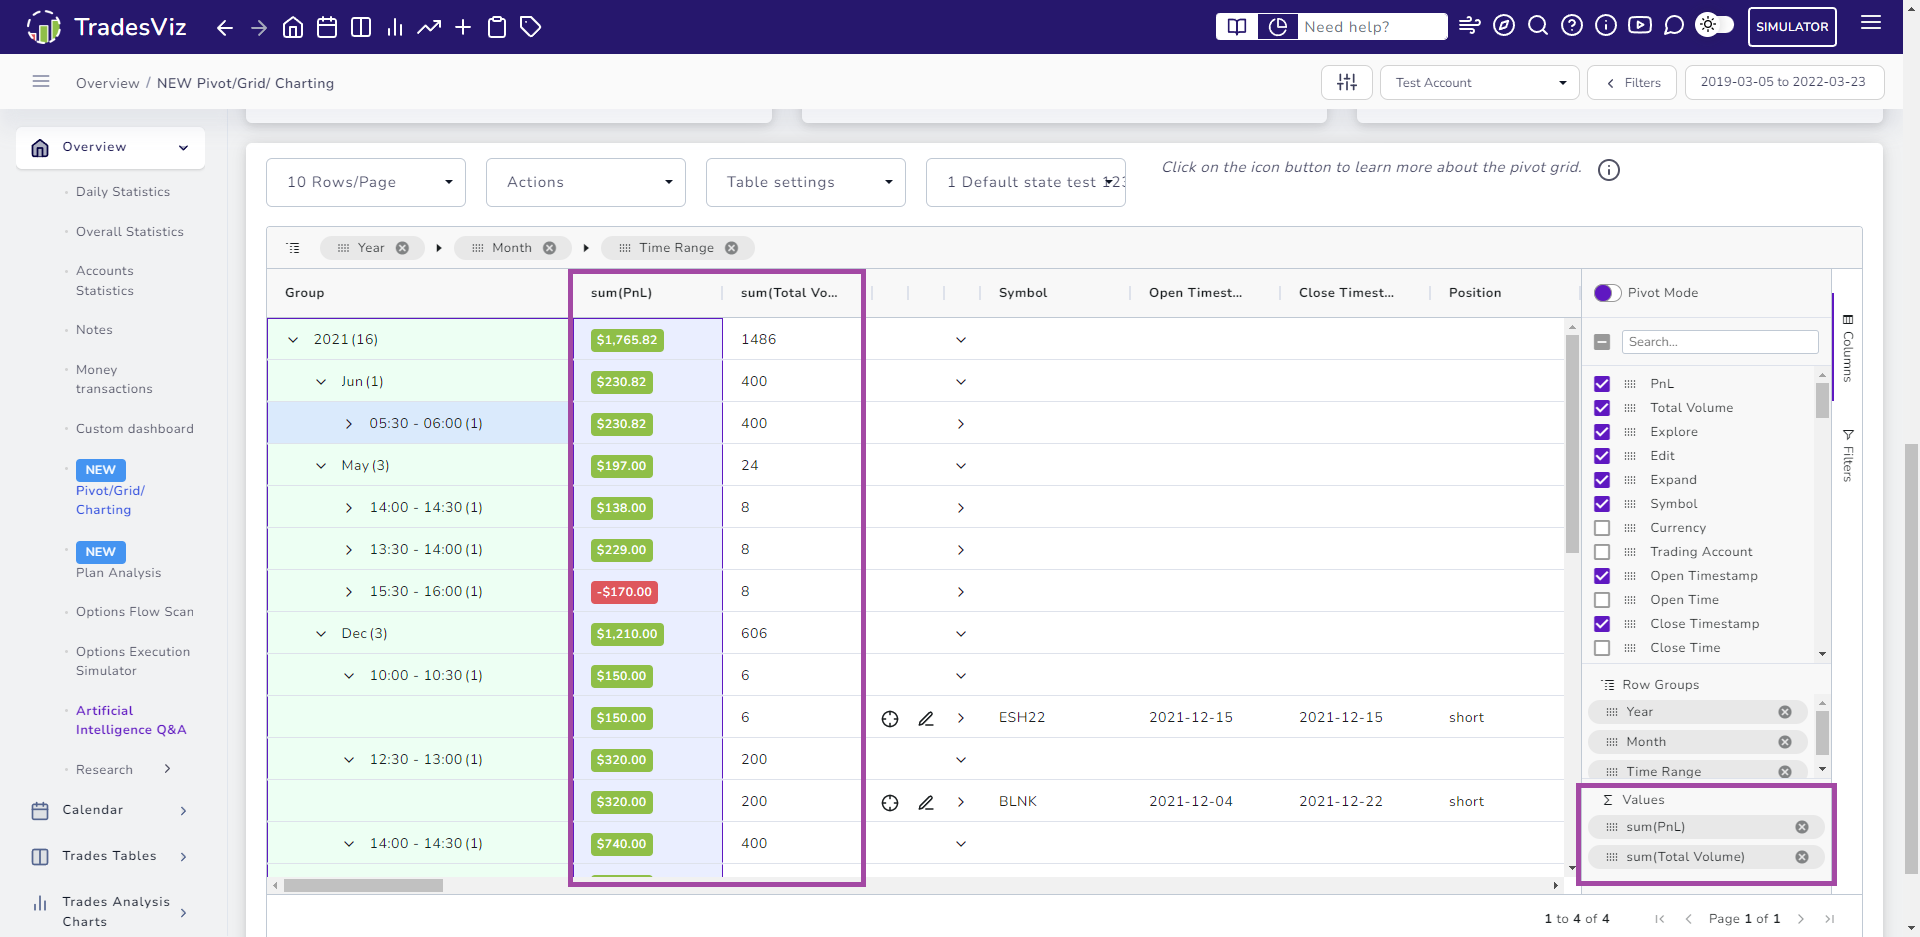
Notice the values section on the bottom right corner of the grid? You can drag any numeric-based value and that will automatically create a summary column.
This is just one small example. You can also replicate the charts you see on the other sections of the performance analysis tabs:
- Price range vs pnl
- Day of month vs pnl
- Time of day vs avg. quantity and max. MAE
Yes, you can not only create a summary where the number is summed up, but you can also change the group function: sum, avg, min, max, and count.
Once again, unlimited possibilities and ways for you to find and improve your trading edge.
These are just some simple use cases that can supercharge your trading analysis in a nearly effortless way.
Remember, trading is a journey that demands meticulous planning and execution, a dedication that often surpasses that of other professions. Sadly, the high failure rate in trading is rooted in the lack of commitment to harnessing invaluable trading data.
It's time for a paradigm shift - let's revolutionize the world of trade journaling and analysis, transforming it into a thrilling and indispensable tool for success. With pioneering features like the pivot grid, advanced charting, and more, we are taking bold strides toward progress. We hope you will join us in embracing these innovations, and together, let's empower traders to achieve their fullest potential.