We just launched the ability to add plans to any of your trades and training days. The goal of this feature is to enable traders to add custom stats that are qualitative but can be used for quantitative analysis.
Tags are one such example that can be added to any trade but it conveys limited information about what you wish to express about that trade. Trading or trading day plans are far more expressive as you can add text, numbers, checkboxes, and categorical conditions. We highly suggest reading our detailed blog post about plans, and how to add and manage them here: https://tradesviz.com/blog/trading-plan-checklist/.
Once you have added a couple of plan templates and have attached them to your trades and trading days, you are ready to analyze your data.
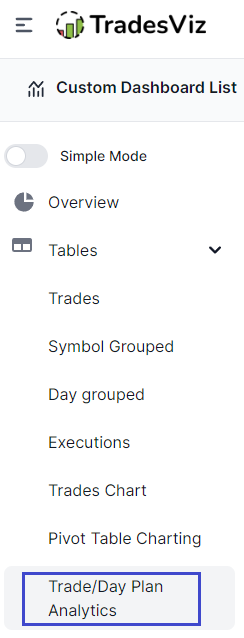
Head over to the new "Plan Analysis" tab under the Overview section on the left side of your dashboard:
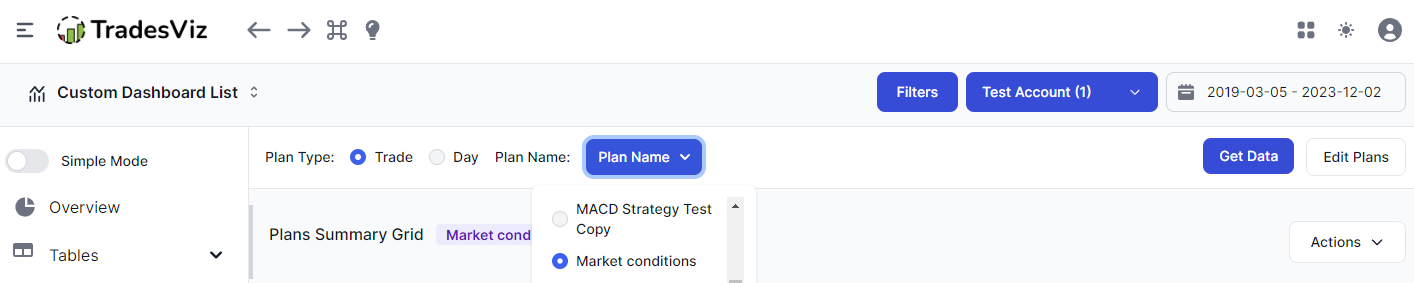
When you open this tab, you will see 3 sections and 1 control panel at the top with a dropdown and some buttons. We will explore each section one by one below.
First, the control section allows you to switch between viewing statistics and tables about either day or trade plans. When you click on "Day" or "Trade", the "Plan Name" dropdown's contents automatically change.
Select a plan from this drop and click on "Get data" and you will see all the 3 sections below fill up with tables similar to that of the pivot grid section.
The 3 tables you will see on this page (in order) are:
- Plans Summary Grid
- Plan-specific Checkbox Analysis Grid
- Plan-specific Trades Grouped Grid
Plans summary grid
The table shown in the image below is the Plans summary grid.
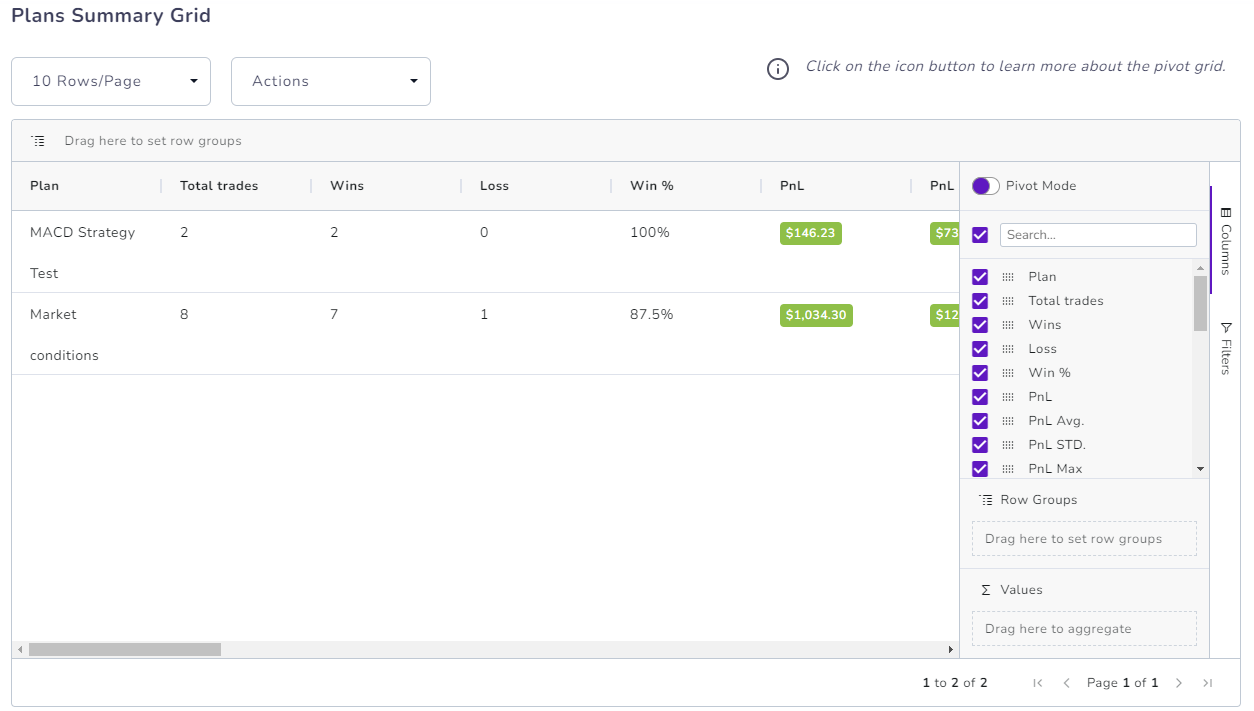
As the name implies, this is the only table on this page that shows the entire summary of each plan of the selected plan type (so it shows the same data no matter what plan you choose).
The purpose of this table is to show you the summary of your trades *per* plan. This summary includes statistics such as:
- Wins/Losses
- Win %
- Total/Min/Max PnL
- Total Trades
- Count of each type of conditions
- Total/Avg R-value
- Total Long/Short
- Best exit/EODexit stats
At a glance, you can find what trade/trading day plans work for you. It is important to note that for the trading day plan, we take all the trades that were *opened* on the day on which the plans were added.
You can use all the pivot grid features such as selecting the columns dynamically and drawing tables, changing to pivot to generate statistics, and so on.
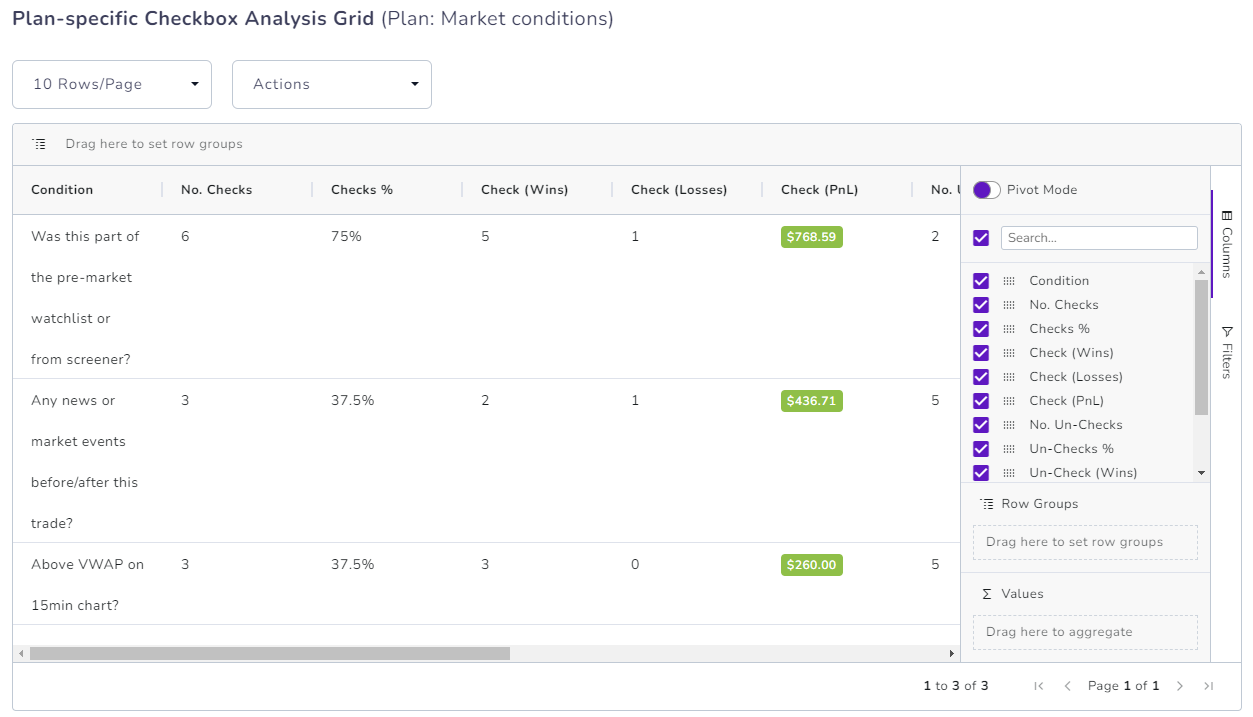
Plan-specific Checkbox Analysis Grid
Up next is the plan-specific checkbox-condition-specific grid where you will see the statistics about the checkbox conditions you have created in the selected plan.
For example, you might have created a plan that looks like the below:
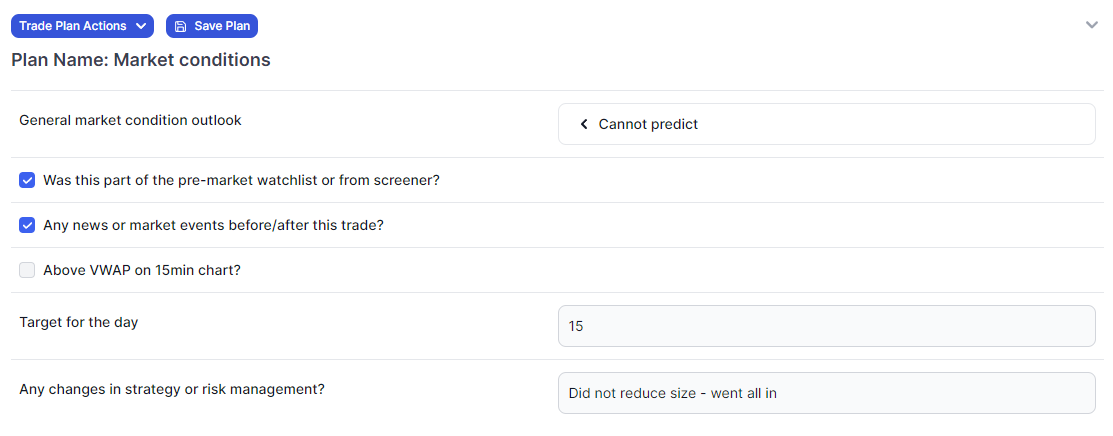
The above plan has 3 checkboxes. Say you have added this plan to about 50 or so trades - each having a different combination of checkboxes checked. How do you analyze this?
This table helps you with exactly that.
Essentially a summary table of how many checkboxes you have, how many have been checked, or unchecked, and how they correlated with your trade's performance.
One big use-case of this is: how well do you follow your trading plan?
The plan column is automatically pinned to the left so that you can view the different stats of each checkbox and check the stats of the checkbox compared to the trading performance - this is an excellent way to find correlations between *your own custom conditions* and the trading outcome.
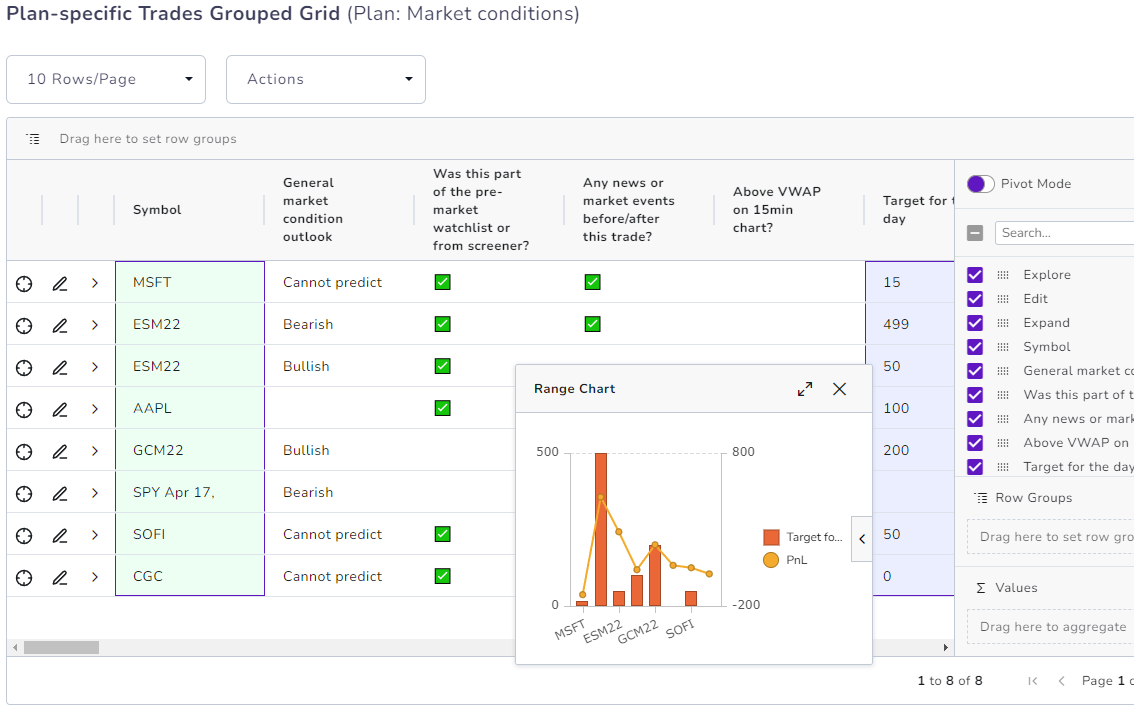
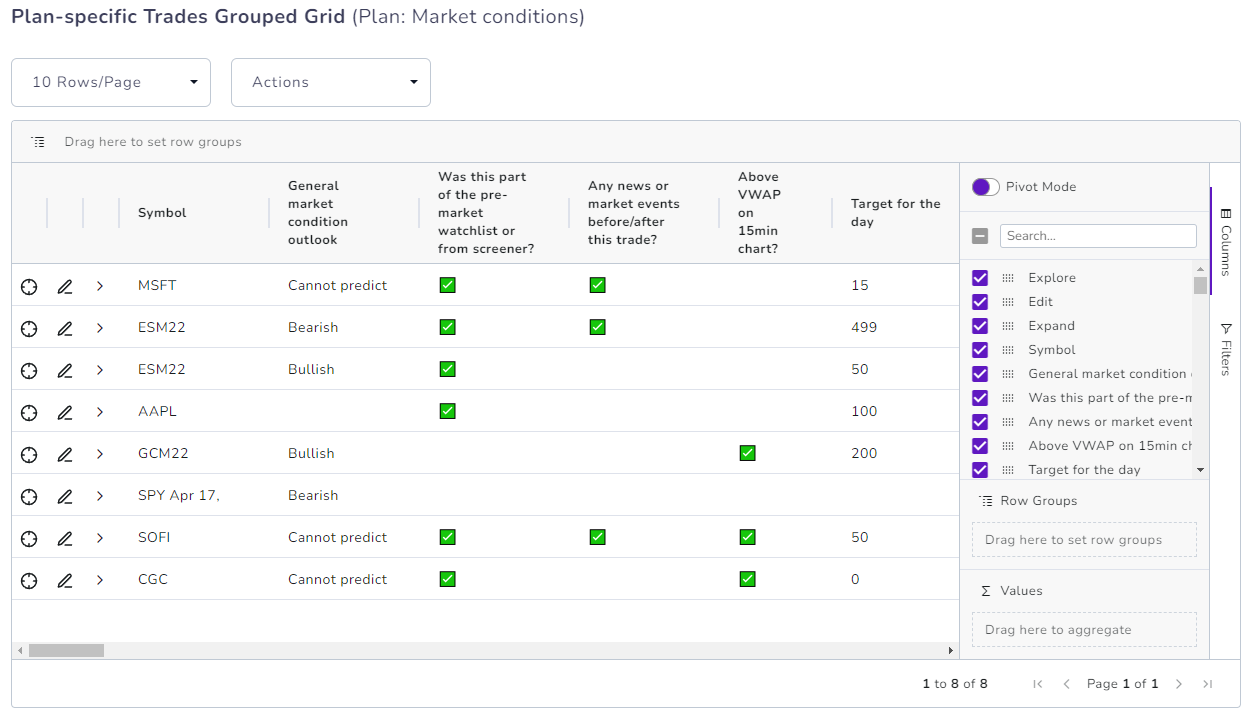
Plan-specific Trades Grouped Grid
Finally, we have the plan-specific grid that has the plan's details for each trade along with the 80+ trade metrics that you find in the pivot grid section for *each trade*. This of this table as the normal trades table + plan metrics.
Once again, some of the utility of this table is as follows:
- You can create your own numeric stat to a plan and attach it to any trade (say, target for the trade or, an indicator value or pretty much ANYTHING) and create metrics/charts/graphs using the pivot grid
- You can create your own categories (think of them as different types of tags). An idea is: to attach 3 or 4 categories that can act as the type of variants of strategies you use and then use the filled-in data in the pivot mode to analyze PnL and more advanced stats.
- You can summarize the checkboxes using the pivot mode to summarize the checkboxes statistics also in addition to the above features.
As you can see, the possibilities of extremely useful trading performance analysis are endless using custom plans + pivot grid feature of TradesViz.
Here's another short video that shows some of these utilities:
This has been a long-time request from many traders who are looking for TRUE FLEXIBILITY in trade journaling:
How can I add my own metrics/stats?
So far, no journal except for plain excel sheets were able to satisfy this request. That is until we released the plans + plan analysis feature on TradesViz.
This effectively renders ALL excel sheets useless if you are using an excel sheet only to add your metrics or have a level of flexibility that you have not found in a journal.
No other journal has this nor is any journaling solution even close to the level of analytics prowess you see demonstrated here in TradesViz.
The bottom line is this: On top of the 80+ stats we have (R-vale, best exit, various PnL metrics, etc.,) you can add YOUR OWN custom metric using the various conditions of the plan. Adding stats is not enough though... but with the pivot tables you have on TradesViz, you can visualize any statistic.
There you have it: the single feature that makes TradesViz as flexible as an Excel sheet with unlimited scope for customization.
Want to learn more about creating effective plans?
We hope this serves as an important and very useful feature for all TradesViz users.
As always, if you have any questions or feature requests, please don't hesitate to contact us at [email protected]!