Changelog
16 min read
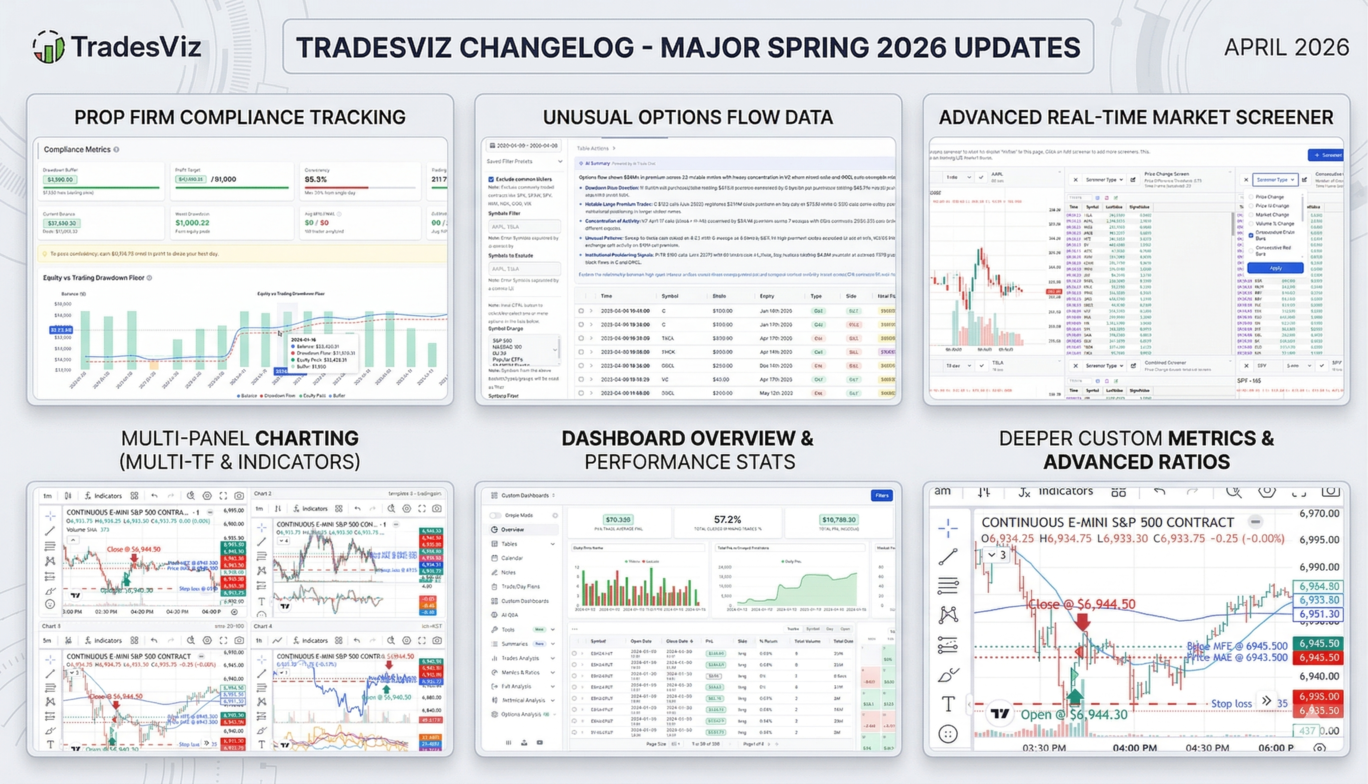
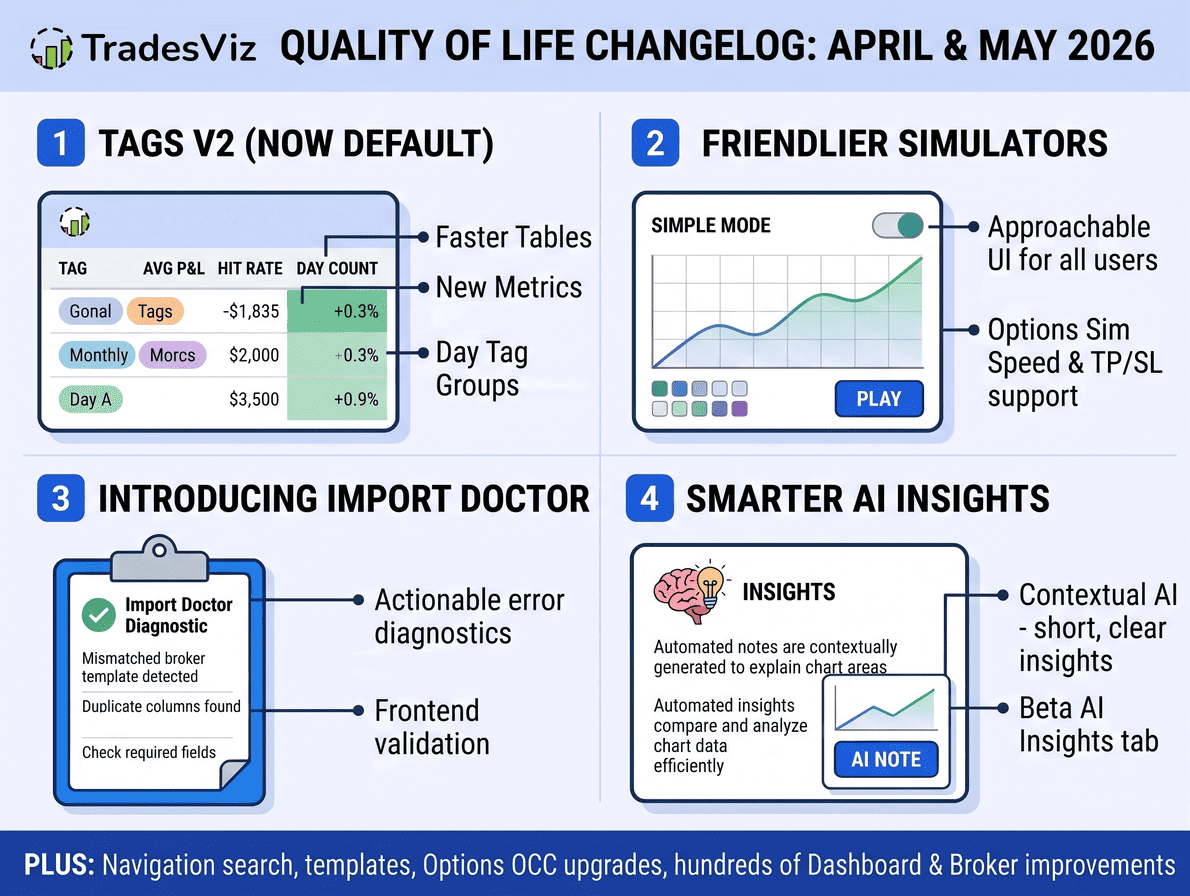
April - May 2026 Quality-of-Life Update: Tags v2, Simpler Sim, Smarter Imports & More
Tags v2 as default, Simulator Simple Mode, Import Doctor, sidebar search, AI notes on every chart, faster options flow + 60+ broker fixes - TradesViz Apr–May 2026 QoL changelog.