AI Daily Brief: Daily Trading Insights You Can Actually Trust
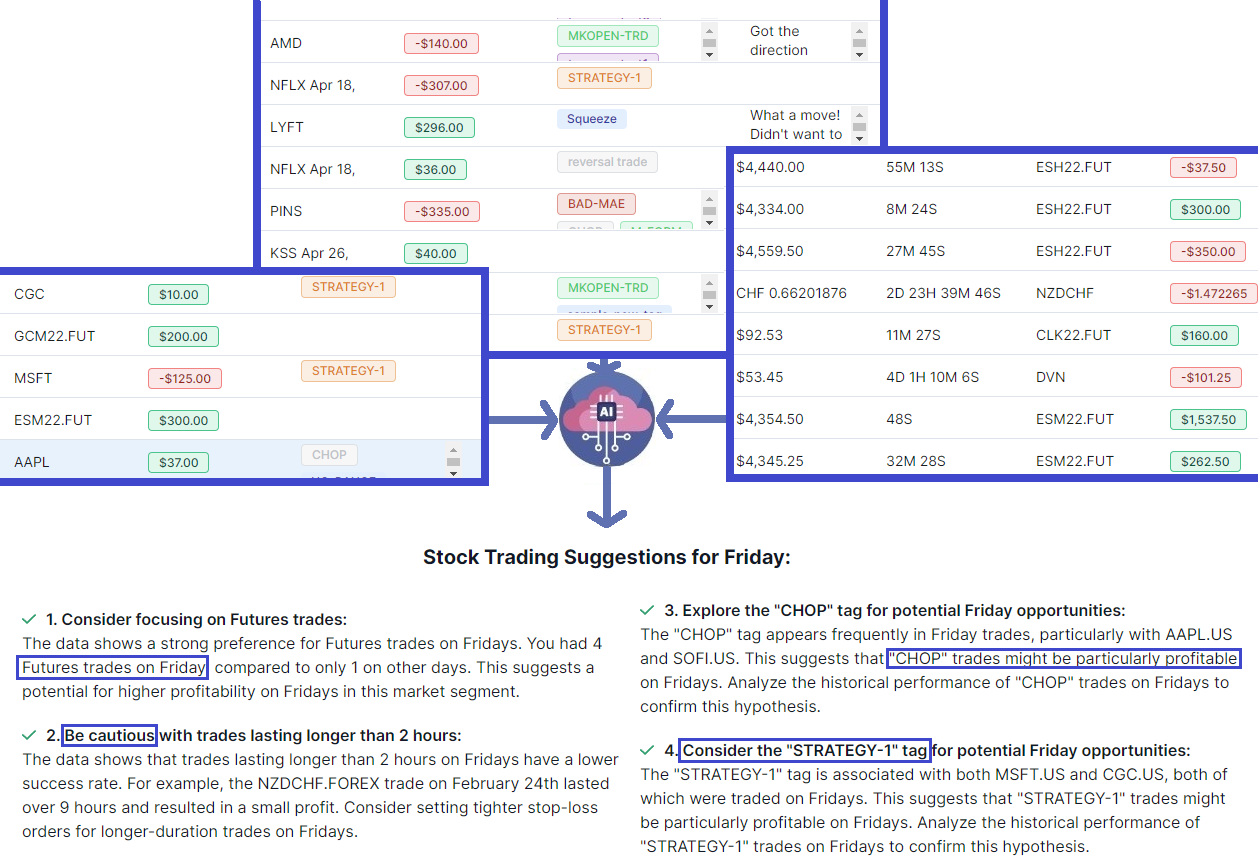
The TradesViz AI Daily Brief reviews each session against your own history and preps the next. Every number comes from your trading journal, never an AI guess.
Guides, changelogs, deep dives and everything trade journaling.
The TradesViz AI Daily Brief reviews each session against your own history and preps the next. Every number comes from your trading journal, never an AI guess.
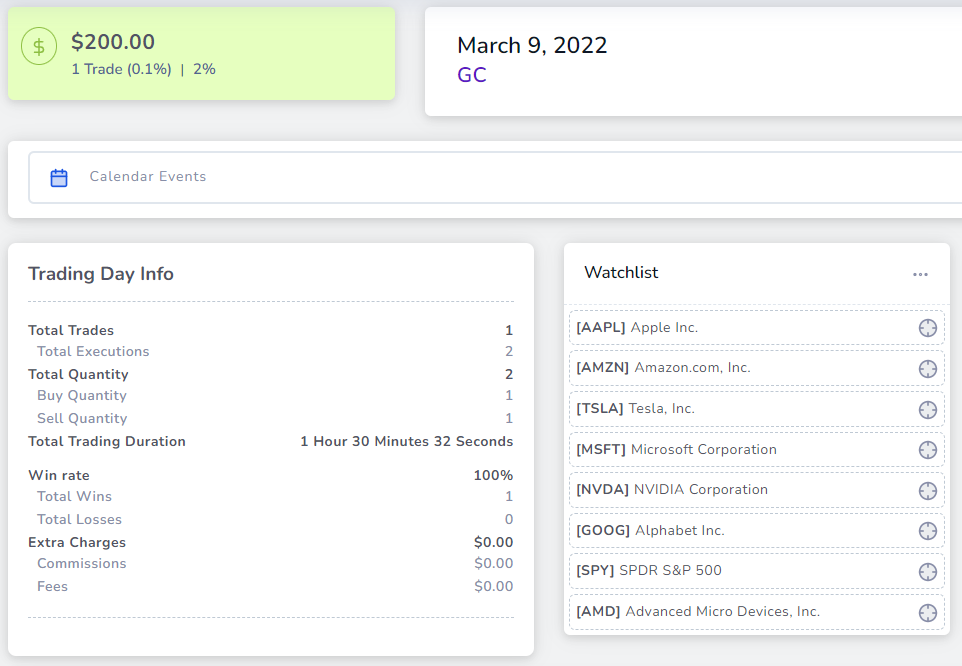
TradesViz has different types of visualizations for calendar-based stats - monthly, weekly, and yearly. But So far, you've had to explore each day or check the group-by-day table to check the per-day stats. With the introduction of the day view, we are bringing all of that in one single tab.
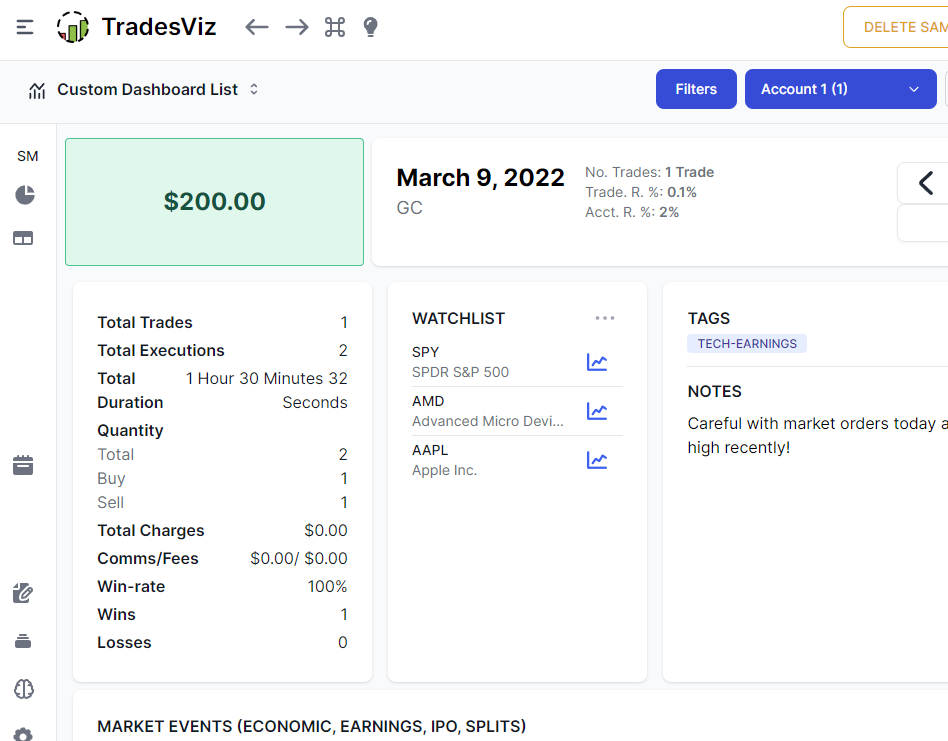
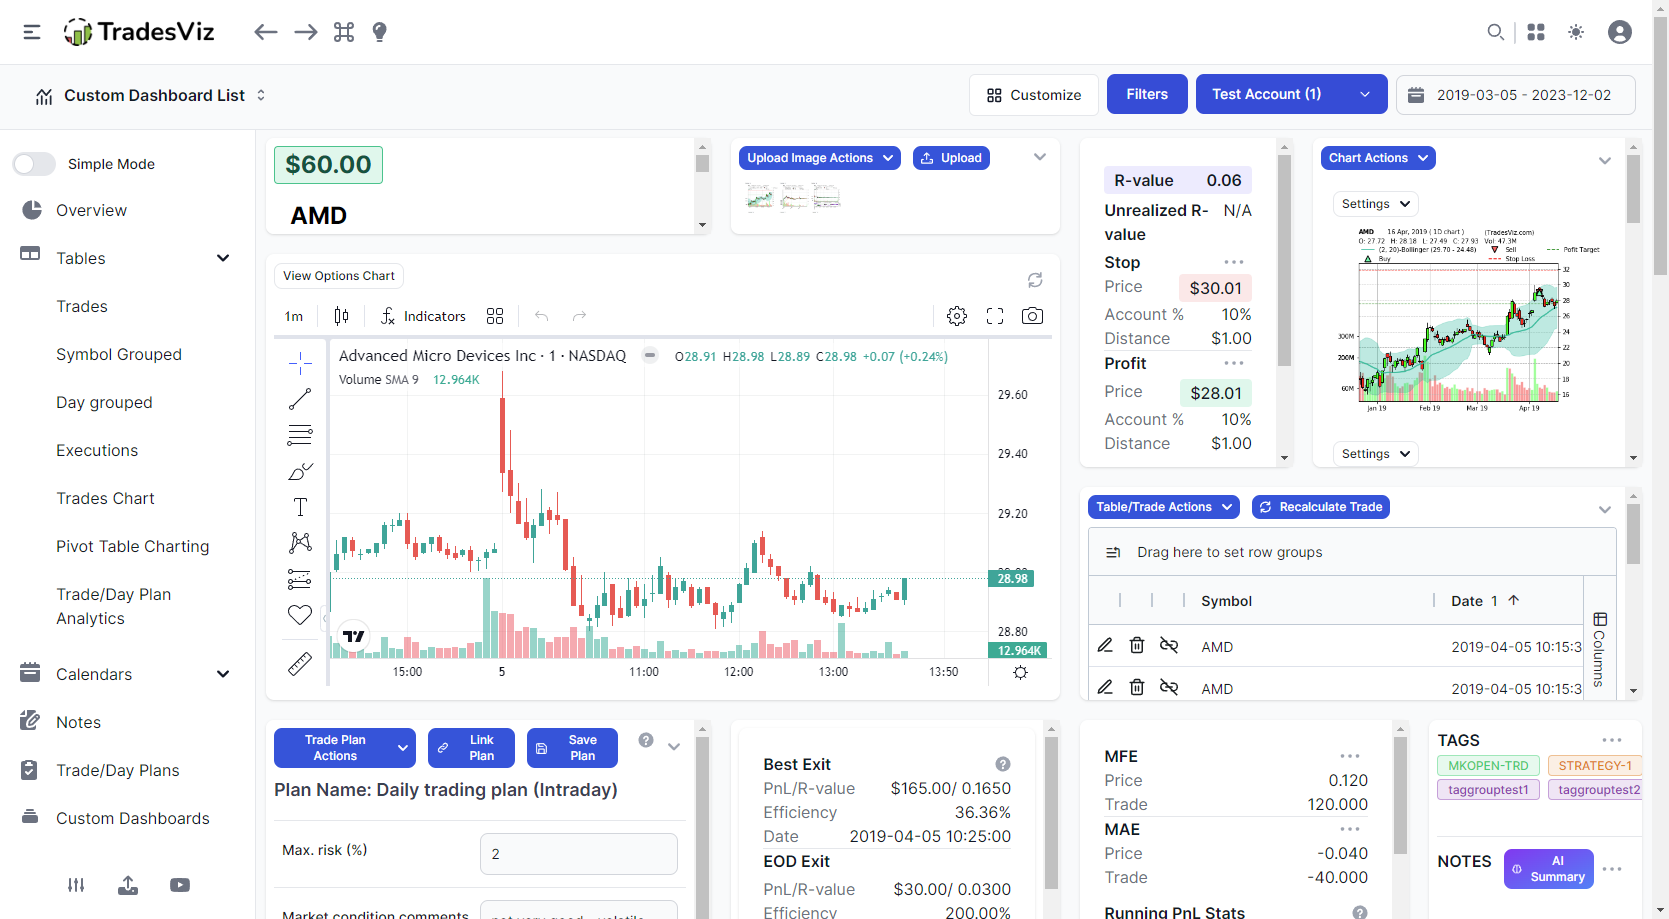
We made it possible to have custom dashboards and now it's time to customize the most commonly used tabs on TradesViz: Trade and Day explore tabs! If you like custom dashboards, you will love this feature!
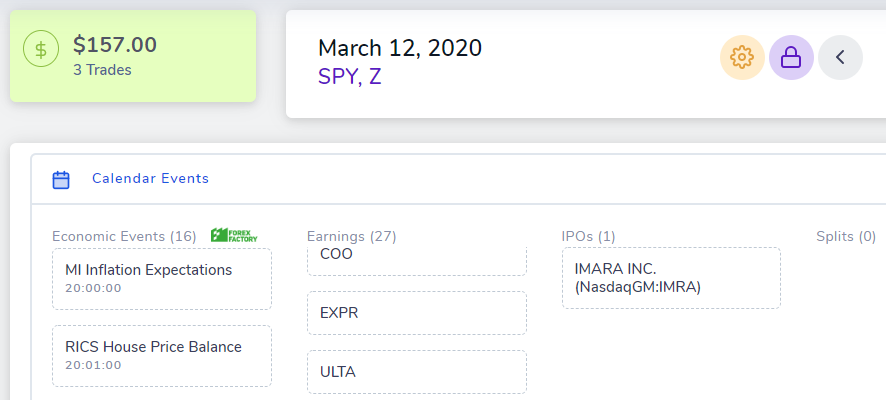
Day explore is a feature unique to TradesViz. It gives you the freedom to plan your trades, view economic events, and earnings, see all the trades you made on any particular day, add charts, and more! After tens of thousands of traders exploring their trading days, we have plenty of feedback and have put it all into the v2 version of the TradesViz Day Explore.
You can now create a watchlist for each trading day easily via the day explore tab! Plan every step of your trading day easily with TradesViz!
Get an overview of your full trading day with info about all market events such as earnings, IPOs, and also a list of global economic events happening on that day. Learn more about how you can even add charts, share your trading day, etc., in this post.