Back in 2023 we launched the Options Execution Simulator, which let you price any multi-leg options position on any historical date and see exactly how it would have moved. Since then, the single most requested follow-up from options traders has been some version of the same question: "this is great, but can I run it on every day for the last six months?"
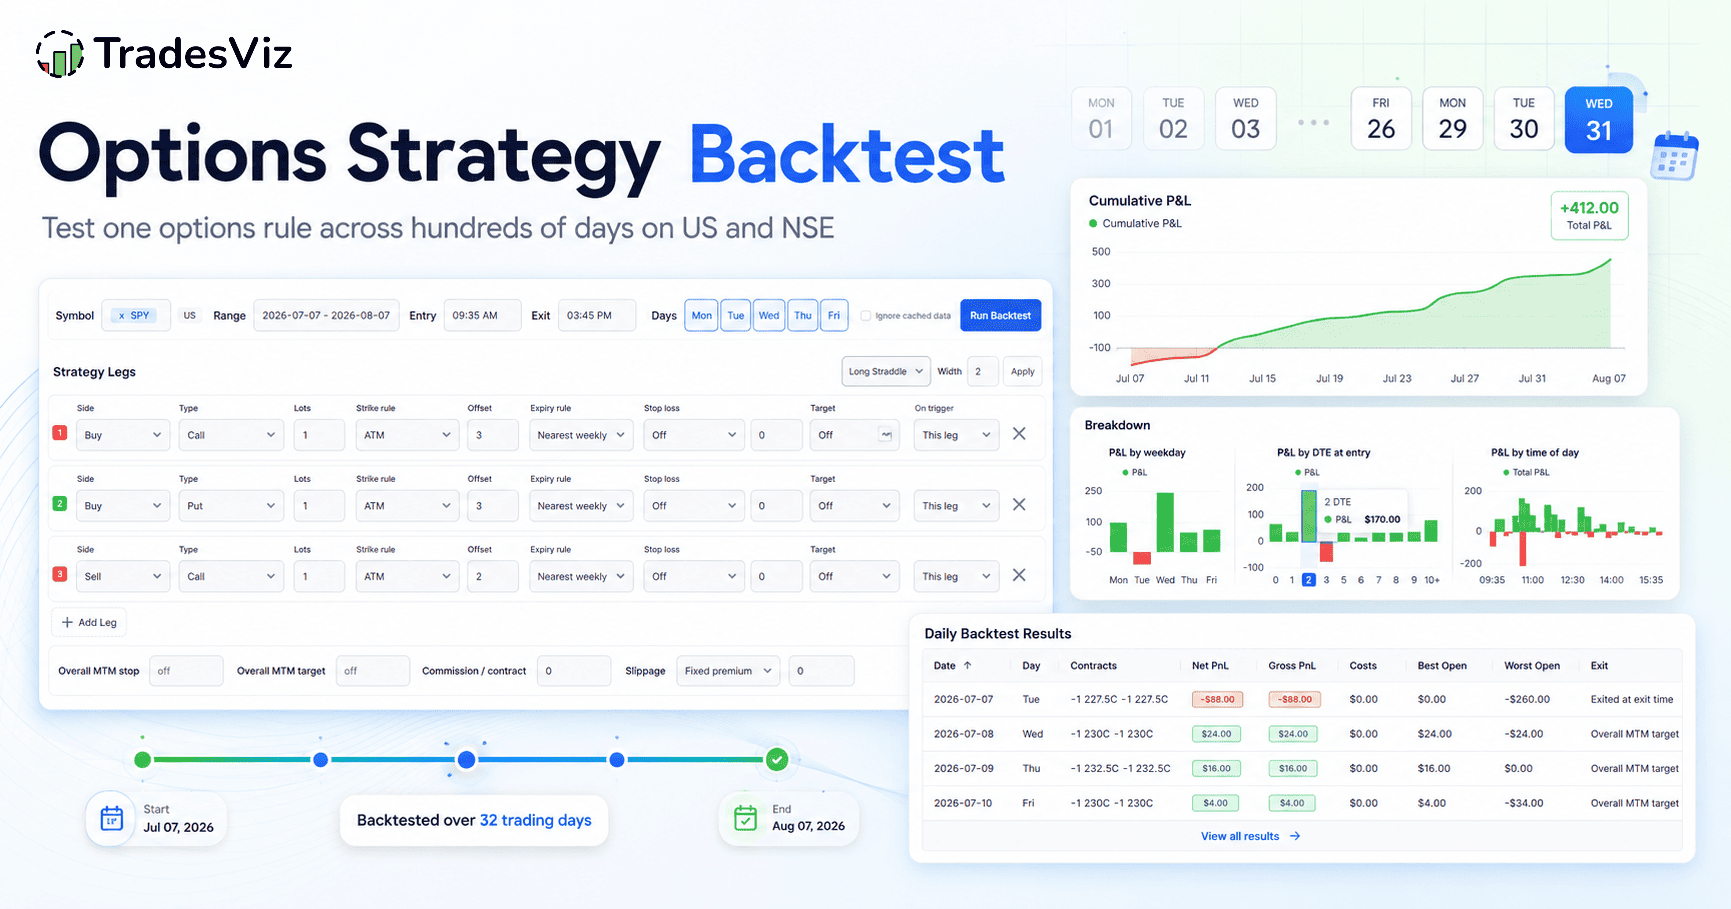
Now you can. We're launching the Options Strategy Backtest - a new tab that takes one options rule and runs it across hundreds of trading days, then gives you the win rate, drawdown, expectancy, streaks and equity curve for the whole sample. And it works on both US and NSE options, which we believe makes it the only tool that covers both markets in one place.
Why we built a second options tool instead of extending the first
The Option Execution Simulator is a microscope. You give it one position on one date and it shows you the minute-by-minute path, the best exit that was available, your capture ratio, and the biggest open profit and open loss the position saw along the way. It answers "what happened to this trade", and it answers it very well.
What it can't do is tell you whether a strategy is any good, and that's not something we could fix by adding more charts. Maximum drawdown, win rate, expectancy, longest losing streak - all of these need a lot of trades before they mean anything. On a single date there's simply nothing to calculate them from.
So the Backtest is the other half of the pair. It borrows the same strike and expiry logic, but instead of one date it rebuilds and re-prices your position on every trading day in a range, and hands you a distribution instead of a single result.
Where to find it
It's a new tab in your dashboard called Options Strategy Backtest, right next to the Option Execution Simulator in the sidebar. It's a Platinum feature.
The whole idea in one paragraph
You're not entering a trade here. You're writing down a recipe, and then asking us to cook it every single day and show you how the meals turned out.
The recipe has four parts, and that's genuinely all there is to it:
- What do I trade? For example: "sell the at-the-money call and the at-the-money put on this week's expiry".
- When do I get in and out each day? For example: "buy at 09:20, close everything at 15:15".
- When do I bail out early? For example: "if any leg loses 25% of the premium I took in, close everything".
- Which days do I do this on? For example: "every weekday, for the last six months".
You fill those four things in once. We then repeat that recipe on every trading day in your range, treating each day as a completely separate trade, and add up the results at the end. If your range has 120 trading days, you get 120 little trades and one set of statistics describing all of them.
Now let's go through the screen in that order.
Part 1 and 2: which symbol, which days, and when you get in and out

- Symbol - just start typing. The search only suggests symbols that actually have options data, and it covers both US and NSE. There's no separate market dropdown to keep in sync: pick NIFTY and we know it's an NSE backtest, pick SPY and we know it's a US one. The little badge next to the box confirms which.
- Range - the window you want to test.
- Entry and Exit - the times you open and close the position each day, in exchange time. We default these to sensible session times based on the market your symbol implies (09:20 / 15:15 for NSE, 09:35 / 15:45 for US), and you can change them to whatever you like.
- Days - which weekdays to trade. Click a pill to toggle it. This is how you test things like "only on expiry day" or "skip Mondays".
Part 3: what you're actually trading
This is the part that trips people up, so let's go slowly.
A normal options order says something like "sell one NIFTY 24500 call expiring 12 June". That's fine for a single trade, but it's useless as a recipe. If you tried to repeat it every day for six months, you'd be selling the same 24500 strike in September as you did in March, long after the market moved somewhere else entirely. By the end you wouldn't be testing a strategy, you'd be testing one stale strike.
So instead of naming a strike, you describe how to pick one. Something like "whatever strike is closest to the current price", or "two strikes above whatever is closest to the current price". Each morning we look at where the market actually opened that day, apply your description, and pick the strike it lands on. Same recipe, different strike each day, exactly like a real trader would do it.
Same story for expiry. You don't say "12 June", you say "this week's expiry" or "about 30 days out", and we find whichever expiry was genuinely listed that day and fits.
Legs: one row per contract
Each contract in your strategy is one row, which we call a leg. A short straddle is two legs (sell a call, sell a put). An iron condor is four. You can have up to eight.
You can add legs by hand with Add Leg, or pick a template from the dropdown and hit Apply to fill them in for you. Templates aren't magic and they don't lock anything - they just save you typing. Once applied, every field is yours to edit.
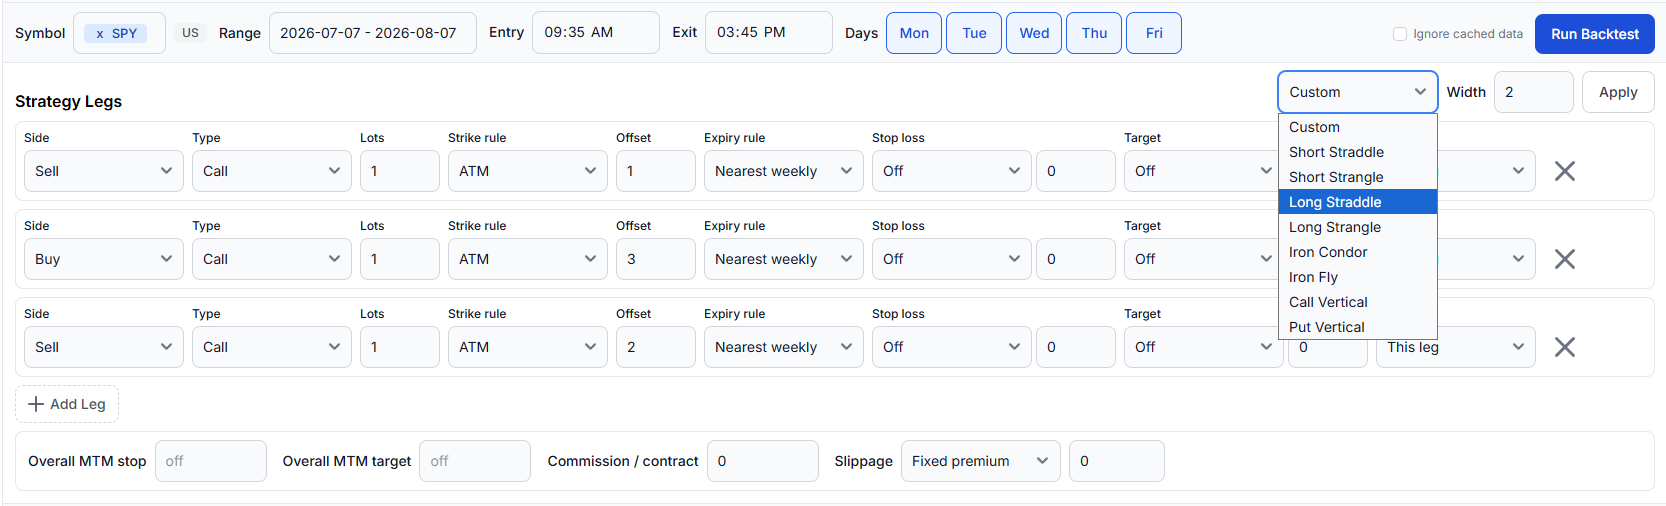
We've included Short Straddle, Short Strangle, Long Straddle, Long Strangle, Iron Condor, Iron Fly, Call Vertical and Put Vertical. The Width box sets how far apart the legs sit in strikes, so one control resizes the whole structure - set width to 2 on an iron condor and you get wings at ATM +/- 2 and +/- 4 strikes.
What each field on a leg does

- Side and Type - buy or sell, call or put.
- Lots - contracts for US, lots for NSE. We apply the correct lot size per symbol automatically.
- Strike rule and Offset - covered just below.
- Expiry rule - also just below.
- Stop loss and Target - per leg, either as a percent of the entry premium or in premium points. Leave them on "Off" if you don't want them.
- On trigger - when a leg hits its stop or target, do you close just that leg, or all legs? "All legs" is how you say "if my short call gets hit, I'm out of the whole condor".
Strike rule and Offset: how the strike gets picked
Two controls working together. The Strike rule says what you're measuring from, and the Offset says how far to move.
Everything is measured from ATM, which just means "at the money" - the listed strike closest to where the underlying actually was at your entry time that morning. If NIFTY is at 24,512 and strikes are listed every 50 points, ATM is 24,500.
From there:
- Want exactly at the money? Strike rule = ATM, offset ignored. You get 24500.
- Want two strikes higher? ATM +/- N strikes with Offset = 2. Strikes are 50 apart, so you get 24600.
- Want two strikes lower? Same rule, Offset = -2. You get 24400. Negative goes down, positive goes up, always.
- Prefer to think in percent? ATM +/- N% with Offset = -1 means 1% below the underlying, so 24,512 minus 1% is 24,267, and we snap to the nearest listed strike: 24250.
- Prefer raw points? ATM +/- N points with Offset = 300 means 300 points above, so 24,812, snapping to 24800.
The important bit: whichever rule you choose, it's recalculated from scratch every single day.
| Rule | What the offset means | Example |
|---|---|---|
| ATM | not used | The listed strike closest to the underlying at your entry time |
| ATM +/- N strikes | steps along the strike ladder | Offset 2 on NIFTY (50-point ladder) lands 100 points away |
| ATM +/- N% | percent of the underlying | Offset -1 is 1% below spot, snapped to the nearest listed strike |
| ATM +/- N points | absolute points | Offset 300 is 300 points above spot, snapped to a listed strike |
Expiry rule: which expiry gets picked
Same idea. You describe the expiry you want rather than naming a date, and we find whichever one was actually listed that day.
If you sell "this week's expiry" every day, then on Monday you're trading a contract with 3 days left, and by Thursday you're trading one with 0 days left. That's not a bug, that's what the strategy really is - and it's exactly why the P&L by DTE chart later on is worth a look.
| Rule | What it picks |
|---|---|
| Nearest weekly | The nearest listed expiry that isn't the standard monthly |
| Nearest monthly | The nearest monthly expiry. For US that's the third Friday; for NSE we use the last expiry of the calendar month, since NSE has changed its expiry weekday more than once and that's the only rule that stays right across the whole history |
| 0DTE | An expiry on the trade date itself |
| 1DTE | An expiry the next day |
| Target DTE | The listed expiry closest to the number of days you type in |
Legs can use different expiry rules from each other, so calendars and diagonals work too - set the short leg to Nearest weekly and the long leg to Target DTE 30.
Part 4: when to bail out early
By default a day runs from your entry time to your exit time and that's it. Stops and targets are how you say "actually, get me out sooner if things go a certain way".
There are two levels, and they're easy to mix up:
- Per leg (the Stop loss and Target boxes on each leg row) - these watch that one contract. "If this specific call doubles in price, I'm out of it."
- Max daily loss and Daily profit target (the two boxes below the legs) - these watch the whole position added together, in money rather than percent. "I don't care which leg did it, if I'm down 5,000 on the day, close everything."
A per-leg stop can be set in two units. % means percent of that leg's own entry premium, so a 25% stop on a leg you sold at 100 fires when it reaches 125. Pts means raw premium points, so a 20-point stop on that same leg fires at 120.
Then On trigger decides what happens when it fires: close just This leg and let the rest keep running, or close All legs and end the day right there. For a condor most people want "All legs" on the short strikes.
Why a day can lose more than your Max daily loss
This one surprises people, so it's worth spelling out. Set Max daily loss to 100 and you'll still see days that finish at -180 or -240. The stop isn't broken - here's what's actually happening.
We check your position's open P&L on every 1-minute mark. If the position is fine at 10:31 and already down 240 at 10:32, then 10:32 is the first mark we can act on, and that's where the day closes. There's no price in between for us to exit at, because the market never printed one. A real stop behaves exactly the same way - you can't get filled at a price that never traded.
What makes it feel extreme on index options is the contract multiplier. SPX options are 100x, so one single point of premium is 100 of P&L on one contract. A 100 Max daily loss on an SPX position is therefore a one-point stop, and a one-minute 0DTE bar moves more than a point all the time. You've set a stop tighter than the instrument's own granularity, so it gets jumped nearly every time it fires.
You don't have to work this out yourself. When your Max daily loss ends a day past the limit, the results page tells you how many days it happened on and by how much, on average and at worst. If those numbers look large next to your limit, the stop is too tight for the contract - widen it, or read it as "get me out once I'm at least this far down" rather than a hard cap on the loss.
Costs: making it realistic

Both boxes live in the same row as the Max daily loss and Daily profit target we just covered, and like those two they are amounts of money.
- Commission / contract - what your broker charges per contract, charged once when you open and once when you close. Set 20 with a two-leg strategy at one lot each and you're paying 80 a day.
- Slippage - your allowance for not getting a perfect fill. Either a fixed premium amount (0.05 means every fill is 0.05 worse than the recorded price) or a percent of premium (1% means a fill at a premium of 100 costs you an extra 1.00). It's charged on both the way in and the way out.
Slippage always works against you, whichever way you're facing. If you're long you pay a bit more to get in and sell a bit lower to get out; if you're short it's the reverse. Either way it's a cost, never a bonus.
One nice side effect of how we apply costs: changing a commission or slippage assumption re-prices instantly without refetching anything. Run once, then try three different cost assumptions in a few seconds.
Running it
Hit Run Backtest and you'll see a progress box walk through what it's doing - reading the underlying series, finding the trading days and listed expiries, working out the strike ladder, then pulling option prices day by day.
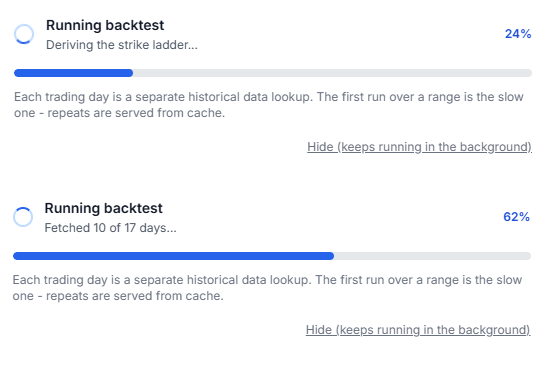
Historical options data lives in cold storage, so the first run over a new range is the slow one. After that we cache every price per day, which means:
- Re-running the same range is nearly instant.
- Extending a range by a month only fetches that month.
- Changing stop losses, targets, costs or MTM rules fetches nothing at all, because those are applied to prices we already have.
That last point is the one worth remembering. Iterating on rules is free, so try a lot of them. There's an Ignore cached data checkbox if you ever want to force a fresh read.
Reading the results
Start with the excluded-days banner
Before you look at a single number, check this. If a leg had no traded data on a given day, we exclude that day and tell you - we never quietly count it as a flat day, because that would drag every average towards zero and make a strategy look calmer than it was.

The banner shows how many days were excluded, what share of the range that is, and why, grouped by cause. If it goes above 20% we say so directly, because at that point the numbers underneath are describing a biased subset and you should treat them as indicative.
How the P&L actually adds up
Worth being precise about this, because it changes how you should read every number on the page.
One day at a time. For each trading day we work out what each leg made or lost, add those together to get that day's gross P&L, then subtract that day's commissions and slippage to get its net P&L. A leg's result is simply (exit price minus entry price), flipped if you sold rather than bought, multiplied by your lots and the contract multiplier or lot size.
Then we add the days up. Total Net P&L is the plain sum of every day's net P&L. Nothing is compounded and nothing is reinvested. If you made 500 on Monday and lost 200 on Tuesday, you're at 300.
The equity curve is a running total of that sum, one point per trading day. It is a cumulative P&L line, not an account balance and not a percentage return. There's no starting capital in the model, because a backtest that trades the same one lot every day doesn't need one. That also means Max Drawdown is a currency amount, not a percentage: it's the biggest peak-to-trough drop on that cumulative line, and we also tell you how many trading days it took to climb back to the old peak.
Two more things people ask about:
- Win Rate counts days, not legs and not contracts. A day is a win if its net P&L is above zero, however messy the individual legs were.
- Expectancy and Avg Day P&L are the same number here, because each day is one trade and every trade is the same size. We show both because people look for different names.
The headline numbers
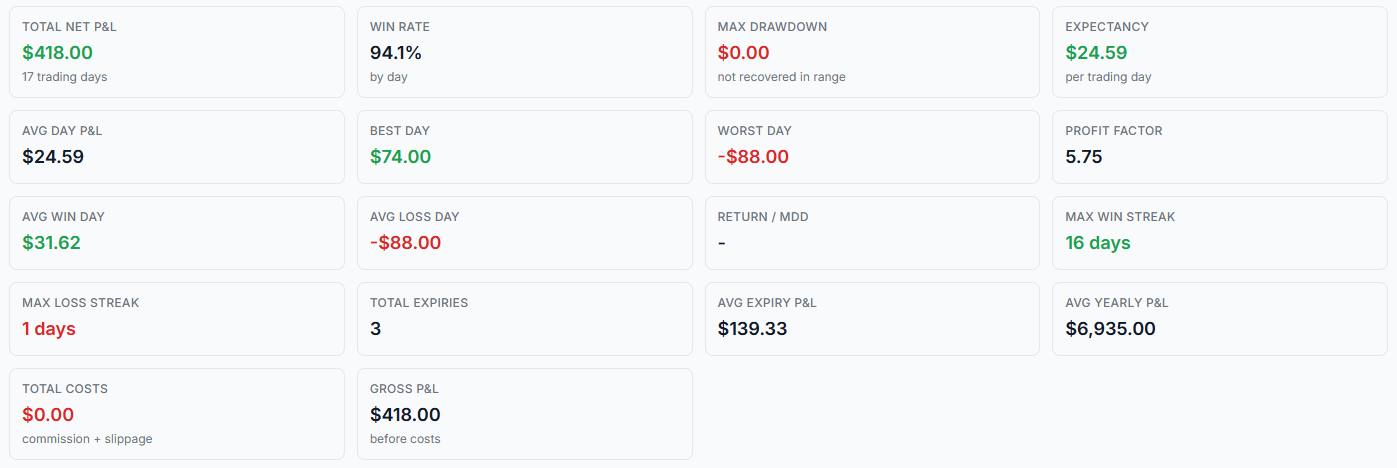
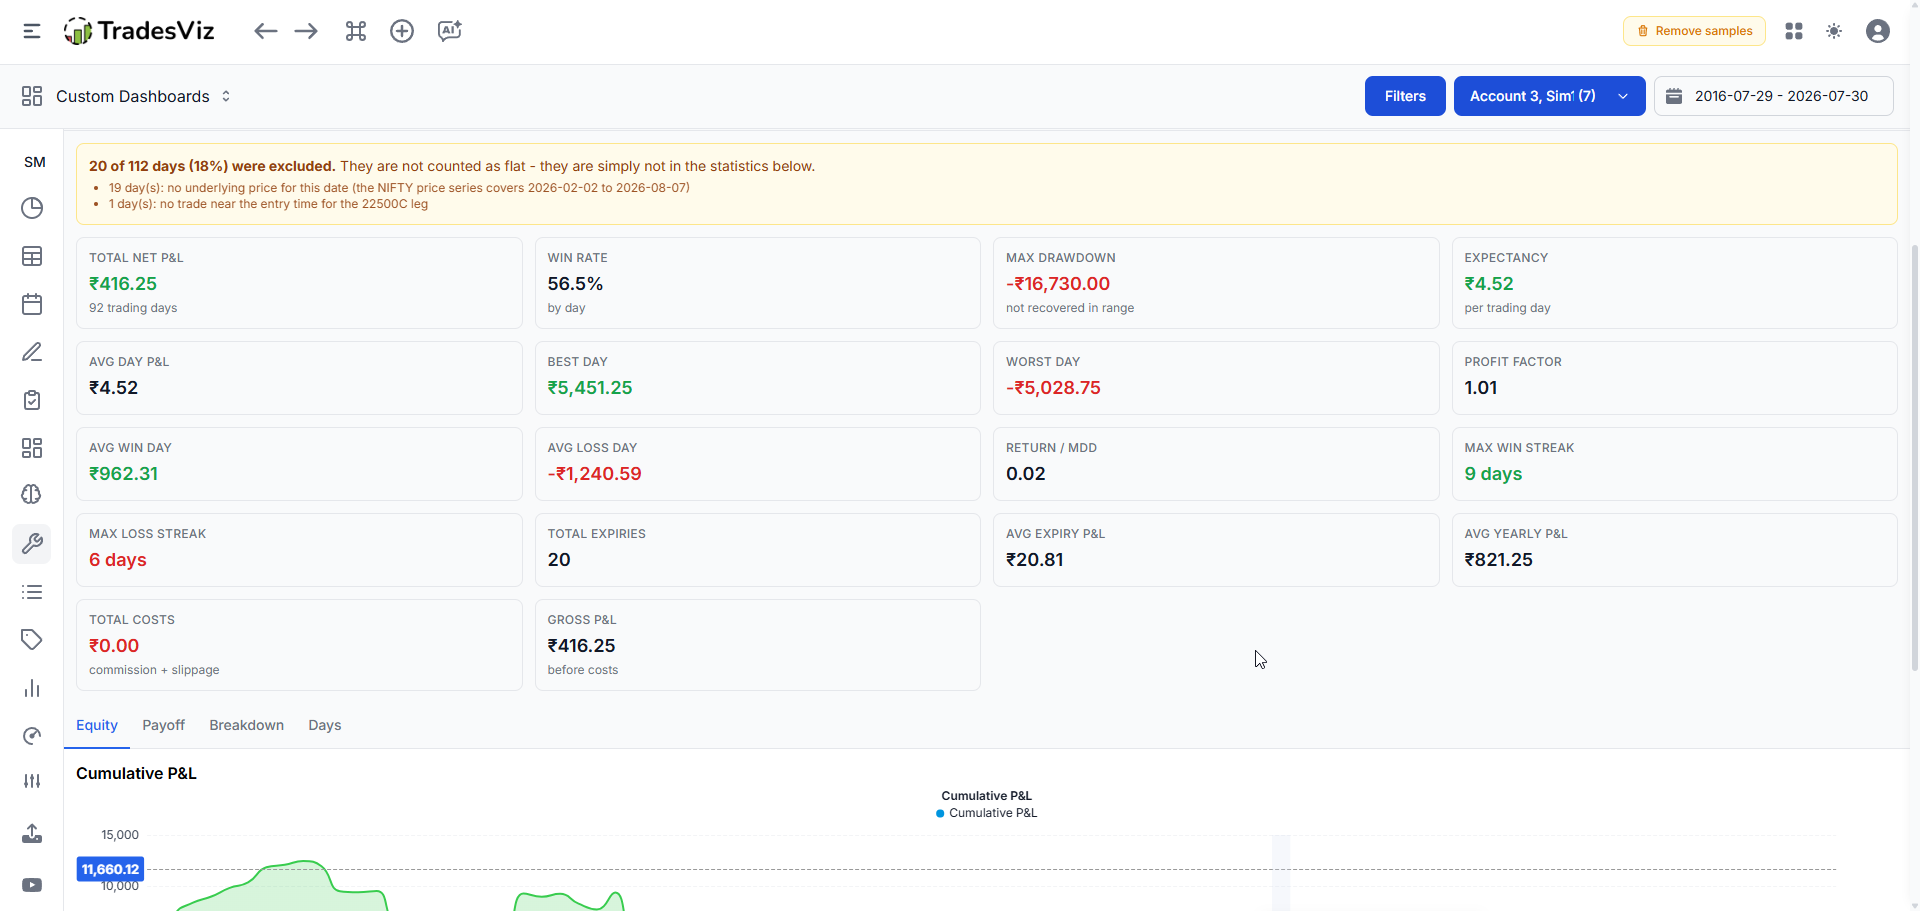
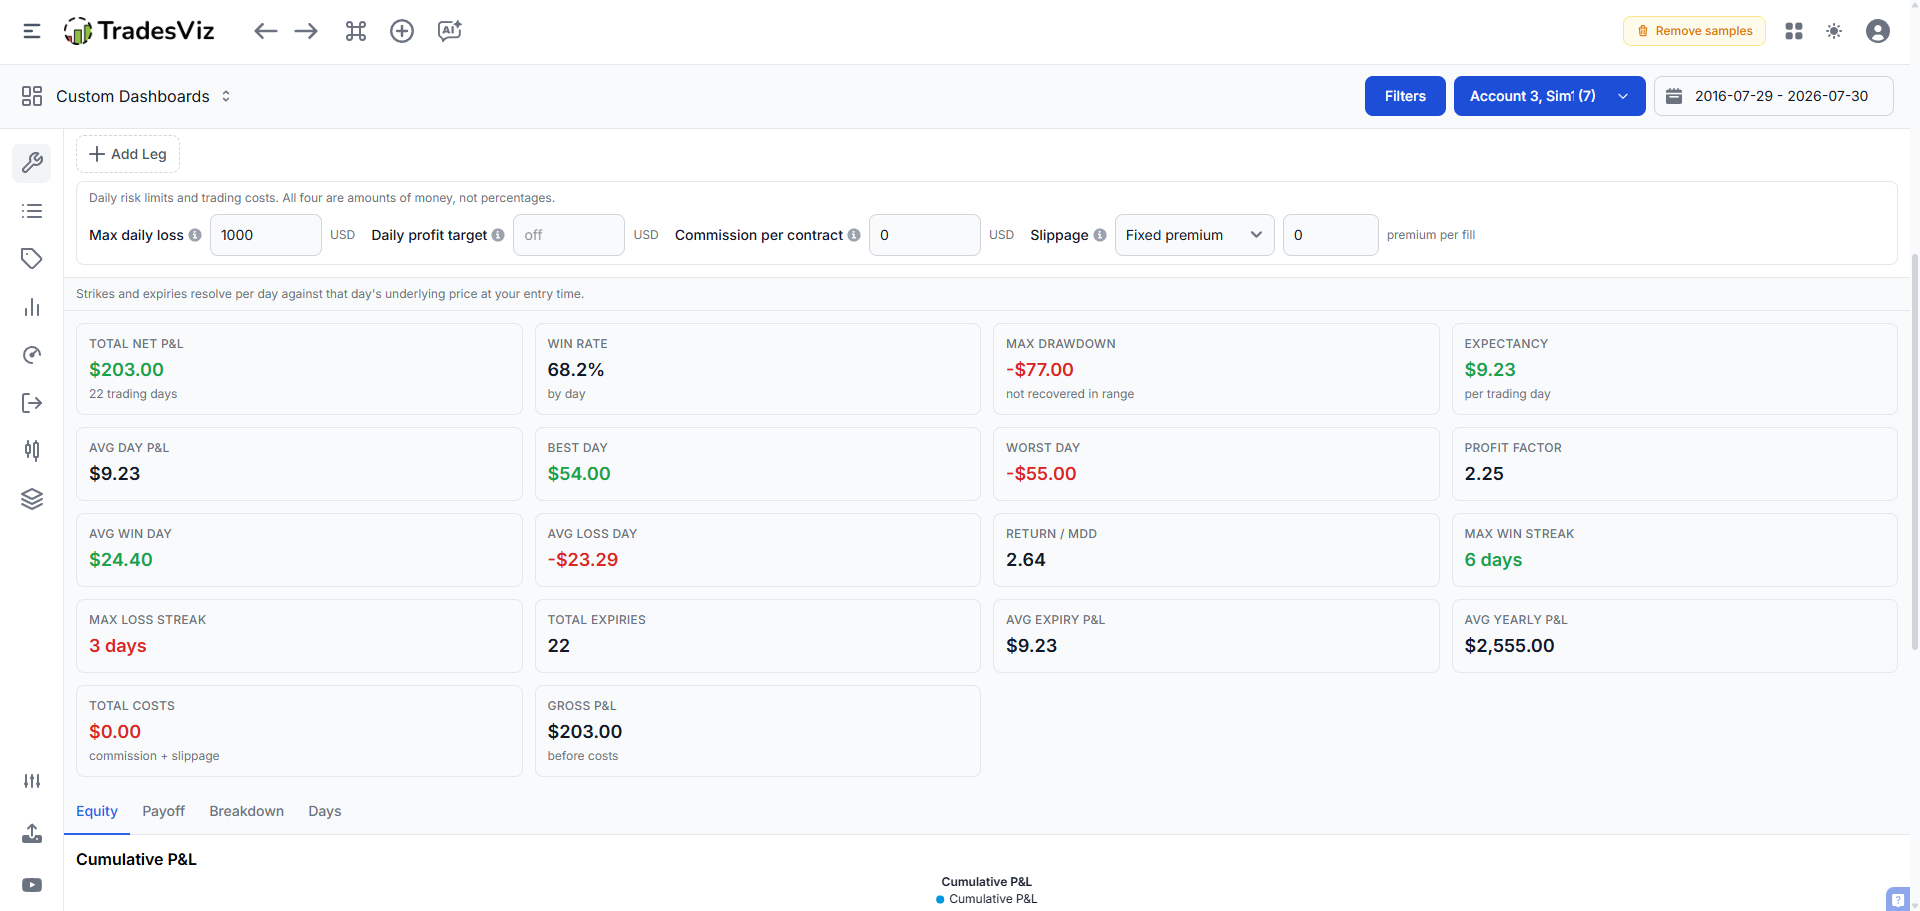
Four cards up top - Total Net P&L, Win Rate, Max Drawdown (with how long it took to recover) and Expectancy per trading day - and the full set underneath:
| Metric | What it tells you |
|---|---|
| Avg Day P&L | Total net P&L divided by the number of days tested |
| Best Day / Worst Day | The single best and worst day. If one day is carrying the whole result, you want to know |
| Profit Factor | Everything the winning days made, divided by everything the losing days lost. Above 1 means the winners outweigh the losers |
| Avg Win Day / Avg Loss Day | The average size of a good day and a bad day. Premium selling usually shows lots of small wins and a few big losses |
| Return / MDD | Total net P&L divided by the max drawdown. A rough "how much pain per unit of profit" read |
| Max Win Streak / Max Loss Streak | The longest run of consecutive winning and losing days, which is what you'd actually have had to sit through |
| Total Expiries / Avg Expiry P&L | How many distinct expiries you traded, and the total divided by that. Useful when you care about the cycle rather than the day |
| Avg Yearly P&L | The total scaled up to a calendar year. If you tested 3 months and made 30,000, this reads about 120,000. It's arithmetic, not a forecast |
| Total Costs / Gross P&L | What commissions and slippage took in total, and what the same trades would have made without them |
Equity tab
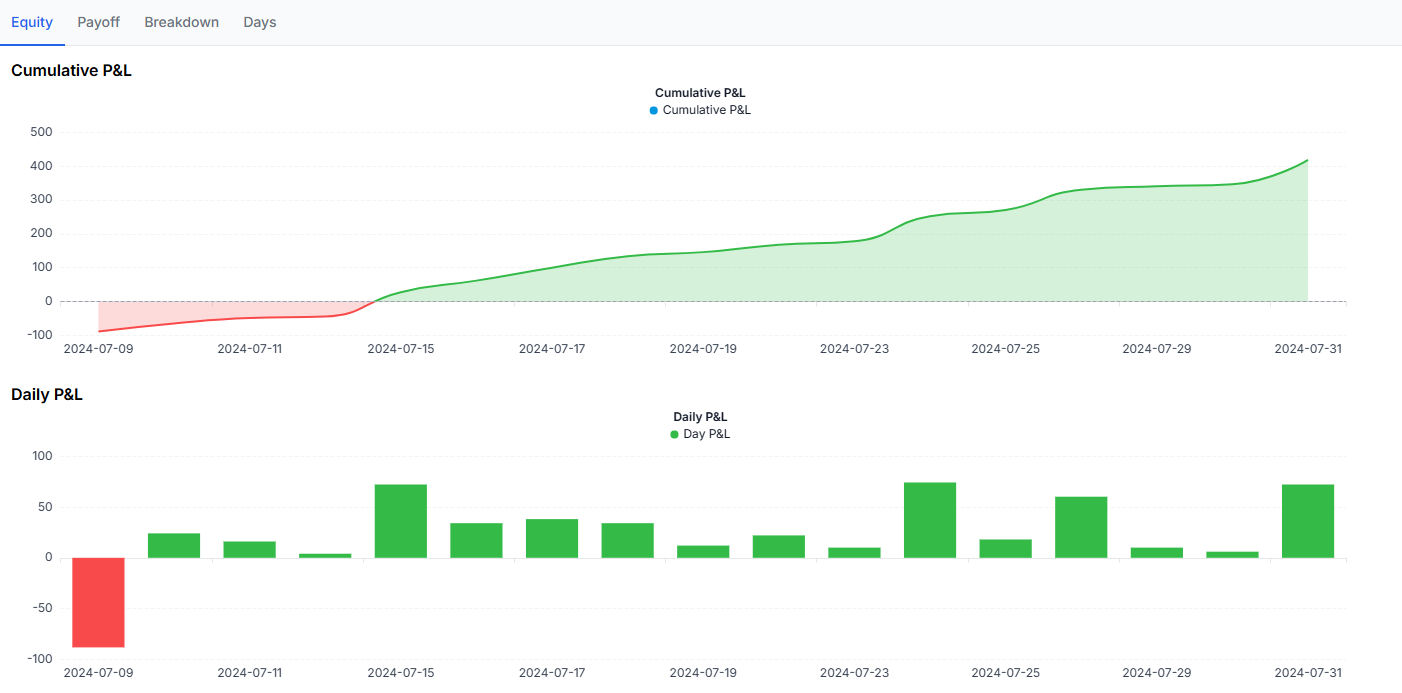
Cumulative P&L across the range, with the daily bars underneath. The bars are usually where the strategy's real character shows up - a smooth staircase with the occasional cliff is the classic premium-selling signature.
Payoff tab
These two charts are the ones we're most pleased with, because they only become possible once you have hundreds of days of real results.
First, the realized payoff curve: every day's actual P&L plotted against how far the underlying moved that day. A normal payoff diagram is theory - it shows value at expiry assuming nothing else changes. This one is built from real fills, so decay, volatility and everything else that really happened is already baked in. It's the payoff the strategy actually delivered rather than the one it promised on paper.
A short straddle should give you a tent shape - profitable when the underlying barely moved, losing at both extremes. If yours doesn't, that's worth investigating before you go any further.
Second, the average running P&L through the day: the mean open P&L at each point of the session across every day tested. This answers something a single-date tool never can, which is when your strategy actually makes its money.
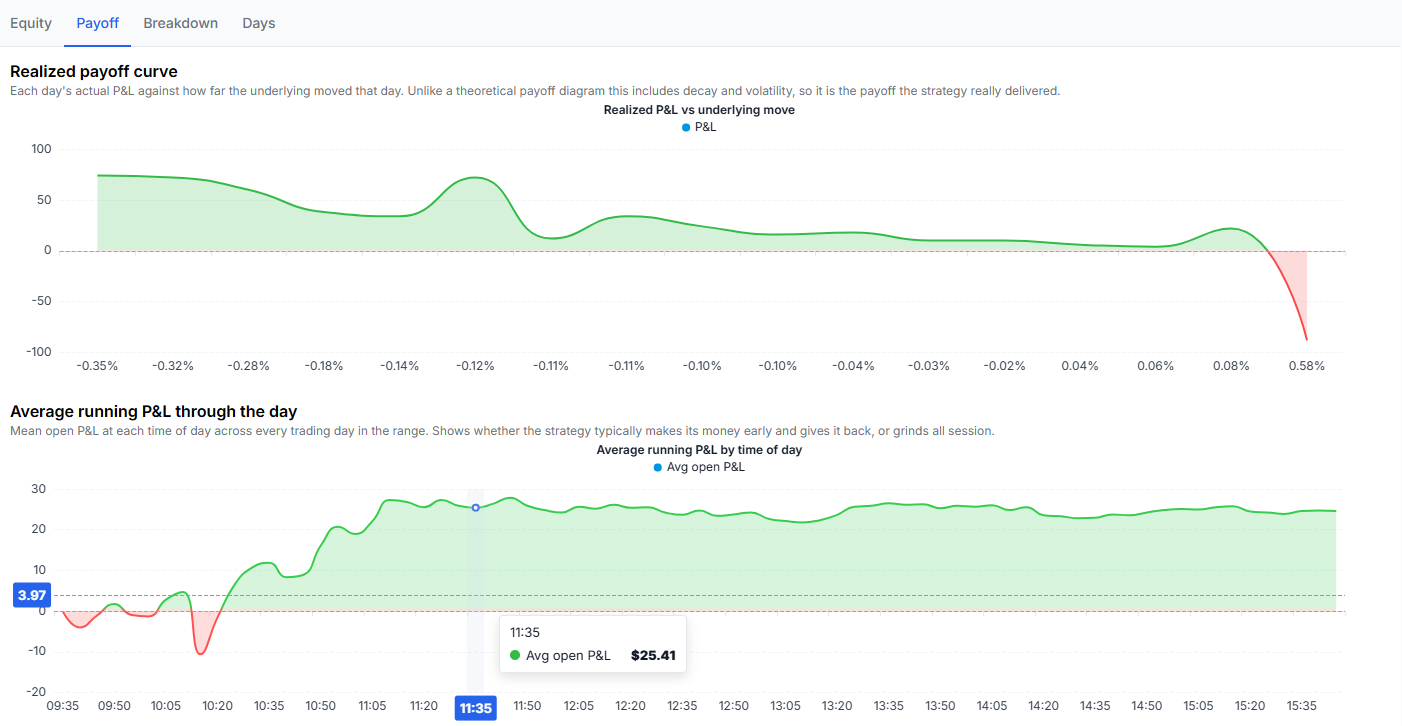
If it climbs all session, holding to your exit time is doing real work. If it peaks at 11:30 and drifts lower, you've just found a reason to exit earlier - and you can test that idea immediately by changing the exit time and re-running, which costs nothing because the prices are already cached.
Breakdown tab
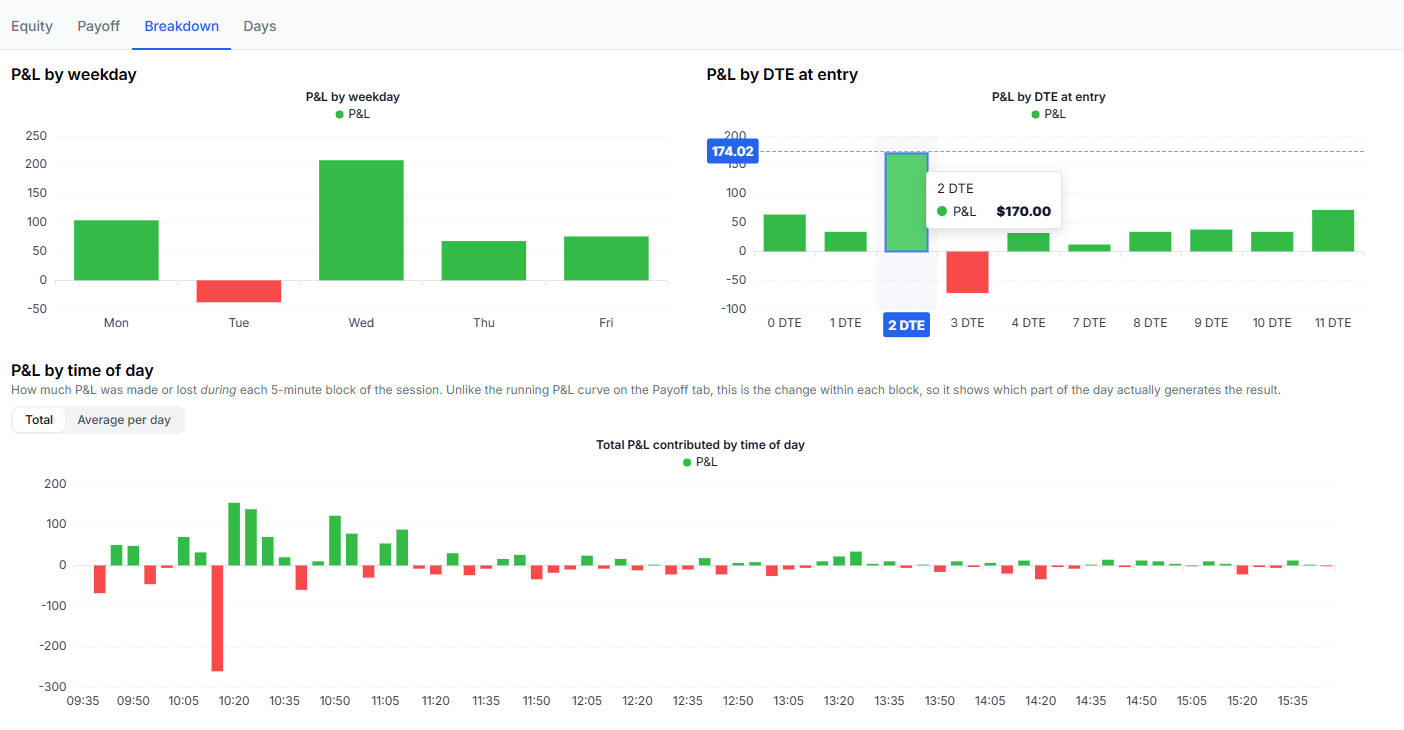
- P&L by weekday - the classic expiry-day question. Whatever you learn here, feed it straight back into the Days pills.
- P&L by DTE at entry - whether your edge is really in 0DTE or further out.
- How days ended - how many days finished at your exit time, on a leg stop, on a leg target, or on an overall MTM rule. If your stop loss never fired, it wasn't doing anything and your results are identical without it.
Days tab
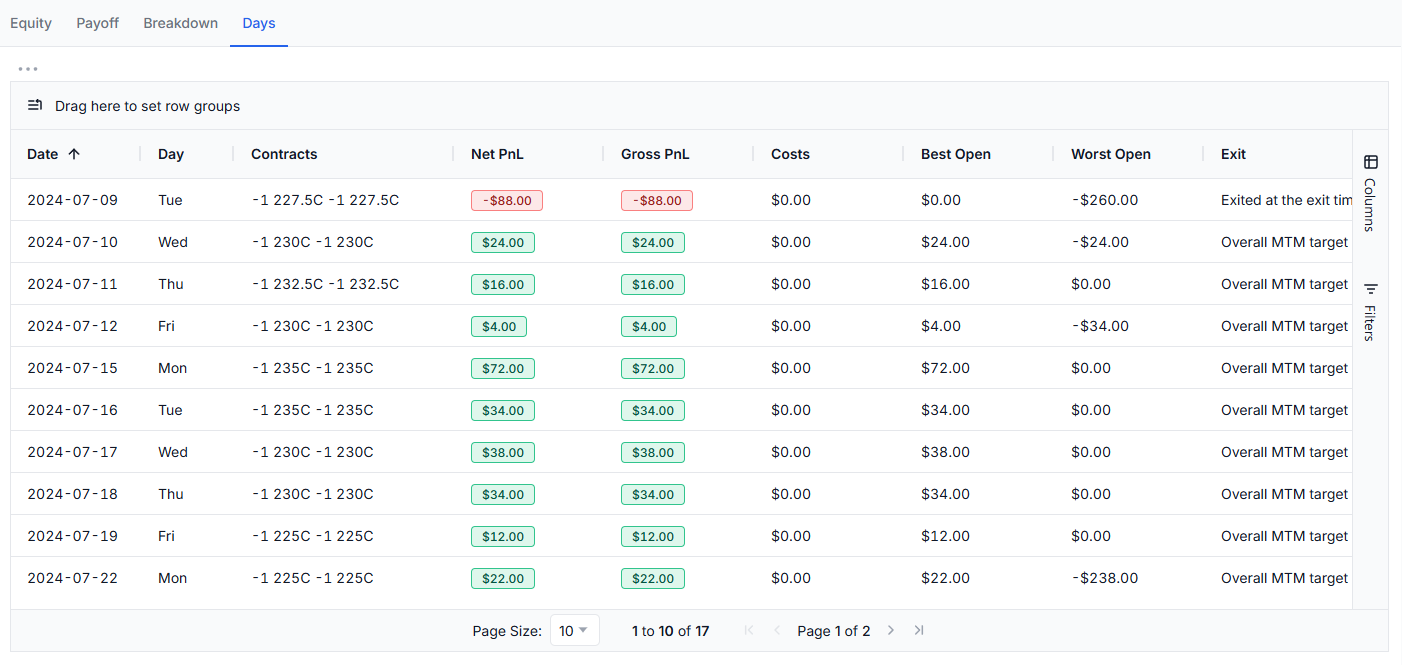
Every day laid out, with the exact contracts traded that day, gross and net P&L, costs, the best and worst open P&L during the session, and how the day ended. Export CSV gives you all of it for your own analysis.
This is also your audit trail. If something upstream looks off, come here and check what was actually traded on the day in question.
Send the whole backtest to a trading account
A backtest tells you whether a rule worked. It doesn't tell you how that rule would have sat inside your account, next to everything else you trade. So there's an Add to trading account button at the top of the Days tab that turns the run into real trades in TradesViz.
Pick one trading account in the account filter at the top of the page, click the button, confirm, and the whole run lands in that account.
Each day becomes its own trade
This is the part worth understanding. If your backtest covered 22 trading days, you get 22 separate trades, not one big one.
That's deliberate. Each day in a backtest is an independent session: you open at your entry time and you're flat by your exit time. Bundling a month of those into a single trade would average them into one blob and throw away the day-level detail, which is the whole reason the backtest exists. Keeping them separate means every per-trade feature in TradesViz works on them normally - win rate, expectancy, R-multiples, the calendar, tags, notes, the works.
Each leg gets a proper entry and exit execution, so a four-leg iron condor over 22 days becomes 22 trades with 8 executions each.
It respects whatever you've filtered the table to
The Days table is a normal TradesViz grid, so you can sort and filter it. Whatever rows are showing when you click the button are the days that get added.
Say your Breakdown tab showed that Mondays were the problem. Filter the Days table to everything except Monday, click Add to trading account, and only those days go across. Same trick for "only the winning days" or "only the days that ended on a stop". The confirm box tells you how many days it's about to add, so you can double check before committing.
The costs come across too
The P&L on the imported trades matches the net P&L the backtest reported, not the gross. Commission lands in the commission field on each execution, and slippage is baked into the fill prices, because slippage isn't a fee - it's you getting a worse price. Leave that out and every imported day would quietly look better than the backtest said it was.
Two things to keep in mind
- These are simulated fills, not real ones. They're priced from historical last-traded marks. Adding them to an account you also use for real trades will mix the two together, so a lot of people keep a separate account for this. You can create one in seconds from your account settings.
- Times are stamped at exchange time, converted to UTC. A 09:35 entry on an SPX strategy is 09:35 in New York, which is what gets stored. If your display timezone is somewhere else, the trade will show your local equivalent of that moment, which is correct even though the number looks different from what you typed. The duration stays the same either way.
Example 1: the NIFTY short straddle
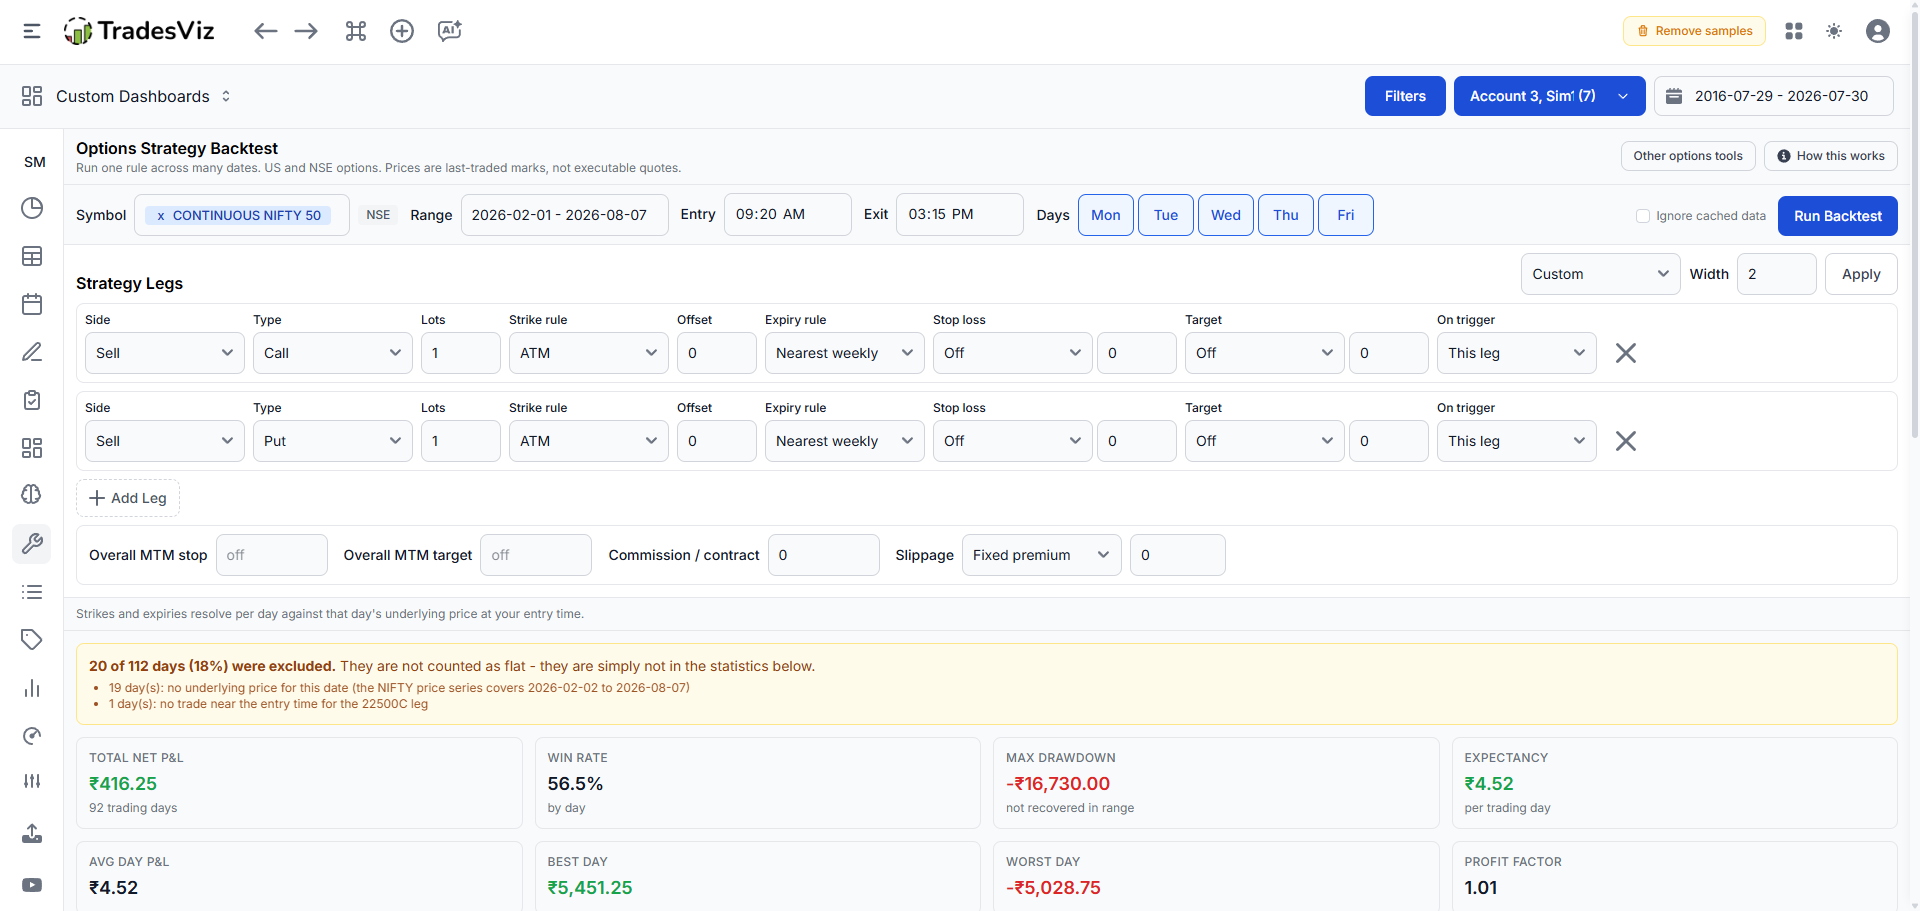
Probably the most-tested options strategy in India. Sell the ATM call and ATM put at 09:20, close at 15:15, every day.
- Search for NIFTY50. The badge shows NSE and the times default to 09:20 / 15:15.
- Set the range to the last 6 months.
- Pick the Short Straddle template and click Apply. You get two legs: sell call ATM, sell put ATM, both on the nearest weekly.
- Run Backtest.
 |
 |
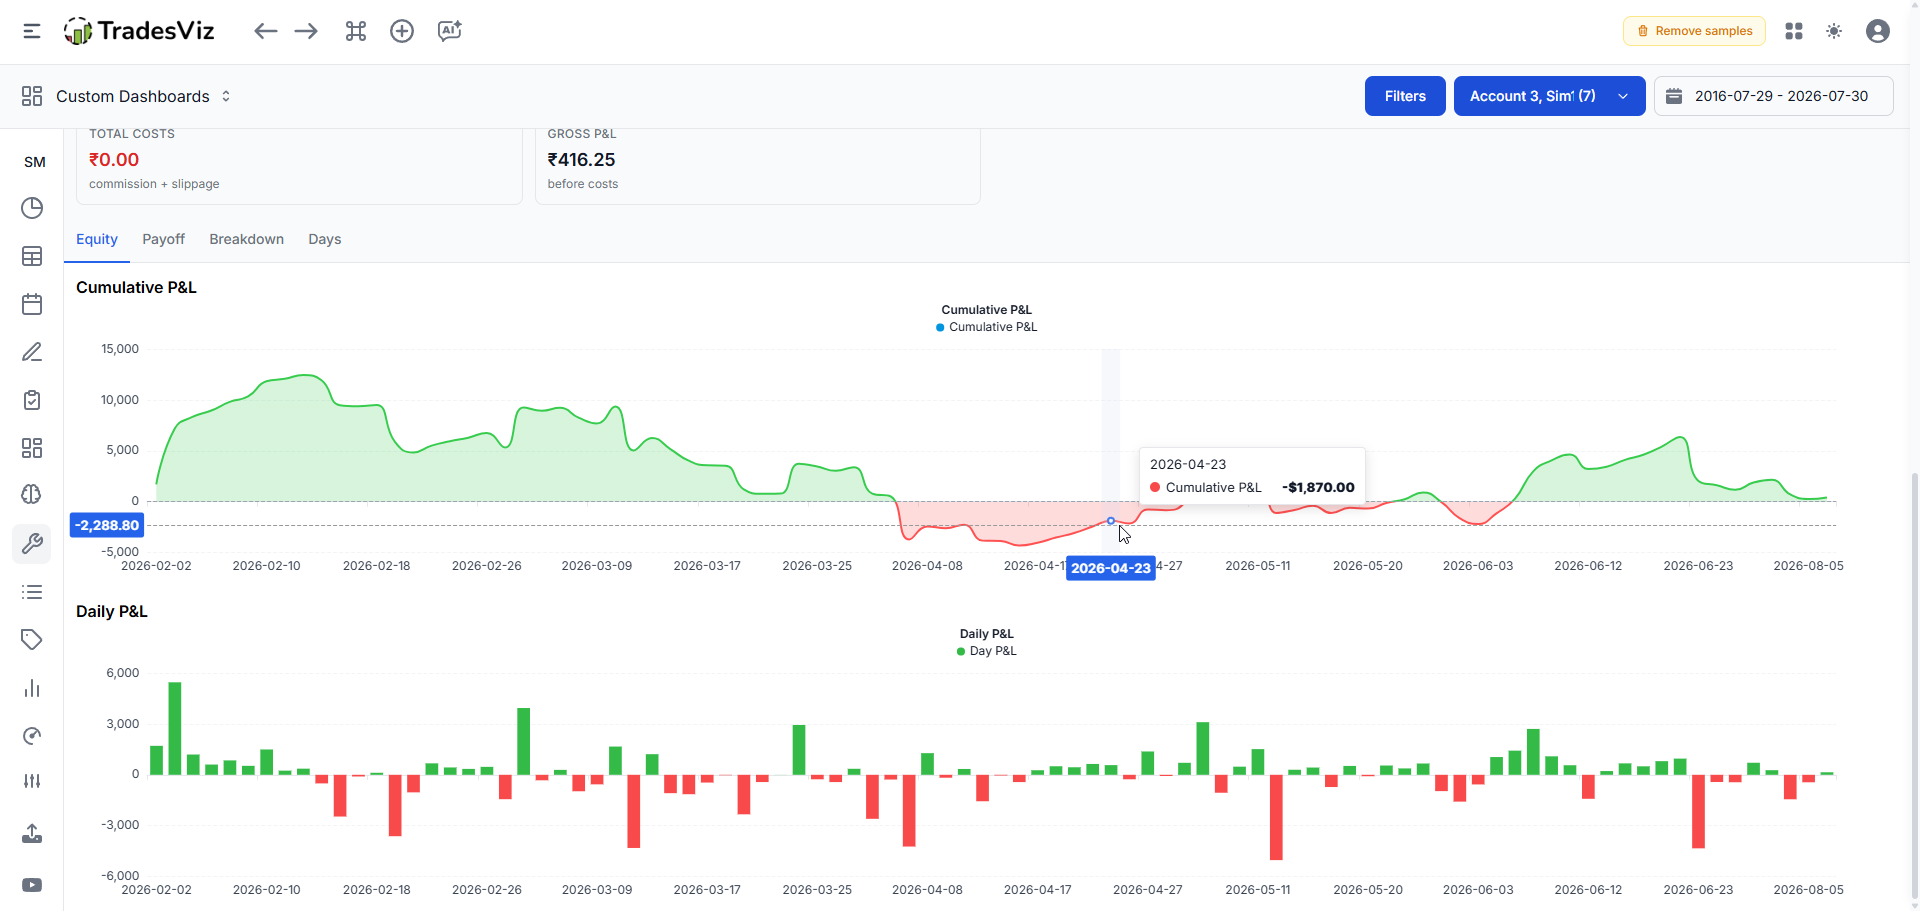
Here's where it gets interesting. Add a 25% Stop loss to both legs, set On trigger to "All legs", and run it again. It's instant, since no new data is needed. Now compare: did the stop cut the drawdown by more than it cost you in total P&L? Check the exit-reason counts to see how often it actually fired. Then try 40%, then 15%. This is the kind of question that used to take a spreadsheet and a weekend.
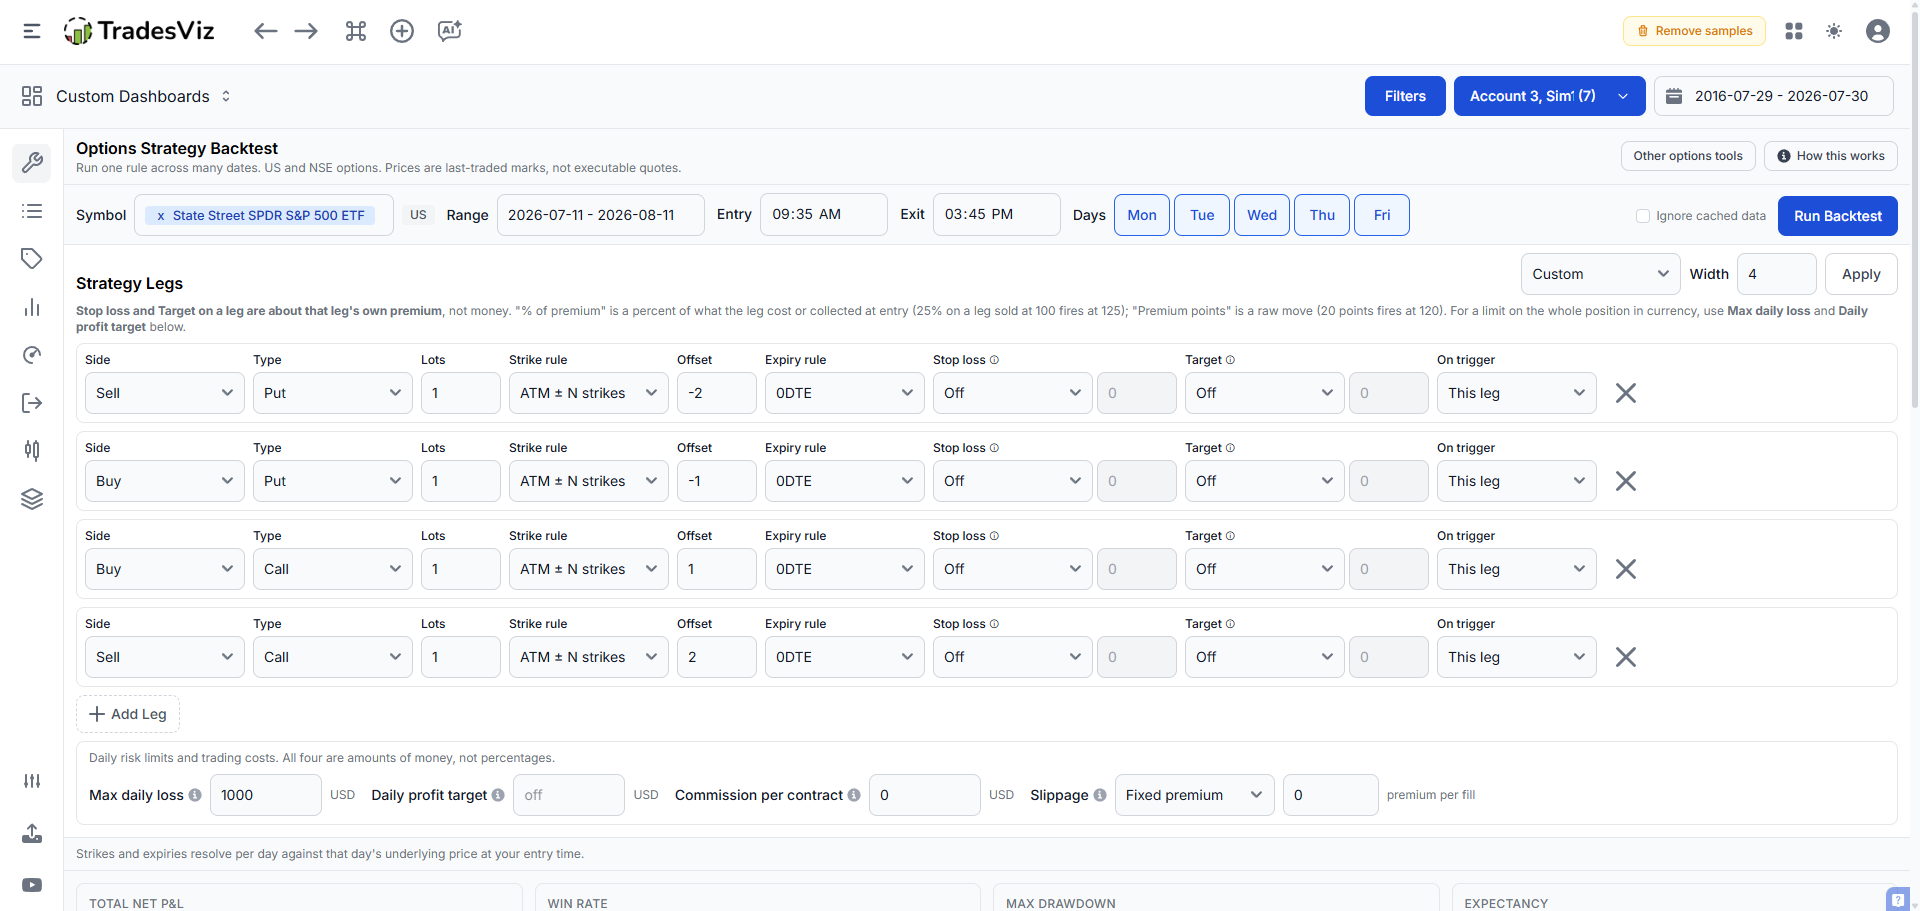
Example 2: an SPY 0DTE iron condor
- Search for SPY (or SPX (GSPC)). The badge shows US.
- Pick the Iron Condor template, set Width to 4, click Apply.
- Set every leg's Expiry rule to 0DTE.
- Entry 09:45, Exit 15:45.
- Set a Max daily loss so one bad day can't run away from you.
 |
 |
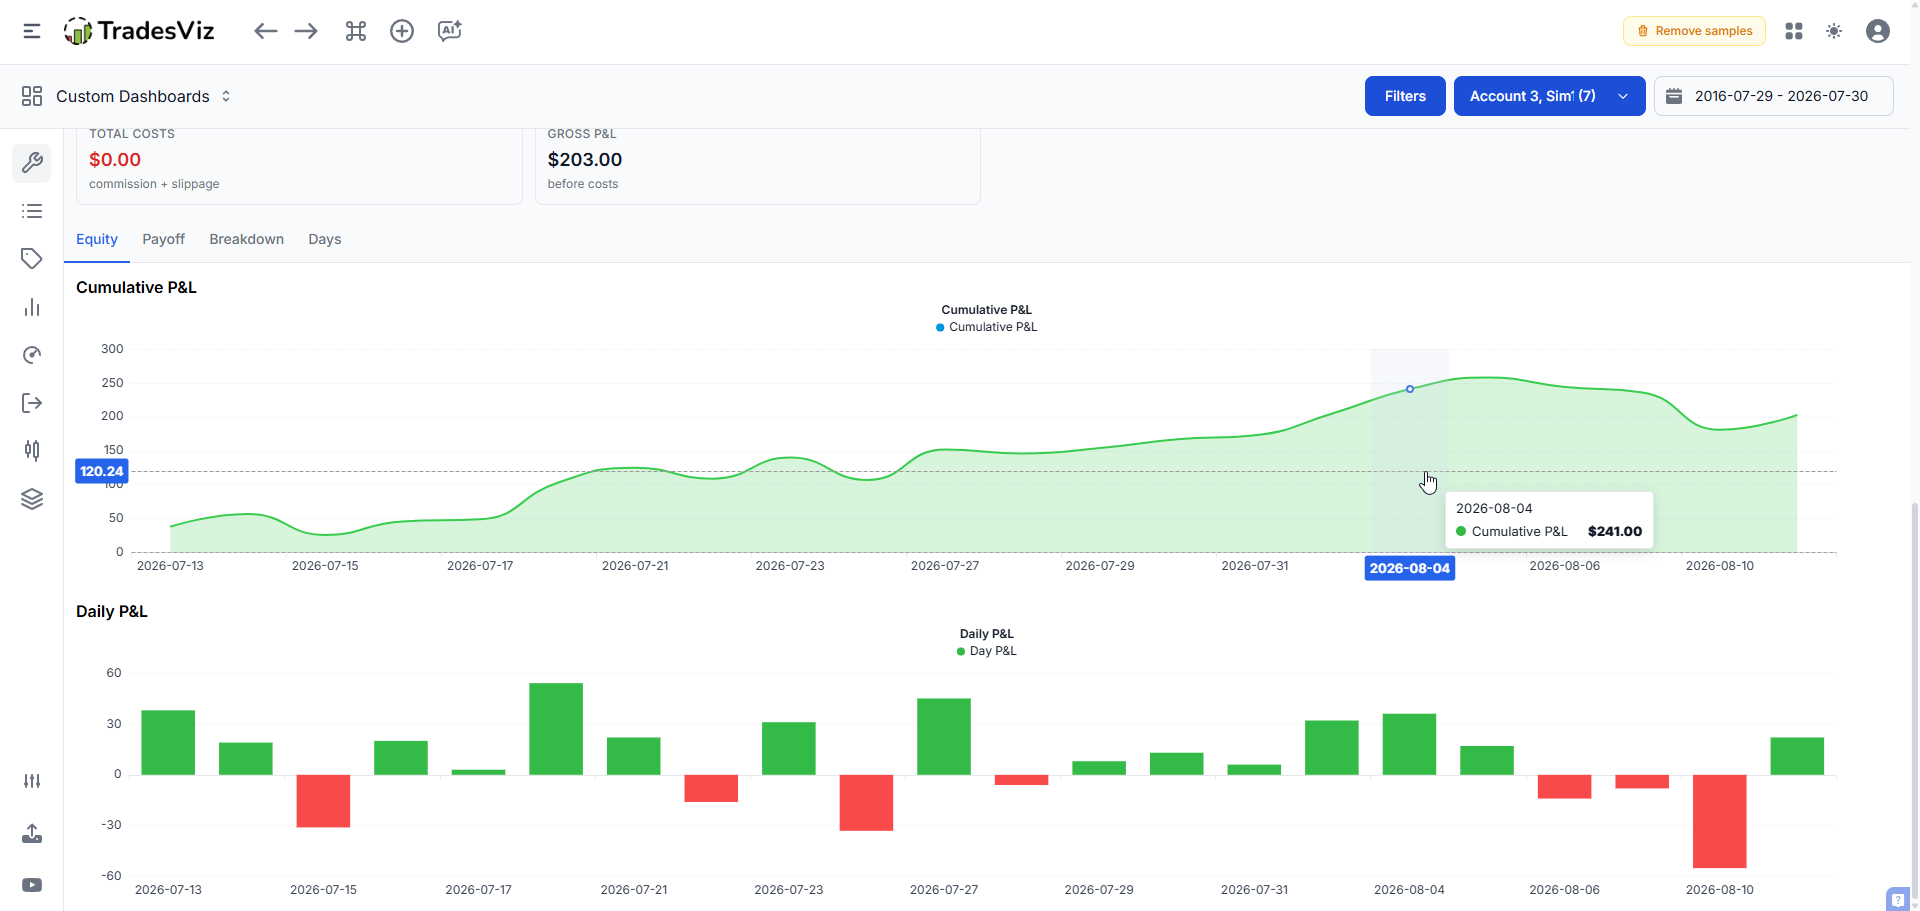
Then head to the Payoff tab to see where the wings actually got tested, and the Breakdown tab to check whether the losses cluster on particular weekdays.
Example 3: finding a better exit time
Take any strategy that's working and look at the average running P&L chart. Find the point where the curve flattens out or turns down, change your Exit time to roughly there, and re-run. If net P&L improves and drawdown falls, you've found something worth keeping. If it only improves because of a handful of days, you've found noise - and the Days tab will show you which days those were.
How it works under the hood
We'd rather you understand the mechanics than take our word for it, so here's what's happening on each day:
- ATM comes from the underlying's own price at your entry time, resolved separately for every trading day. Not from the chain, not from the previous close, and not from the exit-side price.
- Expiries come from what was genuinely listed on that date, not from a calendar rule. If an expiry didn't exist that day, it can't be picked.
- Entry is the first print at or after your entry time. A resting order at 09:20 gets filled by the next trade, so that's what we use rather than some stale earlier mark.
- Within a bar, a stop loss is applied before a target. When a bar crosses both, treating it as the loss is the conservative reading. Doing it the other way round is one of the easiest ways for a backtest to flatter itself, and we'd rather not.
- Days with missing leg data are excluded and counted, never treated as flat.
- Prices are last-traded marks, not executable quotes. That's what the Slippage control is for - use it.
What's not in there yet
This is the first release, so a few things are still on the list:
- Each trade is intraday. To be clear, your date range can be as long as you like and every trading day in it gets tested - but each of those days is a separate trade that opens at your entry time and closes at your exit time on that same day. Carrying a position overnight, or holding one all the way to expiry, isn't supported yet.
- No trailing stops or re-entry. Per-leg stops, targets and overall MTM rules are in. Trailing and re-entry are next.
- Strike selection by premium or delta isn't here yet. Closest-to-premium selection already exists in the Option Execution Simulator if you need it today.
- One strategy at a time. Comparing several side by side is planned.
The four options tools, and when to use each
- Options Strategy Backtest (this one) - does this rule hold up across many dates?
- Option Execution Simulator - what happened to this one position, minute by minute?
- Options Chain Simulator - can I practice trading a past session as it unfolds?
- Options Payoff Chart - what's the theoretical payoff and risk of this structure?
FAQ
Which markets and symbols are supported?
Both US and NSE options. The symbol search only suggests symbols that actually have options data, and we work out the market from the symbol you pick, so there's nothing extra to configure.
How far back can I test?
As far back as our options data goes for that symbol. If your range reaches past what we hold, the backtest tells you the exact dates it can cover rather than silently returning partial results.
Why were some days excluded from my backtest?
A day is excluded when at least one leg had no traded data near your entry time, or when there's no underlying price for that date. We show the count, the share of the range and the grouped reasons, and we never count an excluded day as a flat day.
Are commissions and slippage included?
Yes, both. Commission is per contract and charged on entry and exit; slippage can be a fixed premium amount or a percent of premium, also on both sides. You can see gross and net side by side, and changing either re-prices instantly.
Does it use real historical option prices?
Yes. Every leg is priced from actual historical options trades, not from a model. They're last-traded marks rather than executable quotes, which is why the slippage control is there.
Can I test stop losses and profit targets?
Yes, at two levels, and they use different units. Per leg, a stop or target is either a percent of that leg's own entry premium (25% on a leg sold at 100 fires at 125) or a number of premium points (20 points on that leg fires at 120). Max daily loss and Daily profit target apply to the whole position added together and are amounts of money, not percentages - enter 5000 and the day ends when the combined open P&L hits minus 5,000. You can also choose whether a triggered leg closes on its own or takes the whole structure with it.
Why did a day lose more than my Max daily loss?
Because a stop can only act on a price the market actually printed. We check your open P&L on every 1-minute mark and exit at the first mark that's already past your limit, so if the position was fine one minute and down 240 the next, the day closes at 240. Watch the contract multiplier too: SPX options are 100x, so one point of premium is 100 of P&L and a 100 limit is a one-point stop that a 0DTE bar clears easily. When this happens the results page reports how many days ended on the stop and by how much they went past it.
How is the P&L added up across days?
Each day is worked out on its own (all legs added together, then commissions and slippage subtracted), and Total Net P&L is the plain sum of those daily results. Nothing is compounded or reinvested, and the equity curve is a running total of that sum rather than an account balance. Max Drawdown is therefore a currency amount, not a percentage.
Does the backtest scale position size as the equity curve grows?
No. Every day trades the same number of lots you set on the legs, so what you see is the raw shape of the strategy rather than the result of a money-management scheme on top of it.
Does Win Rate count days or individual legs?
Days. A day counts as a win when its net P&L after costs is above zero, regardless of how the individual legs did. Expectancy and Avg Day P&L are the same number here, since every day is one equally sized trade.
How is ATM decided for each day?
From the underlying's own price at your entry time on that specific day, then snapped to the nearest listed strike. Every relative strike rule (ATM +/- N strikes, percent or points) is measured from there.
Why is my second run so much faster than the first?
We cache option prices per day. Re-running the same range, or changing rules and costs, uses the cached prices and doesn't refetch anything. Extending the range only pulls the new days.
Can I export the results?
Yes, the Days tab has an Export CSV button that gives you every day with its contracts, gross and net P&L, costs and exit reason.
Give it a try
The Options Strategy Backtest is live now on the Platinum plan for both US and NSE options. Our suggestion for a first run: pick a template, use a 3-month range with no stops to get a baseline, then add one rule at a time and watch which ones actually move the numbers. You'll learn more from five quick iterations than from one elaborate setup.
As always, let us know your feedback and ideas by emailing us at [email protected]. Trailing stops, re-entry rules and multi-day holds are already on the roadmap, and what we build first depends a lot on what you tell us you're trying to test.