Your stats don't tell you what to fix next. Your AI Coach should.
TradesViz has always given you the raw material to find your edge: MFE/MAE charts, exit analysis, tag groups, seasonality, R-value statistics, and dozens more. The problem most traders run into is not lack of data. It's the opposite. You log in, you see 200 charts, and you don't know which 3 things are actually costing you money this month.
That's the gap we built the AI Coach Trading Review to close. It's live on the Overview tab for every Pro and Platinum account, and as of this update it now ships with sixteen detectors, statistical significance gating, per-variant feedback, and trend arrows that show whether each leak is getting better or worse since your last review.
Why we built a separate Trading Review (and not another "AI" chat box)
We already have AI Daily Insights, AI Chat, AI Notes. Those are great for asking open-ended questions and summarizing a session. They're not the right tool for the specific question we kept hearing in support tickets:
"What is the single biggest thing hurting my P&L right now, and where do I go to fix it?"
That question has a deterministic answer. It doesn't need a chatbot. It needs well-defined statistical checks run against your trades, ranked by dollar impact, with each finding linked to the right tab and filter inside TradesViz. So that's what Trading Review is.
- It runs on the same filters and account selection you already have applied on the Overview tab.
- It's fast: every result is cached against your filter and account, so re-opening the tab is instant.
- It's quiet by default: the panel is collapsible, sits below your stats, and remembers its state across sessions.
- It's deterministic: the cards are computed from your trades, not generated text. The optional AI narration sits on top, not underneath.
- It's statistically honest: every comparison is gated by a proportion z-test, and weak signals get marked as "low statistical confidence" instead of shown as headline leaks.
Most importantly, this is NOT a dump of your trading data into an LLM to get hallucinated results. That's what every other competitor advertises as "AI" feature. We've been doing things differently since 2023 (way before the other competitors even knew about AI in journaling...). Our focus is on useful metrics applicable for a wide variety of traders and in many different scenarios. Likewise, this AI coach is also engineered to track trends and only show you the statistically relevant insights - it may not be the ones you want to see, but these are the ones that will help you get better.
Where to find it
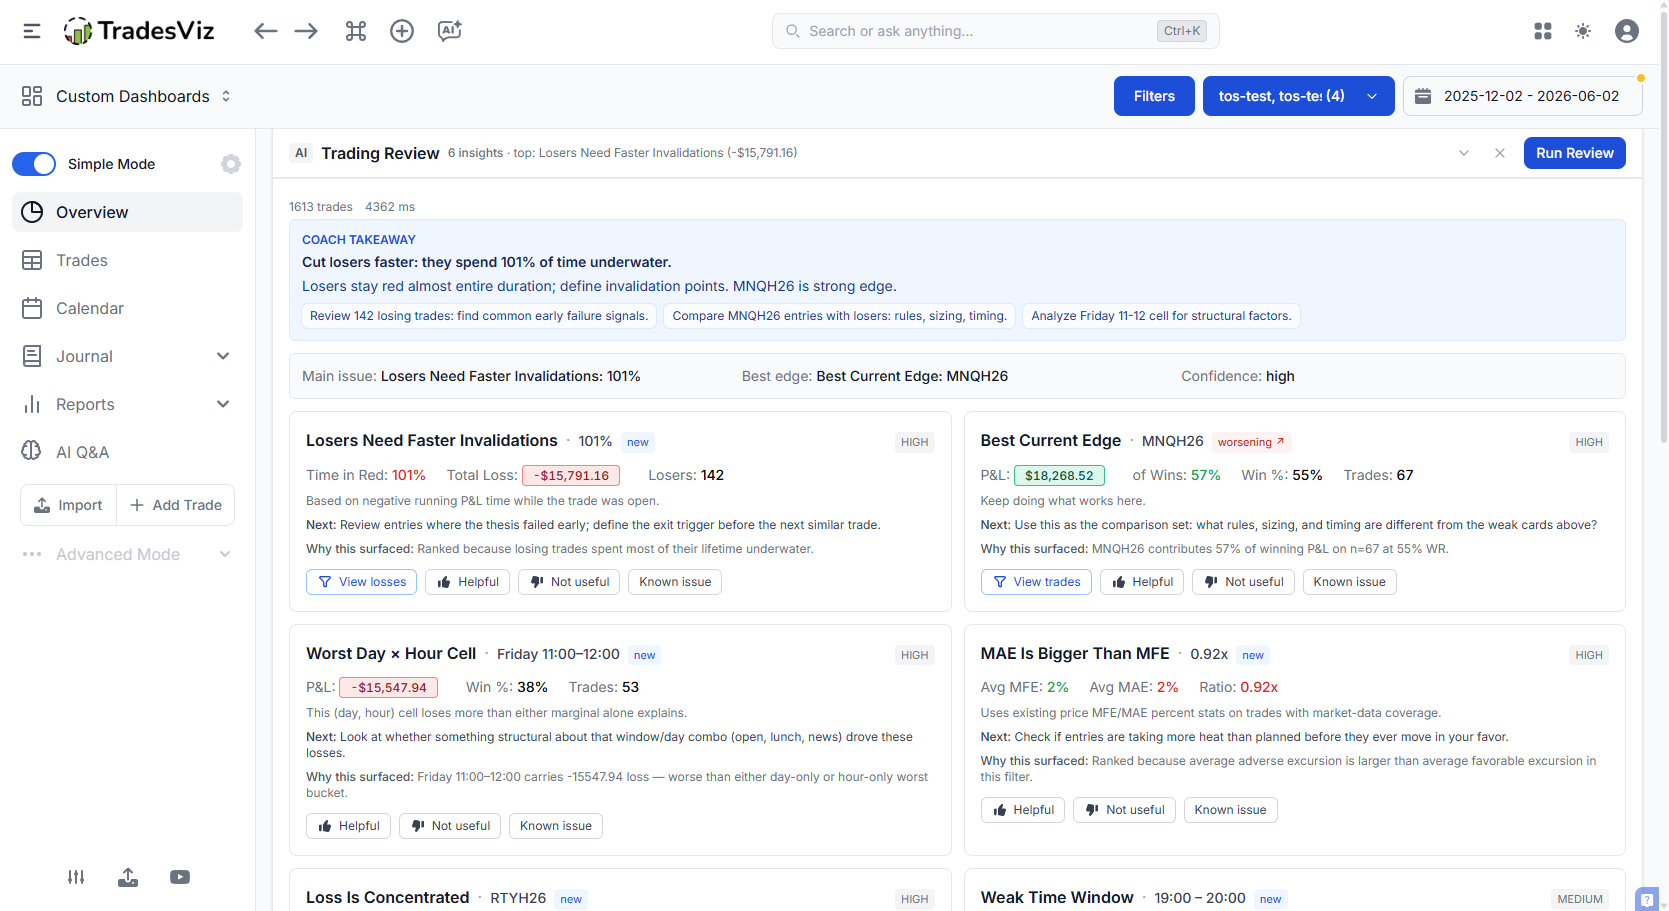
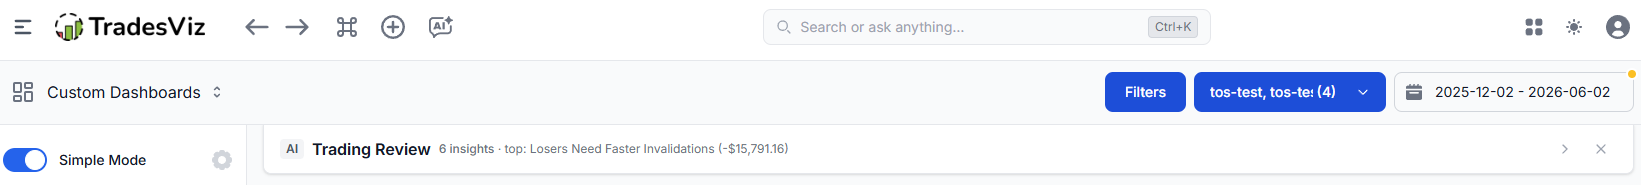
Open Overview tab. Right below the filters button, there's a new Trading Review panel. Hit Run Review the first time. After that, it loads from cache until you change a filter or import new trades.
If you don't want to see it, collapse it. The state is stored locally in your browser, so it stays collapsed on every Overview tab until you open it again.
The sixteen checks the AI Coach runs
Each check is a small, focused statistical detector that asks one question about your trades. We picked these because they map directly to the most common, most expensive, and most fixable mistakes we've seen across hundreds of thousands of trades on the platform. You'll never find any other tool that has this level of surgical precision when it comes to trading analysis. All of this is derived from talking to trades every day, running 100s of experiments, and from more than a decade of advanced data anlaysis in academia.
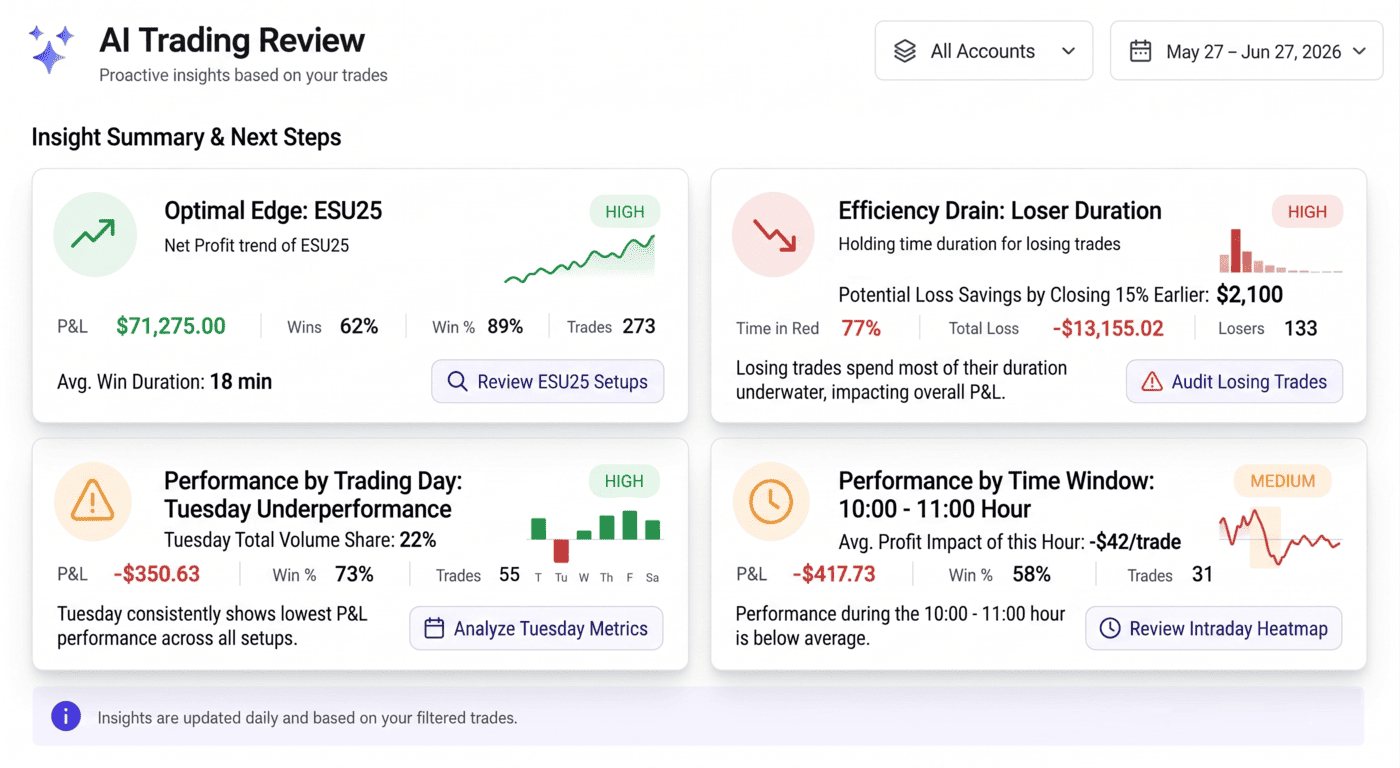
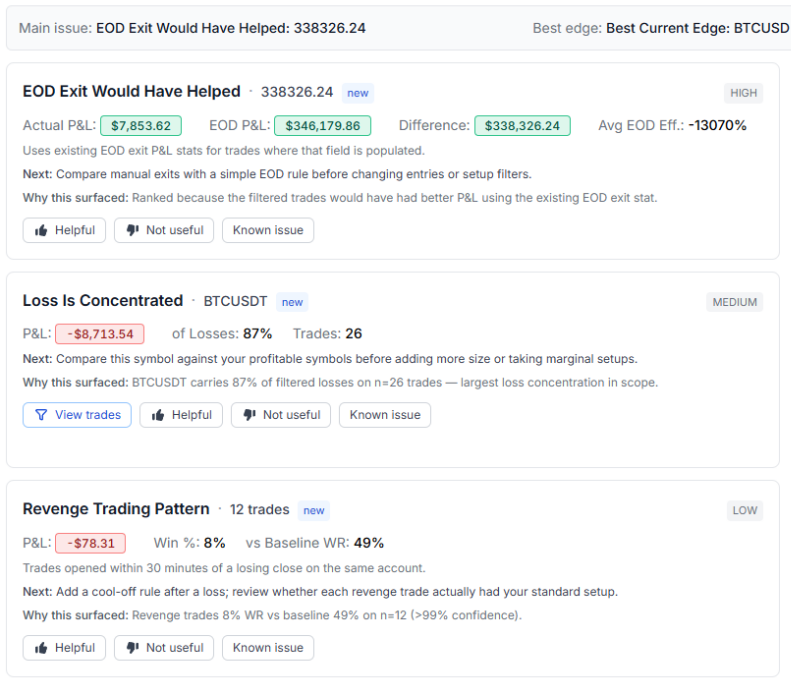
Every card shows you four things now:
- What the pattern is, in plain English.
- What it cost you, in dollars or R, over the current filter window.
- Why we surfaced it: the exact bucket, sample size, and statistical confidence behind the finding. No more wondering whether a card is real or a coincidence.
- Where to investigate it, with a one-click link into the relevant TradesViz tab with filters pre-applied.
Risk & execution
1. Risk/Reward Leak. Compares your average win against your average loss. If your winners are systematically smaller than your losers across a meaningful sample, this card surfaces the exact ratio (for example, 1.8×) and the dollar amount you'd keep if your average loser matched your average winner.
2. Losers Took Extra Heat. Looks at adverse excursion on losing trades. If you're consistently letting losers run far past your planned invalidation before exiting, this detector flags the average extra heat and the dollar cost of that drift. This is the single most damaging pattern in most accounts and it's ranked accordingly.
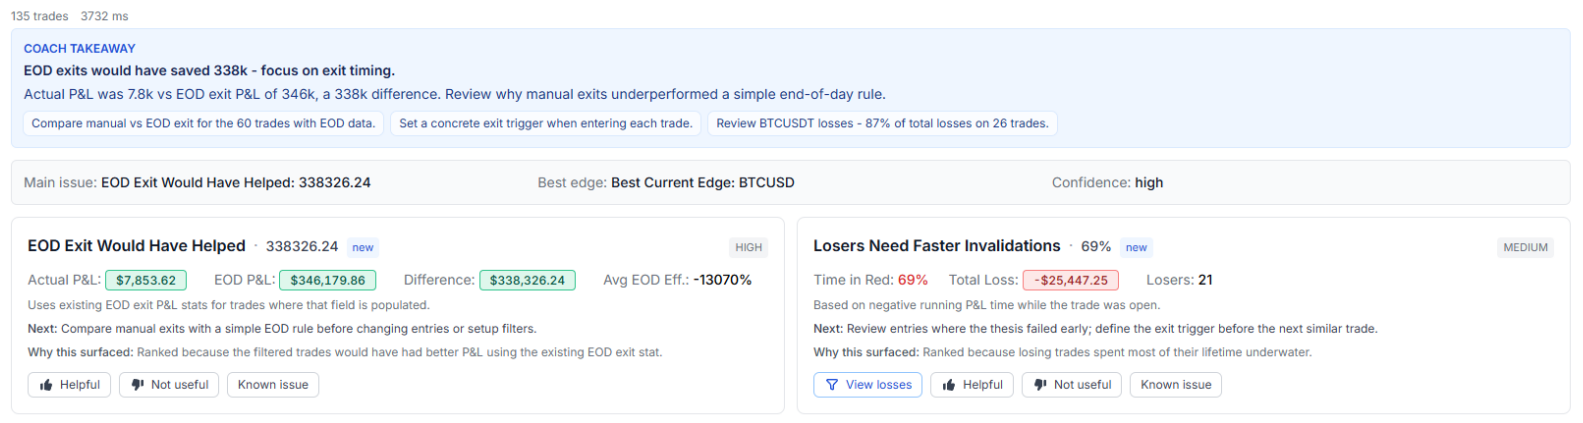
3. Losers Need Faster Invalidations. Looks at how long you hold losers underwater before closing. If the average losing trade spends most of its lifetime in the red, the card calls it out and points you at the exact symbols and tags where the drag is worst.
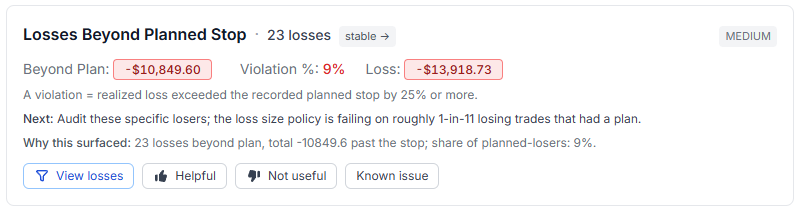
4. Losses Beyond Planned Stop. Uses your recorded planned-loss field. A "violation" is a losing trade where the realized loss exceeded the plan by 25% or more. The card shows how many violations you had, the total dollars past the stop, and what share of your planned-losers actually breached.
5. Winners Need More Room. The mirror image of card 3. If your winners are being closed well before their best available exit on average, you're cutting them too early. This detector quantifies the leave-on-the-table number and shows the symbols where it's worst.
6. EOD Exit Would Have Helped. For day trades, this detector simulates what your P&L would have looked like if you'd closed every position at a fixed end-of-day time. If a flat-by-X rule would meaningfully improve your equity curve, the card surfaces the lift in dollars.
7. MAE Is Bigger Than MFE. Looks at the average maximum favorable excursion versus the average maximum adverse excursion across your trades. If your trades show more downside heat than upside reach on average, your stops and targets are misaligned with your actual entry edge. The card tells you by how much.
Behavioral patterns
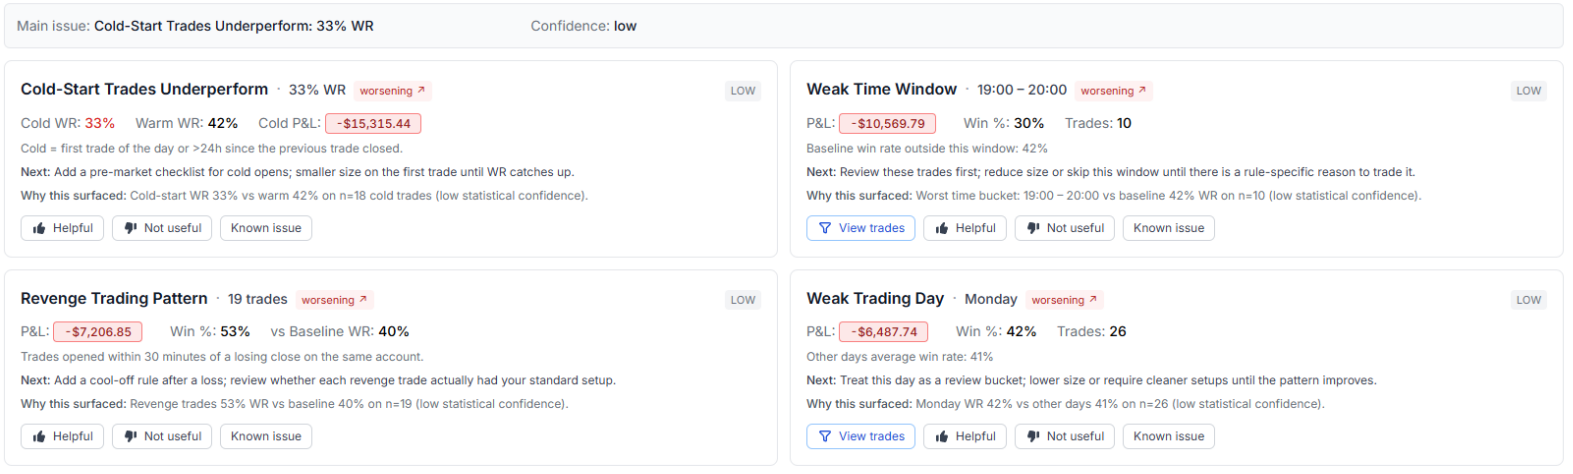
8. Revenge Trading Pattern. Flags trades opened within 30 minutes of a losing close on the same account. Compares the win rate of those "revenge" trades against everything else. If the cohort meaningfully underperforms and is net negative, it surfaces with the dollar damage attached. Most traders are surprised how big this number is the first time they see it.
9. Size Increases After Losses. Classic martingale risk. Compares the average position size on trades immediately following a loss against the average size after a winning trade. Fires when the post-loss size is at least 1.25× the post-win size and that bucket is losing money. The note on the card calls out that size is measured by trade quantity (not notional dollars).
10. Cold-Start Trades Underperform. Splits your trades into "cold" (>24 hours since the last close on the account — e.g. after a weekend or days off) and "warm" (a trade within 24 hours of the previous one). If your cold-start win rate is materially worse and the cold cohort is net negative, the card surfaces. Typical fix: a small, structured first trade or a pre-market checklist.
Timing & context
11. Weak Time Window. Slices your P&L by hour of day. If there's a specific window where your expectancy is consistently negative with a large enough sample, the card surfaces the time range, the win rate inside it, and the dollar impact.
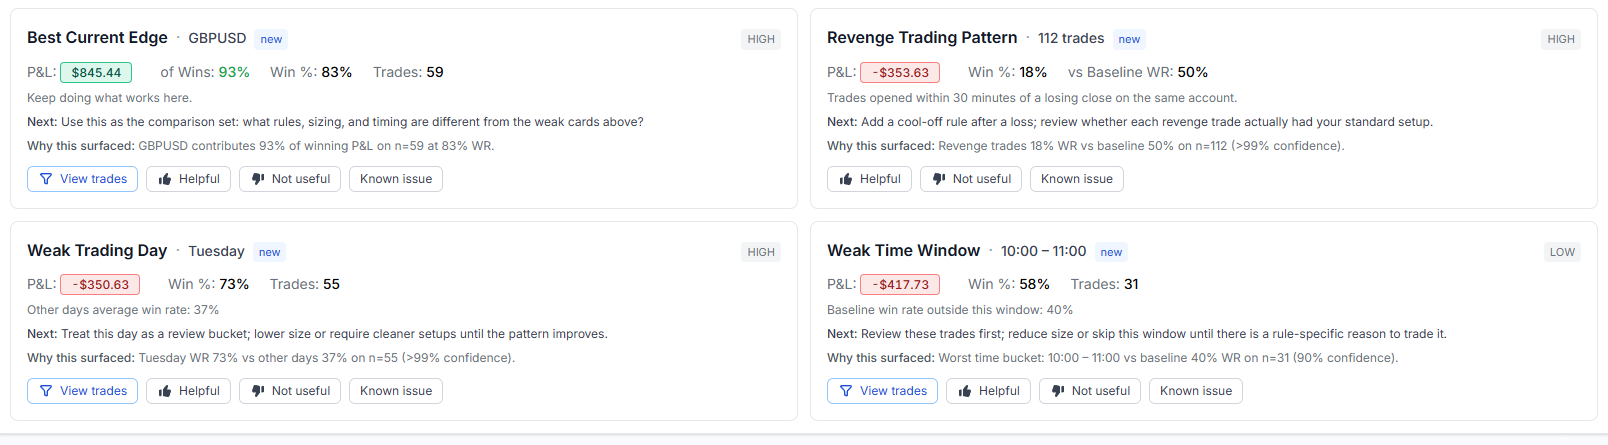
12. Weak Trading Day. Same idea, different axis. If a specific weekday is dragging your average, the card tells you which day, the win rate there versus the rest of the week, and the dollar drag.
13. Worst Day × Hour Cell. (New.) Sometimes neither "Mondays" nor "10am" looks bad on its own, but Monday at 10am is the actual sink. This 2-D detector finds (day, hour) cells whose losses are materially worse than either marginal alone can explain.
14. High-News Days Underperform. (New.) Tags every trade whose open day contains a tier-3 ("high") event from the TradesViz economic calendar and compares the win rate of news-day trades against the rest. If you're consistently worse on news days, the card surfaces with the dollar impact.
Focus & edge
15. Loss Is Concentrated. Identifies whether a single symbol is responsible for an outsized share of your losses. If 30% or more of your red ink comes from one ticker, the card names it directly with a one-click filter to those trades.
16. Best Current Edge. The positive card in the set. It identifies the symbol where your expectancy is currently strongest and where you have enough sample to trust it. Most traders find this card more useful than they expect: it's a reminder of what's actually working before they go chase something new.
Statistical significance gating: no more "72% vs 70% baseline" cards
Every detector that compares one bucket against another (weak day, weak hour, revenge cohort, cold cohort, news cohort) now runs a two-proportion z-test against the pooled baseline before it's allowed to claim a meaningful difference.
The confidence chip on each card reflects that test:
- High is shown when the test passes at p < 0.05 with a large enough sample.
- Medium is shown when the effect is at p < 0.10, or when the sample is mid-sized.
- Low is shown when the effect is real but the sample is thin, or when the difference isn't statistically robust.
The "Why this surfaced" line on each card now ends with the actual confidence tag, so you can read it at a glance:
Tuesday WR 73% vs other days 37% on n=55 (95% confidence).
This kills a class of bad cards we used to see: a bucket that looked bad in raw terms but didn't actually differ from the baseline once you accounted for sample size. Those still surface if the dollar number is large, but they show up as low confidence and get downranked accordingly.
Trend arrows: is each leak getting worse or fixing itself?
Every time you run a review, the coach quietly stores a fingerprint of each detector's impact. The next time you run it, each card carries a trend pill next to its title:
- worsening ↗ : the leak got bigger since your last review. Worsening cards are boosted in the ranker so they bubble to the top.
- improving ↘ : the leak shrank. Still shown, but downranked so it doesn't crowd out new problems.
- stable → : roughly the same size as last time.
- new : this is the first time this detector has fired for you in the trend window.
The trend is scoped to your trading account, not your filter. That's on purpose: switching between "last 30 days" and "year to date" shouldn't reset the history of how a leak has evolved. The fingerprint store is kept for 60 days, which is long enough to back the resurface rule below.
How does the AI Coach decide what to show?
Each detector returns a finding with several attributes attached: the dollar impact, a confidence weight (derived from sample size and the significance test above), a fixed detector weight that reflects how actionable that pattern usually is, a trend multiplier, and a boost based on how many times you've marked similar findings as "Helpful" in the past.
The ranker scores every finding with this formula:
score = abs(pnl_impact) * confidence_weight * detector_weight * (1 + helpful_boost) * trend_multiplier
Then it runs a diversity pass. Cards are grouped into timing, focus, risk, execution, excursion, exit_plan, behavioral, and edge. The ranker picks the top-scoring card from each group first, then fills the remaining slots by raw score. You'll see at most four cards per review, and any detector with a sample size under 10 trades is suppressed completely.
This is deliberate. We don't want a review that lists ten different things to fix. We want the four highest-leverage moves you can make right now, drawn from different categories so you don't get four flavors of the same finding.
How does feedback change future reviews?
Every card has three feedback buttons: Helpful, Not useful, and Known issue.
- Helpful tells the system this finding landed. The detector also gets a small ranking boost on your future reviews (capped, so it can't lock the panel onto one detector).
- Not useful suppresses this specific finding from future reviews.
- Known issue also suppresses it - same effect as Not useful, different label for when you already know about the pattern and you're working on it.
The big improvement here is that suppressions are now scoped to the specific variant of a finding, not the whole detector. If you mark "Weak Trading Day: Tuesday" as Known issue, that hides the Tuesday card - but a future review can still surface "Weak Trading Day: Thursday" if that becomes the real leak. Same for symbols, hours, and (day × hour) cells. You're training the coach about this specific bucket, not muting the whole class of insight forever.
Auto-resurface after 30 days. Suppressions don't live forever. If the underlying pattern stops firing for 30+ days, the suppression quietly expires - so a leak you fixed two months ago doesn't stay hidden if it comes back. If the pattern is still there, the card simply re-suppresses itself on the next click.
The point of the feedback loop isn't a training signal for an opaque model. It's simple: stop showing you findings you've already actioned, promote findings you tell us are worth seeing, and bring things back the moment they actually matter again.
The optional AI Coach Takeaway
Above the cards, there's an optional one-paragraph Coach Takeaway. This is the only part of the review that's generated by an LLM (currently a low-cost model run server-side). It reads the same deterministic findings you see in the cards and writes a short, plain summary plus a three-item checklist for your next session.
A few important details:
- The narration cannot invent findings. It only summarizes the cards that the deterministic detectors already produced.
- If the LLM call fails or is disabled, the review still works. You just see the cards without the narrative paragraph on top.
- The narration is cached alongside the rest of the review, so it doesn't cost you a fresh model call every time you reopen the tab.
This is the right division of labor. The numbers come from your trades. The English on top is just there to glue them together for a fast read.
How is this different from AI Daily Insights?
Different tools for different jobs.
- AI Daily Insights is a session-prep tool. You give it a date and a lookback window, and it produces ten broad observations to read before the open. It's a briefing.
- Trading Review is a self-audit tool. It runs against your current filter and account on the Overview tab and tells you, in dollar terms, what's currently leaking and what to do about it. It's a diagnosis.
Most traders end up using both. Daily Insights before the market opens. Trading Review at the end of the week or month, when you're actually deciding what to change.
Performance, caching, and limits
A few things worth knowing about how it runs under the hood:
- The review runs as a background job, so the Overview tab never blocks while it's computing.
- Results are cached against your filter payload + trading account + engine version + suppression set + helpful votes. As long as none of those change, you're reading from cache. Vote on a card and the next view picks up the change immediately, no TTL wait.
- Bumping the engine version (when we ship new detectors or weight changes) automatically invalidates old reviews, so you don't have to clear anything manually.
- Trading Review is included with Pro and Platinum. There's no separate quota: the heavy lifting is the deterministic detectors, which run on your data with no external API cost.
- The optional LLM narration uses a low-cost model and is rate-limited to keep things sustainable. If you hit the limit, the cards still render normally.
What this fits into
Trading Review is the third leg of the "use your own data to get better" trio we've been building this year:
- Prop Firm Compliance keeps you inside your rules.
- Seasonality and Relative Volume tell you when conditions favor you.
- Trading Review tells you, against everything else you've already done, what to change next.
If you've been treating your journal as a place to log trades and walk away, this is the feature that turns it into something that actually pushes back.
FAQ
Do I need to do anything to enable it?
No. If you're on Pro or Platinum, open the Overview tab and click Run Review.
Does it work on filtered views?
Yes. The review honors every Overview filter: date range, tag, symbol, side, instrument type, custom filters. Change a filter, run the review again, get a different result.
Does it work across multiple accounts?
Yes. Each trading account gets its own cached review and its own trend history. Findings, scores, and trend arrows are all scoped per account.
What happens if I have very few trades?
Any detector with fewer than 10 trades in scope is suppressed. If you don't have enough data for any detector to fire, the panel will tell you so directly instead of inventing findings.
What does a "low confidence" tag actually mean?
It means the underlying statistical test (two-proportion z-test for win-rate detectors) didn't clear the p < 0.10 threshold. The pattern is real in raw dollar terms, but the sample isn't big enough to rule out noise. Treat it as a yellow flag, not a red one.
I marked a card as "Known issue." Will it ever come back?
Yes! Automatically if the underlying pattern stops firing for 30+ days and then returns. There's no setting to flip. The coach simply checks whether your old feedback is still relevant.
Does it send my data anywhere?
The deterministic detectors run entirely inside TradesViz. The optional Coach Takeaway paragraph is generated by a low-cost LLM running server-side, using only the already-computed card summaries (no raw trade rows). If you'd rather not use it, ignore it. The cards still work.
How often should I run it?
Weekly is plenty for most traders. Monthly is fine if you're a swing trader. Running it every day on a small sample isn't useful: the detectors need enough trades to be statistically honest.
The AI Coach Trading Review is live on Overview for every Pro and Platinum account today. We'll keep adding detectors as we find patterns that are common, expensive, and clearly fixable. If you have a pattern you'd like us to detect, or feedback on the current auto-detection patterns, tell us at [email protected].