We know that there are a lot of traders that focus a lot on Van Tharp's R-value. While we have a dedicated set of charts under the section "Performance metrics charts" > "General metrics". You learn more about it here: https://tradesviz.com/blog/new-performance-metrics/.
With this update, we are making it even easier for traders who care about R-values to do analysis. You can now turn almost ALL the charts in your dashboard to R-value based instead of PnL based with just a single click.
To do this, click on "Filters" at the top right corner and select "R-value" in the "Charts Statistics" section:
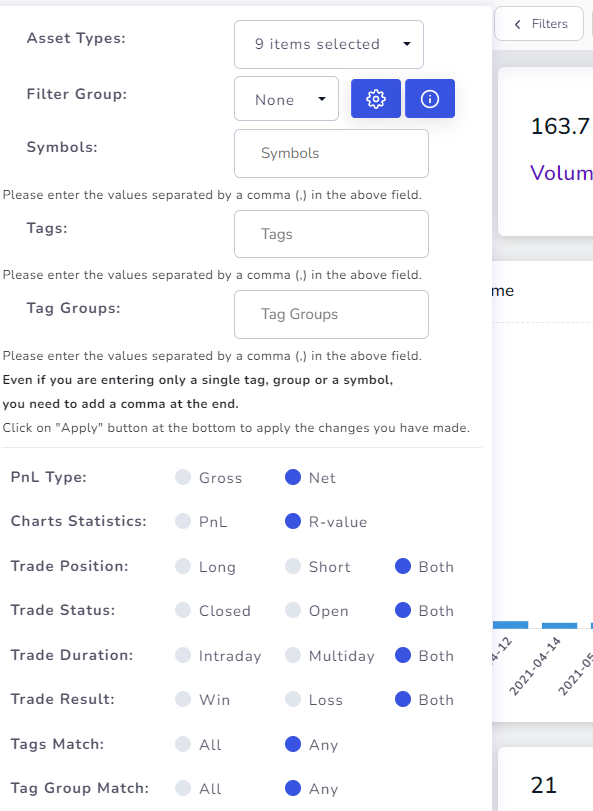
and that's it! Your main dashboard and all the PnL charts in the following sections will be changed to R-value based instead of PnL:
- Overview > Daily Statistics
- Trades Analysis Charts > Profit and Loss
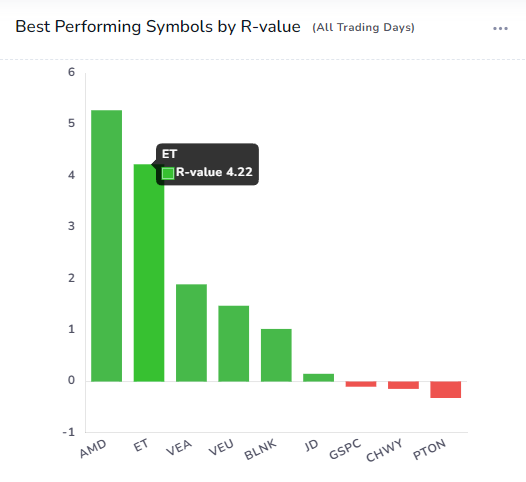
- Trades Analysis Charts > Symbols
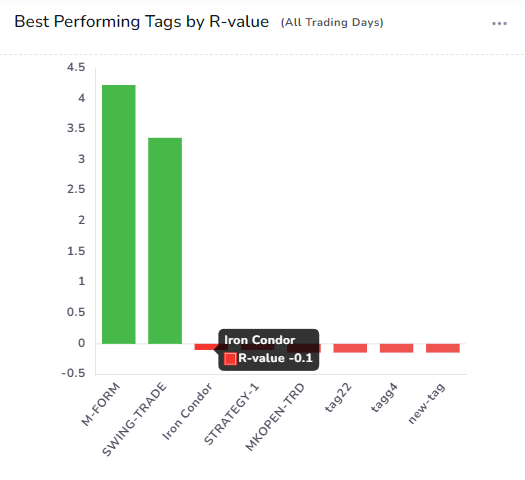
- Trades Analysis Charts > Tags
- Trades Analysis Charts > Symbol groups
- Trades Analysis Charts > Sectors
- Date Charts > Day-grouped Charts
- Date Charts > Calendar-grouped Charts
- Technical Analysis Charts > Market vs Indicator
- Technical Analysis Charts > Symbol vs Indicator
- Options Trades Analysis Charts > Profit and Loss
Important note: For these stats to show up and for the charts to populate, make sure R-value is present in your trades. For R-value to be calculated, you need to enter stop loss for your trades. You can do this very easily for a large number of trades by using group apply function or via the account settings to automatically add stop loss when your trades are imported.
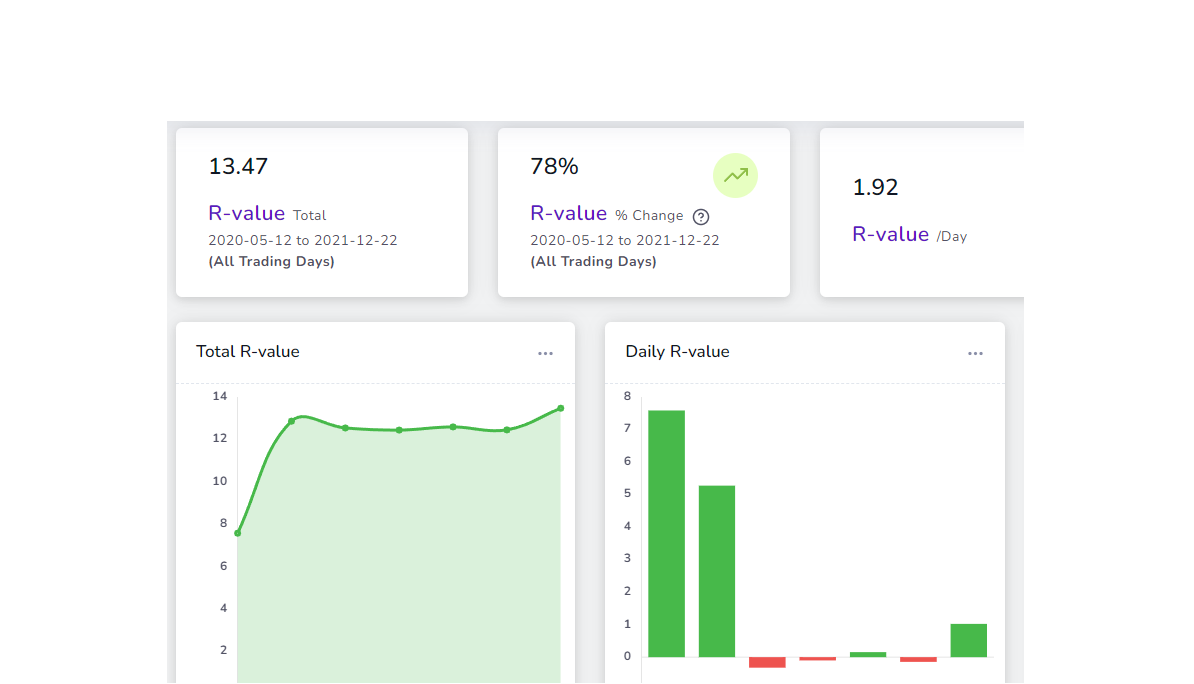
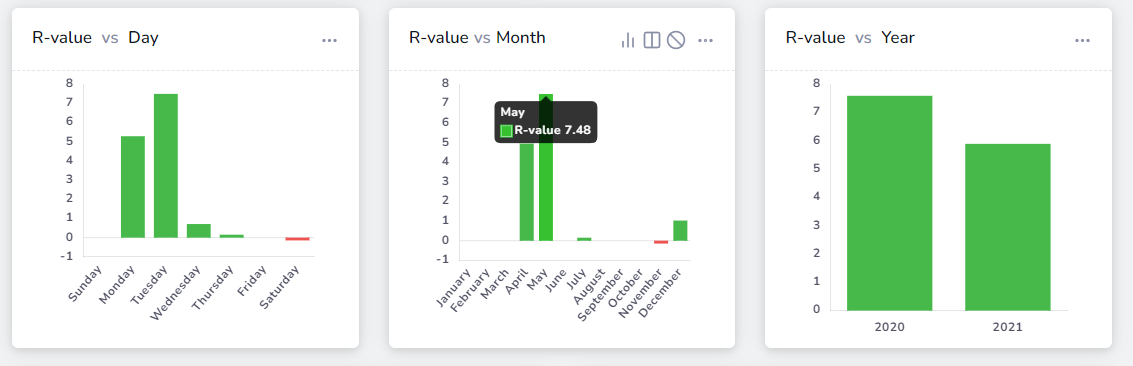
Here are some example charts with the R-value option toggled on:
Lot more features are coming soon! Stay tuned and sign up for a free account to receive discounts and the latest updates from TradesViz!
Have a feature request? Let us know by sending an email to [email protected]!