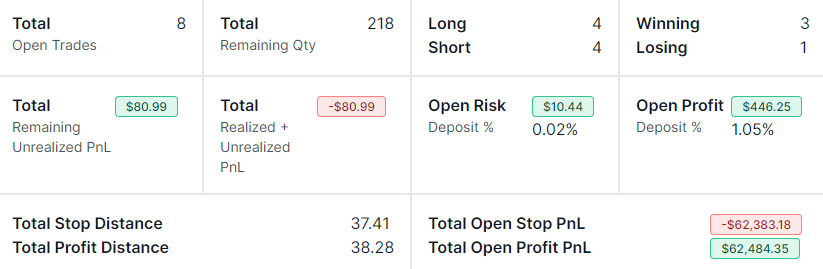
Most trading journals are built to answer one question: "how did I trade yesterday?" But if you are a swing trader or position trader holding trades for days, weeks or months, your most important questions are about right now: Where am I exposed? What is my unrealized P&L? What happens if every stop gets hit? And which positions need my attention today?
The Open Trades Summary tab in TradesViz - found under the "Summaries" section of your dashboard - is an open position tracker built to answer these four questions on a single screen. It is available to all TradesViz users on every plan, and it has been fully revamped into a position management command center for anyone managing multiple open trades: swing traders, options sellers, long-term investors and futures position traders alike.
Why swing traders need an open position tracker
When you hold 5, 20 or 100 open positions across accounts and asset classes, three things quietly go wrong:
- Risk goes unmeasured. You know each trade's stop, but not what your combined worst case is if the market gaps against everything at once - or how many positions have no stop at all.
- Exposure concentrates. A few adds later, one symbol is 40% of your book and you never made that decision consciously.
- Positions go stale. Options quietly march toward expiry, and that "two-week swing trade" is somehow 90 days old.
A broker statement won't tell you any of this across accounts, and a spreadsheet won't keep itself updated. A trading journal you actually use daily should do this work for you - which is exactly what this tab automates. Here is everything on the page and how to use it in your daily routine:
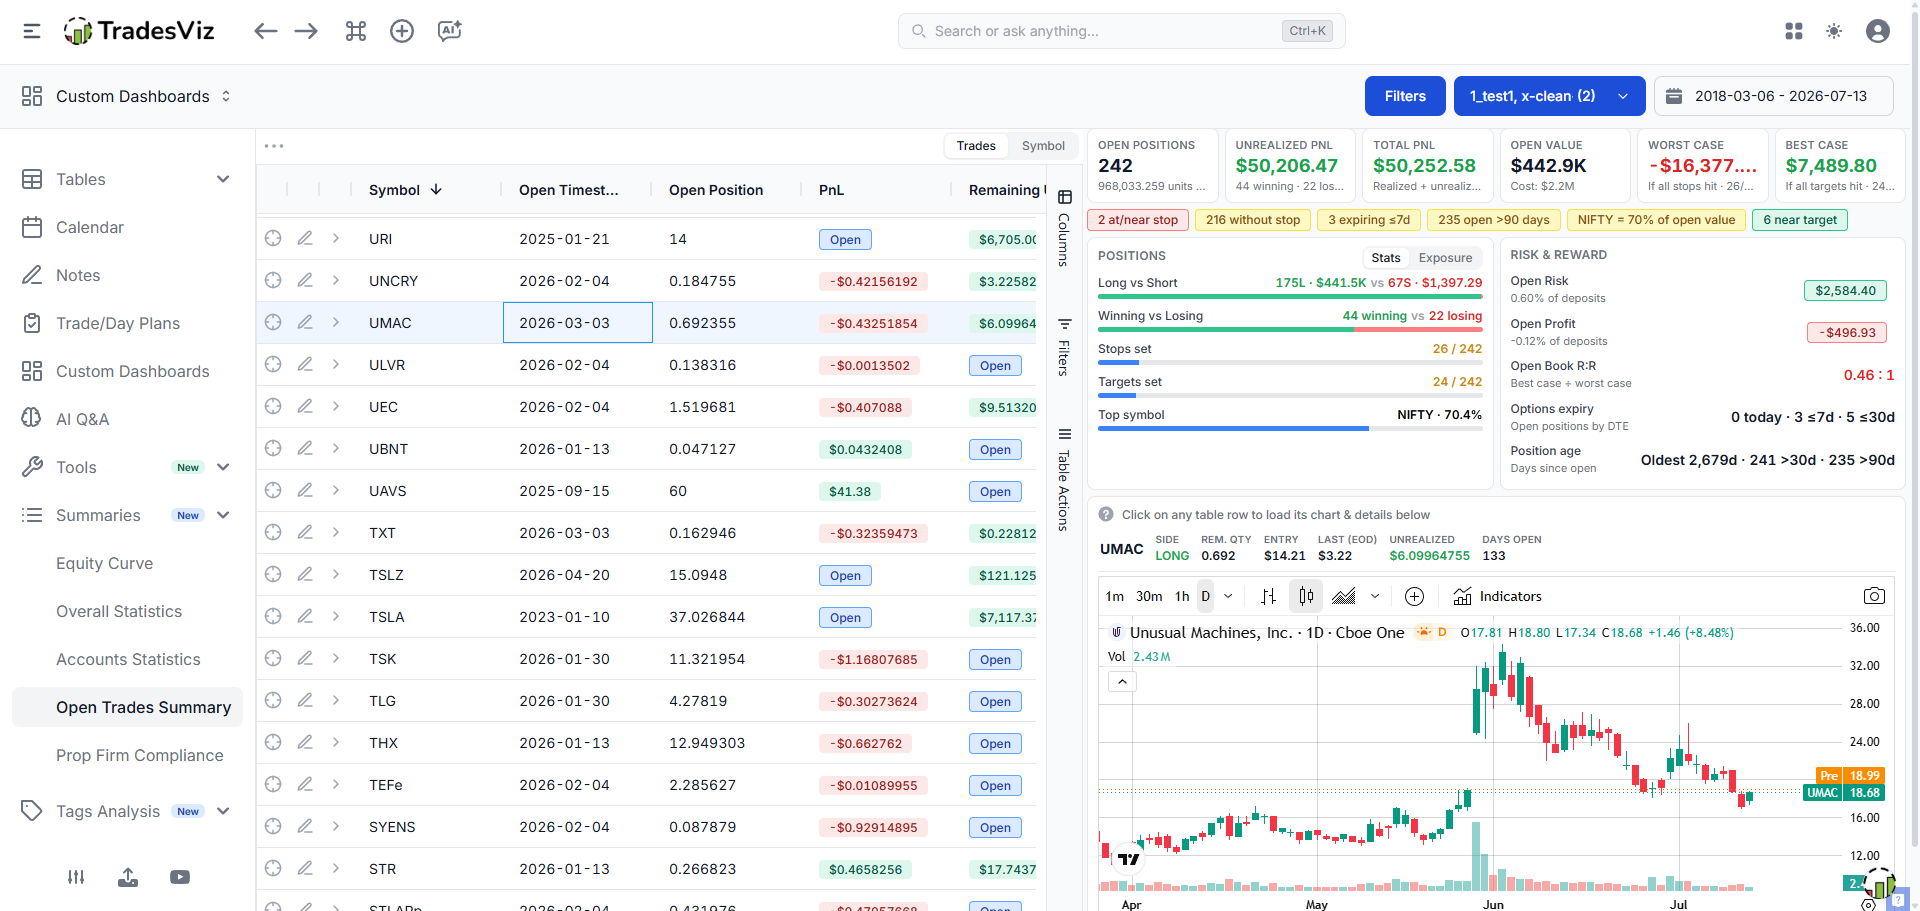
All your open positions in one table
The table on the left shows ONLY the open positions of all selected trading accounts. It is the same powerful trades table you know from the Tables tab - pre-filtered to open trades, with a default column set focused on unrealized PnL, risk stats, position value, and tags/notes.
You can switch the table between two views using the toggle at the top:
- Trades: one row per open trade.
- Symbol: open trades grouped per symbol - useful if you scale in and out with multiple trades on the same instrument.
As with all tables in TradesViz, you can filter, sort, search, re-arrange and hide/show any columns, and use all the normal grid/chart features. To save your layout, click the 3-dots icon at the top left corner of the table and click "Save State". The pencil icon on any row lets you add/edit notes and tags instantly - the fastest way to keep your trade management plan attached to each position.
Open position statistics: your whole book at a glance
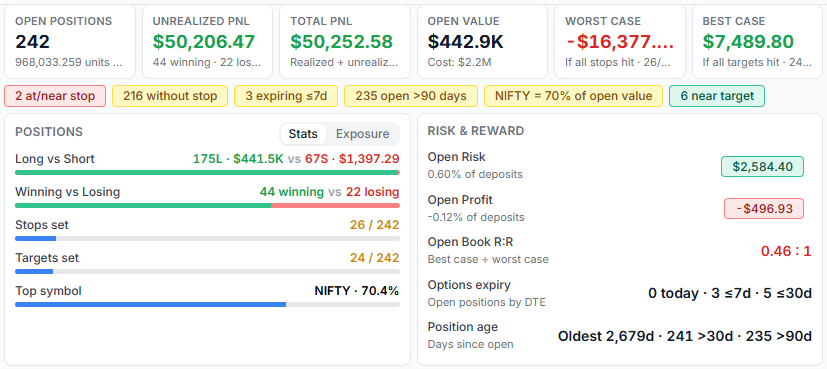
The six KPI cards at the top summarize your entire open book. Large values are automatically compacted (e.g., $10.7M) - hover over any value for the exact figure. Anything that cannot be computed (no stops set, no deposits recorded) shows a "—" with a tooltip explaining why, instead of a confusing blank or zero.
- Open Positions: trades that are not fully closed yet (open position > 0), with total remaining units and the long/short split below.
- Unrealized PnL: the PnL you would get on TOP of your already-realized PnL if you closed all remaining quantity right now, with the count of currently winning vs losing positions below. (Respects your global gross/net and R-value stat settings.)
- Total PnL: realized + unrealized PnL of all open trades combined.
- Open Value: the current market value of all remaining open quantity (falls back to total cost basis when EOD price data is not available), with total cost below.
- Worst Case: the hypothetical PnL on the remaining open quantity if every stop loss triggers - your "if everything goes wrong" number. The subtext shows how many positions actually have a stop set, so you always know how complete this number is.
- Best Case: the hypothetical PnL on the remaining open quantity if every profit target is reached, with target coverage shown below.
Note: worst/best case only include trades that have a stop loss / profit target set - the coverage counts (e.g., "14/34 set") tell you exactly how many trades are included. These values cover the remaining open quantity only; add the realized PnL of your open trades for the full "if all my stops/targets hit" total. If you don't set stops and targets on your trades yet, see our guide on stop loss & profit target profiles - it takes seconds per trade and unlocks all of the risk analytics below.
Automatic risk alerts: what needs a look today

Below the KPI strip is a row of colored chips that only appears when something actually needs your attention - think of it as an automated pre-market checklist for your open book:
- N expiring today (red): open option positions whose days-to-expiry (DTE) is today or already passed.
- N at/near stop (red): positions whose last EOD price is within 5% of - or already past - the stop loss.
- N without stop (yellow): open positions with no stop loss set. These are excluded from all risk stats, so this chip also tells you how "blind" your worst-case number is.
- N expiring ≤7d (yellow): option positions expiring within the next 7 days.
- N open >90 days (yellow): stale positions that may need a review.
- Concentration (yellow): shown when a single symbol makes up 25% or more of your total open value.
- N near target (green): positions whose last EOD price is within 5% of - or past - the profit target.
Hover over any chip for an explanation of how it is calculated. If nothing needs attention, the row simply disappears.
Position breakdown & risk/reward analysis
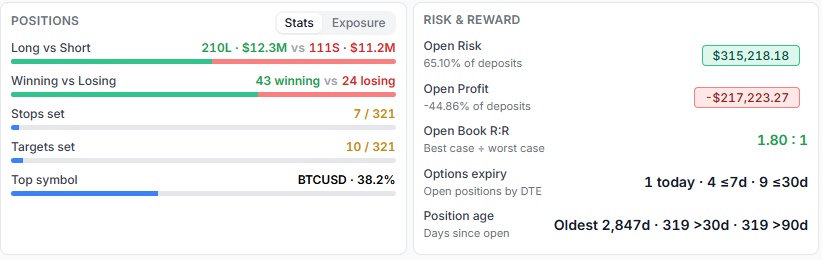
The Positions card breaks down your open book with visual split bars:
- Long vs Short: not just the count of long/short trades, but the dollar value on each side - 24 longs vs 10 shorts means little if one short is 10x the size of everything else. This is your real directional bias.
- Winning vs Losing: how many open positions currently have a positive vs negative total unrealized PnL. These values update with every recalculation and every day the trade stays open.
- Stops set / Targets set: coverage bars showing how many of your open positions have a stop loss / profit target defined - a discipline metric as much as a data-completeness one.
- Top symbol: your single largest symbol as a share of total open value.
The Risk & Reward card focuses on the risk math:
- Open Risk: the distance from the last EOD price to the stop loss, multiplied by the remaining quantity and summed across all open trades with a stop - shown alongside its percentage of your total account deposits.
- Open Profit: the distance from the last EOD price to the profit target, multiplied by the remaining quantity and summed across open trades with a target - also with a deposit percentage.
- Open Book R:R: your best case divided by your worst case - a single reward-to-risk ratio for your entire open book. Anything above 1:1 means your combined targets outweigh your combined stops; if this is persistently below 1, your open book is structurally paying you less than you are risking.
- Options expiry: how many open option positions expire today / within 7 days / within 30 days (based on DTE).
- Position age: your oldest open position and how many positions have been open for more than 30 / 90 days.
For deeper analysis of how your PnL and risk evolve while trades are open, also see running PnL & risk analysis.
Portfolio exposure & concentration: where is your money actually parked?
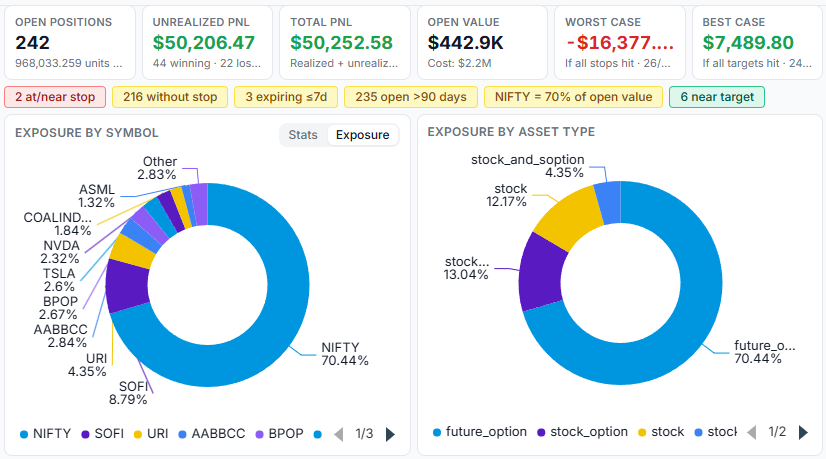
Click the Stats / Exposure toggle at the top of the Positions card to switch the two cards into two donut charts: your open value split by symbol (top 9 symbols + "Other") and by asset type. Hover over any slice for the exact value and percentage. This is the fastest way to spot concentration risk across a large book - especially if you trade stocks, options, futures, forex or crypto side by side.
Live chart + position details on every click
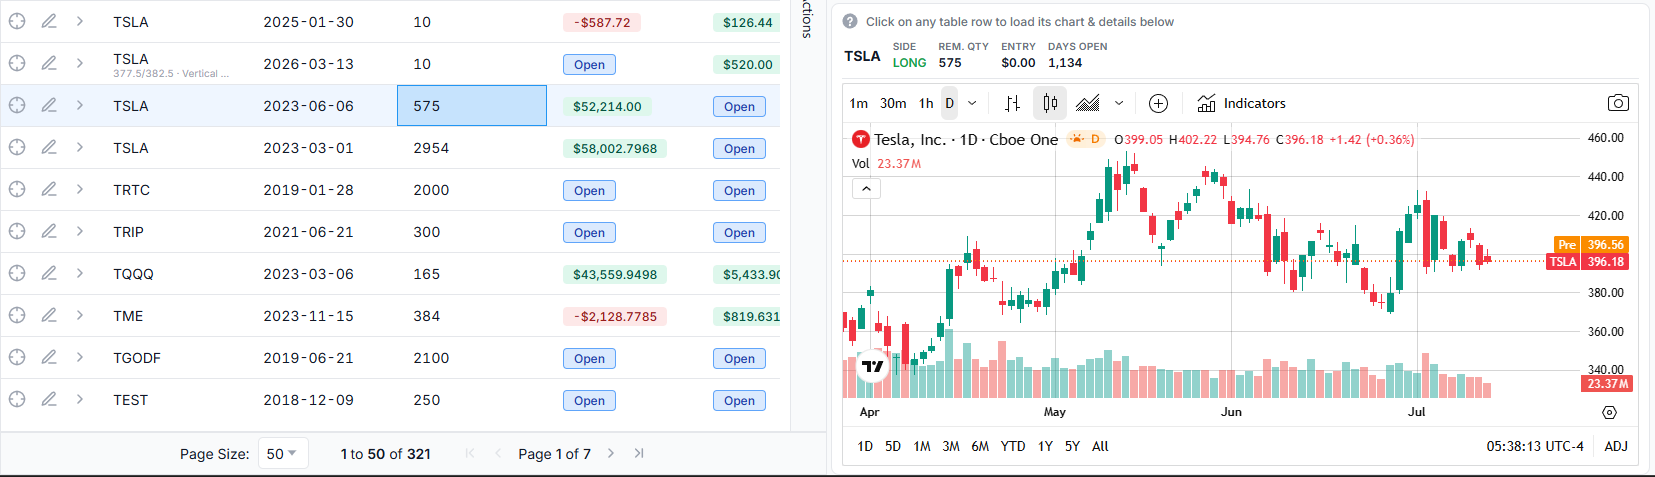
Click on any row in the table and the panel at the bottom right shows a position mini-card - side, remaining quantity, entry price, last EOD price, stop, target, unrealized PnL, unrealized R, % to target, DTE, and days open - directly above a delayed TradingView chart of the trade's underlying. Current market context and your exact position parameters in one glance, so you can plan your next move without leaving the page.
A 60-second daily routine for managing open positions
Here is how we suggest using this tab as part of your daily trade management routine:
- Scan the KPI strip - is your worst case a number you can live with today? Is unrealized PnL drifting in a direction that changes your plan?
- Clear the attention chips - handle expiring options first, then positions at/near stops, then add stops to any uncovered trades.
- Check the Exposure toggle - is any single symbol or asset class quietly taking over your book?
- Click through flagged positions - review the chart, then use the pencil icon to note your decision (hold / trim / exit at level X) so tomorrow-you knows what today-you was thinking.
Four steps, about a minute, and your entire open book is reviewed and journaled - the habit that separates systematic swing traders from reactive ones.
Good to know
- All stats respect your global filters: trading accounts, date range, asset types, gross/net PnL, and the R-value stat mode (unrealized/total PnL switch to R-values when selected).
- If you trade multiple asset types or currencies, use the global asset type filter to review each group separately.
- Deposit percentages require deposits to be recorded under Money Transactions - otherwise they show "—" with an explanatory tooltip.
- Everything is responsive: stat cards reflow on smaller screens and large values are compacted instead of overflowing.
- Want to test how different stop/target placements would change your risk profile? Try the stop loss & profit target simulator.
As always, if there are additional stats or alerts you would like to see on this page, we would love to hear from you! Please send your suggestions to [email protected]!