![[Updated] Chart View in TradesViz v2.0: Fastest way to review trades visually](/media/blog/chart_trades_view_new/chart_trades_view.png)
We originally launched the "Chart view" for the trades table back in 2022 as a way for traders to quickly view charts and trade info. Over time, we updated this to include tradingview charts. Now, with TradesViz v2.0, we have greatly enhanced the features of this very frequently used tab on TradesViz. This blog post will show you all the features of this tab, along with the updates that are now available.
You can access the chart view by visiting the trades table and clicking on the chart tab at the top (chart view is one of the 3 "views" of viewing your trades: tables, charts, and unified). After you click on the chart view tab, you will see a grid of charts (static/image charts by default) with trade info below each chart.
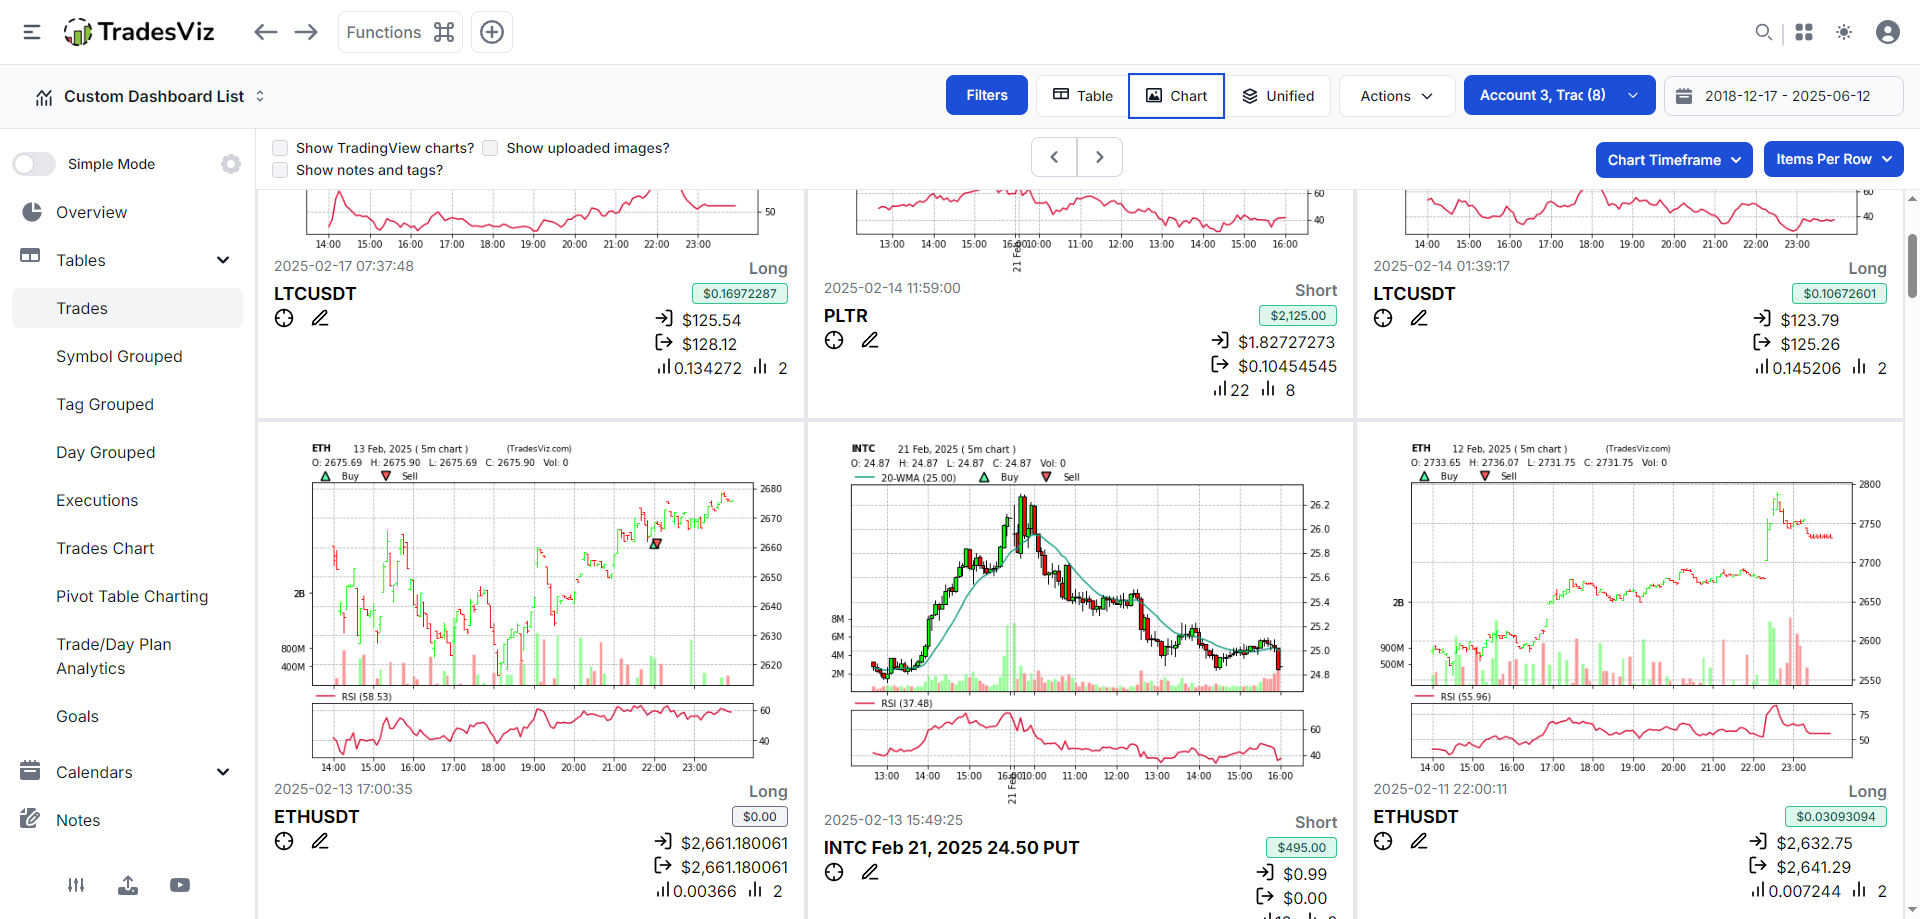
Each card of the element of the grid shows the chart, trades info (symbol, open/close price, pnl) , and optionally notes and tags.
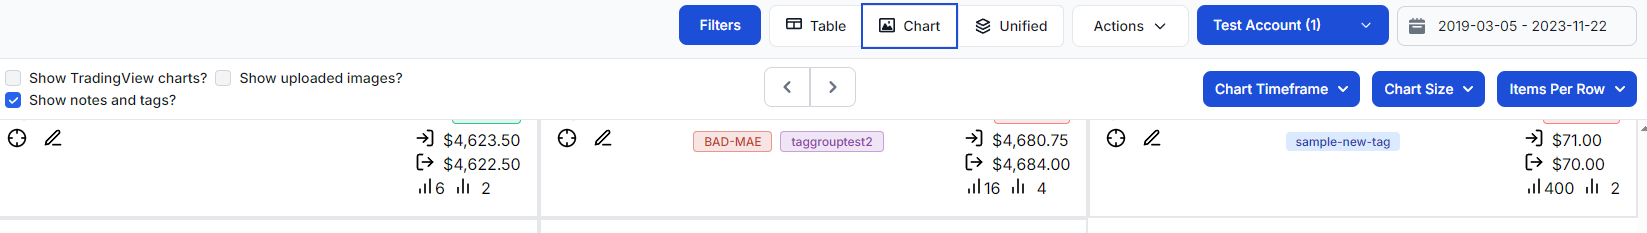
There are many options that can be customized to make this grid truly your own. First, you can toggle on/off the "notes and tags" checkbox at the top to enable or disable the notes section in each grid item displayed. Next, there are 3 drop-downs on the right side of the navbar at the top. On the left, you see checkboxes for toggling note/tags and switching between tradingview charts or imported images.
The dropdowns on the left apply to all types of modes - tradingview, image charts, or uploaded images, so we will first explore the dropdown options.
Chart Timeframe
You can choose from 1 minute to multiple days or even weeks. This applies to both tradingview charts and the static image charts.
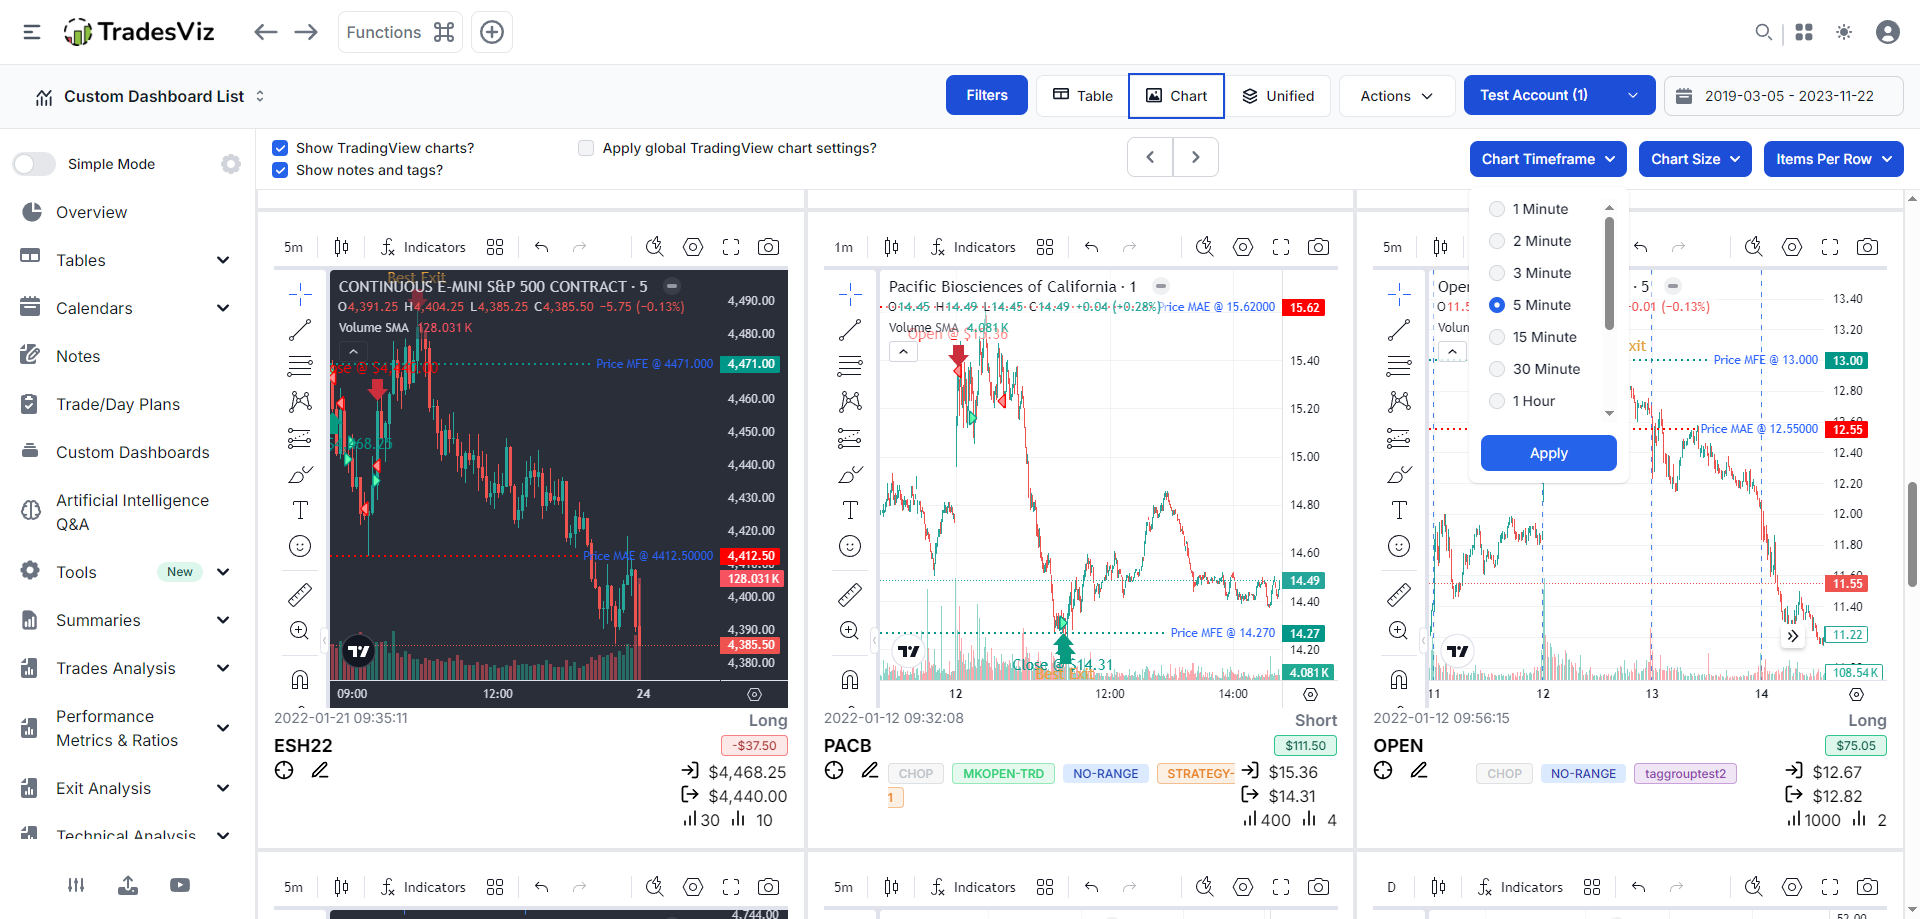
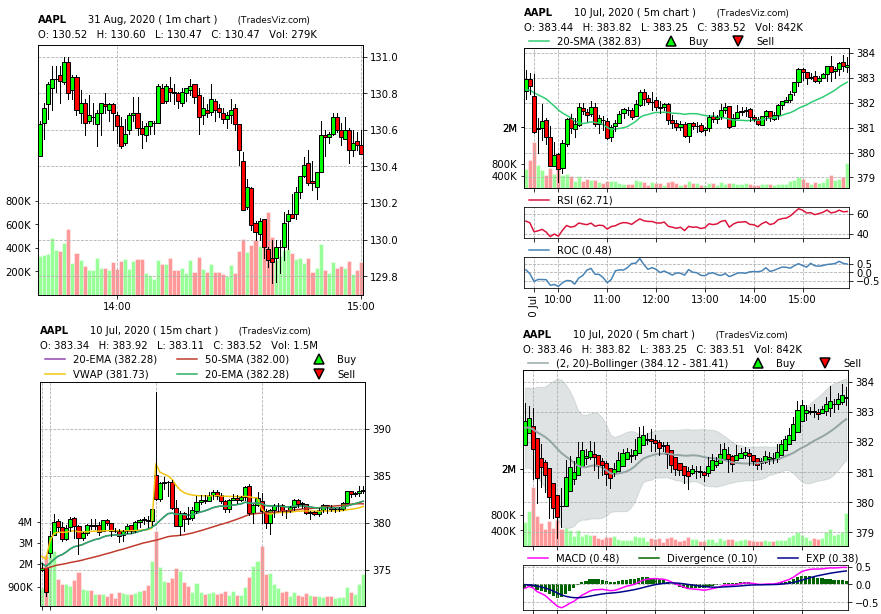
This is an example with tradingview charts enabled and a 5-minute timeframe selected. It is important to understand that while you can choose any timeframe for tradingview charts and it will immediately, the same is not possible for image charts. If you wish to use a custom tradingview indicator template, you can set it in the account settings and check the "Apply global tradingview chart settings" option. More info can be found here.
If, for example, you have set a chat template or profile of a timeframe of 2 minutes for all your trades and choose anything other than 2 minutes in the dropdown, you will not see charts. Here's an example:
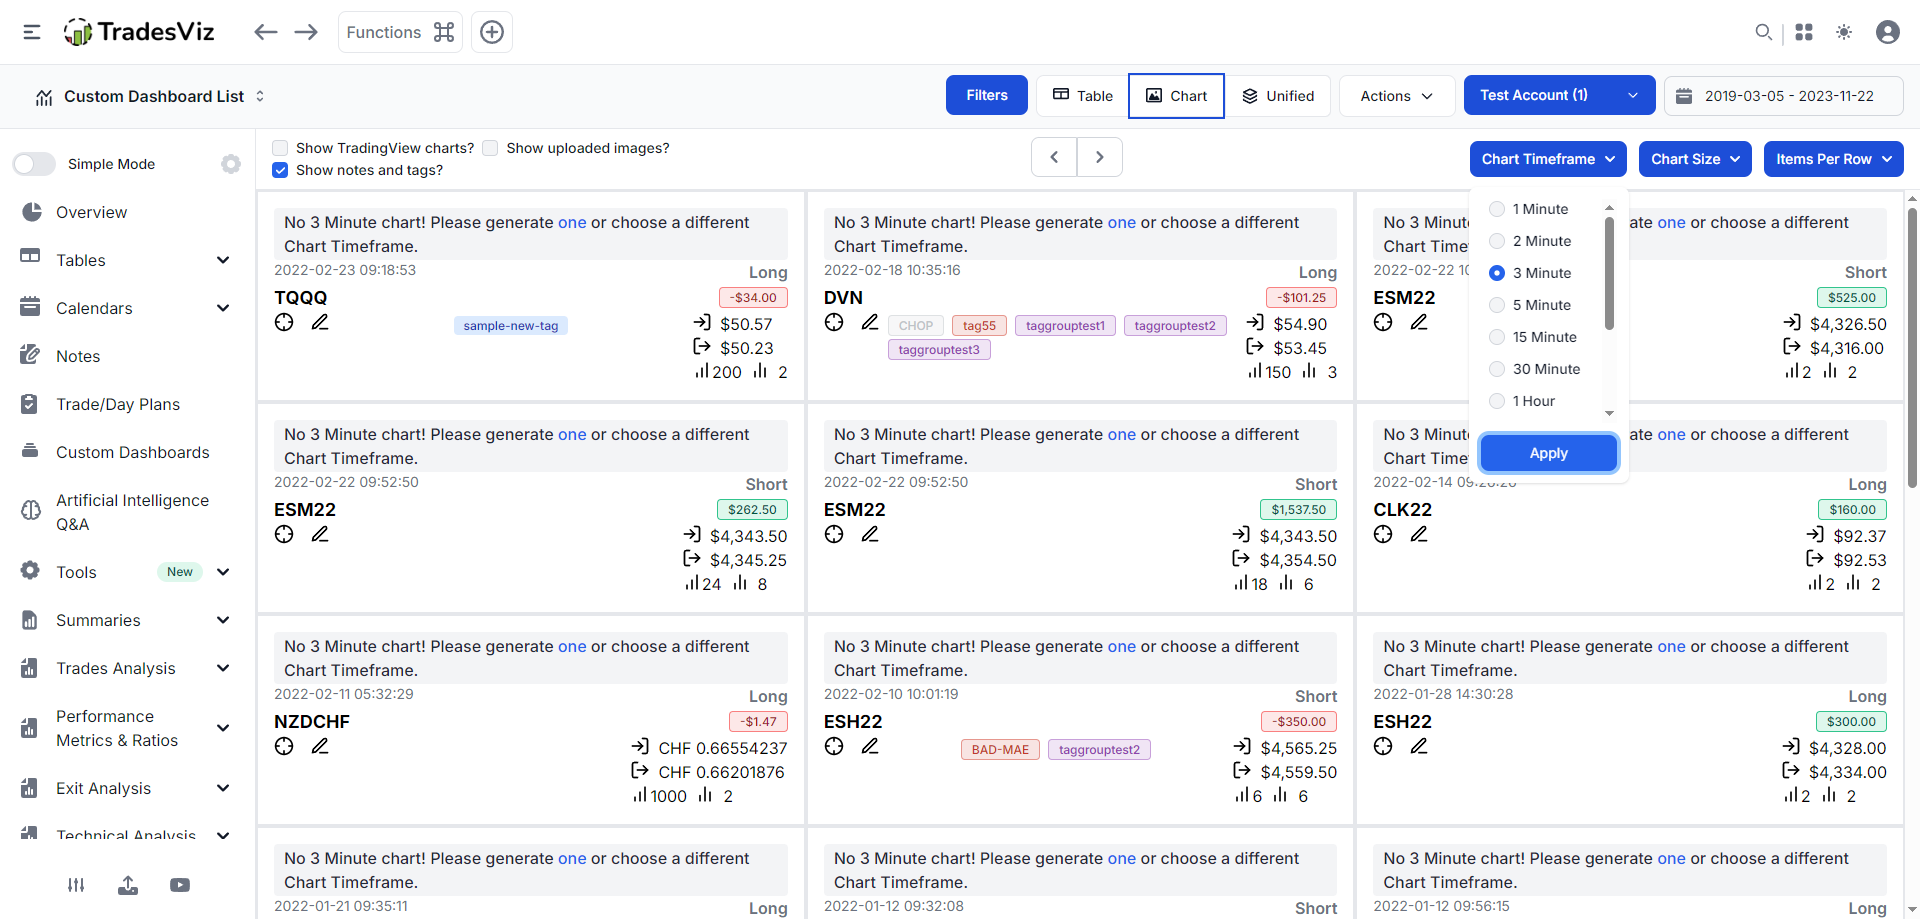
The message also conveys the same information - that you have to create/generate a chart with the timeframe you selected, or choose a different timeframe.
By default, TradesViz uses a 5-minute timeframe as the user chart profile for all users. You are able to change it and also add multiple profiles. It is possible to set multiple profiles, so that you can view multiple timeframes when reviewing your trades via the chart trades view.
More info on generating static charts, creating and editing chart profiles can be found in these blog posts:
Generating stock/symbol charts: https://www.tradesviz.com/blog/generating-stock-charts/
Multiple auto-generated charts: https://www.tradesviz.com/blog/multiple-auto-gen-charts/
Chart Size
With this option, you can select the chart size of the static charts. Here's how the charts look with "Medium" size selected (small is the default).
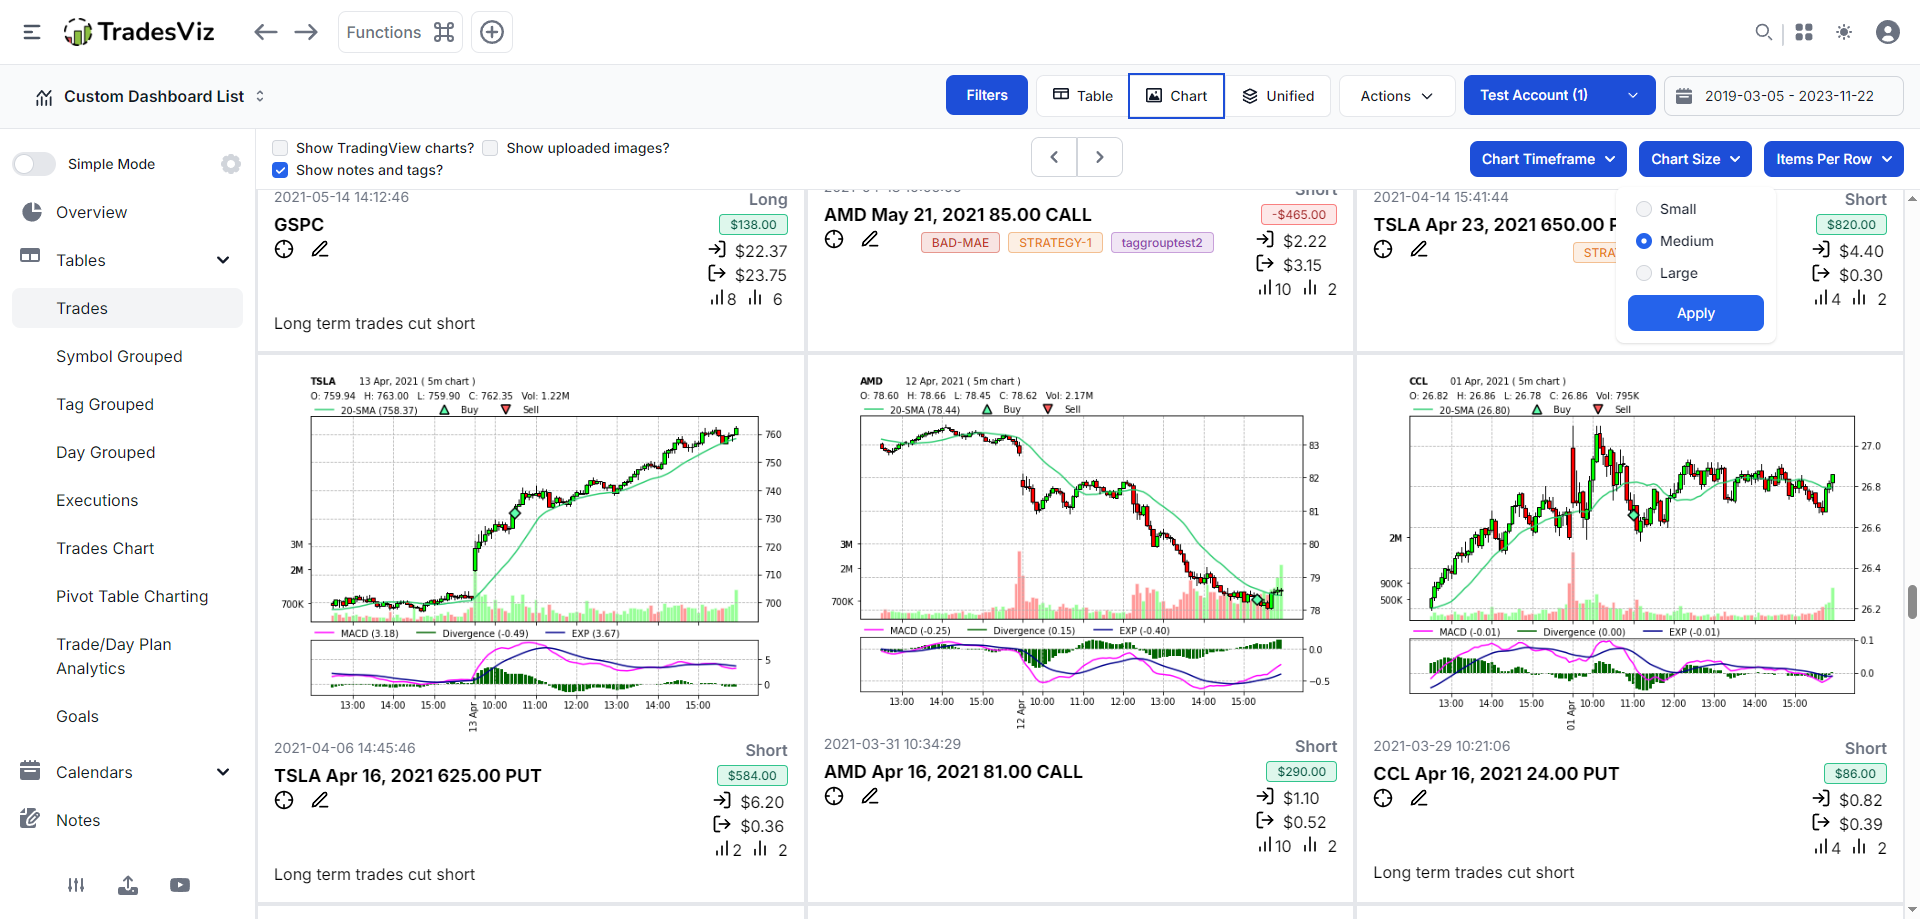
This only affects the chart view using static charts, as the tradingview charts occupy the max area within each grid.
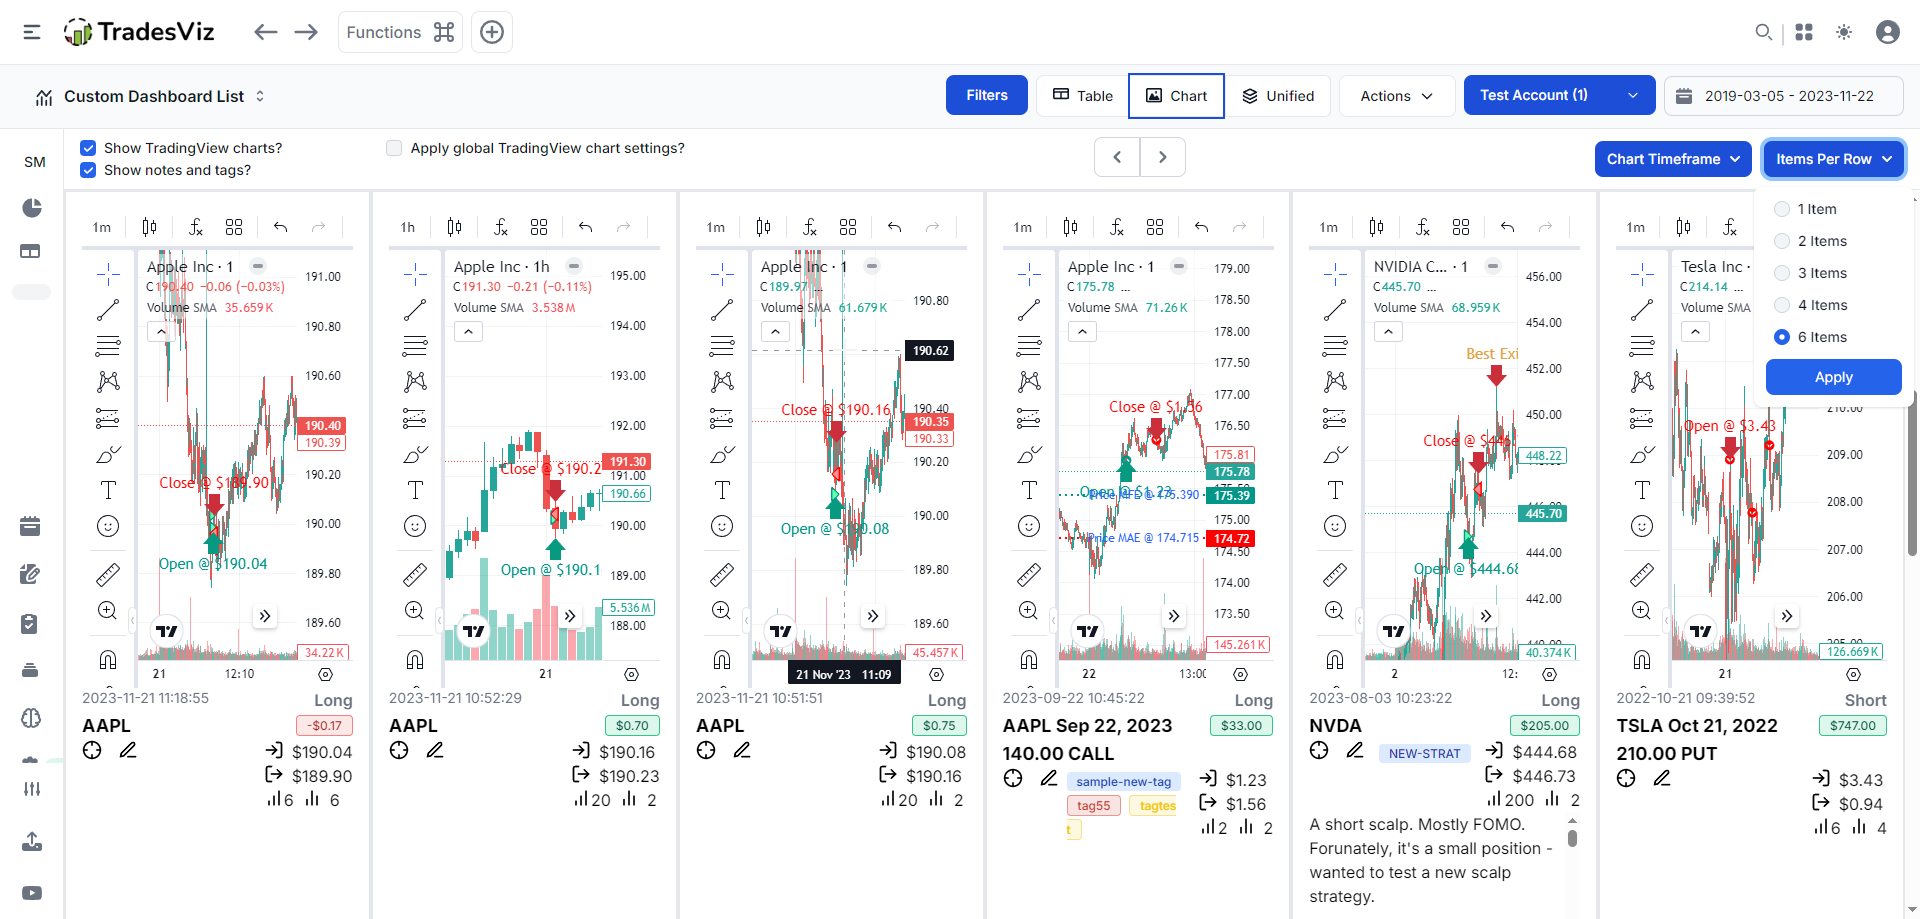
Items Per Row
Finally, with this option, you can choose how many card/grid items to show per page. This is very useful if you have a smaller screen size and if you want to view just 1 or 2 charts per row, or if you have a larger screen and can view more trades in the same row.
Remember that you can also collapse the sidebar (on the left) to get even more screen area. Overall, all of these options exist to make viewing as comfortable and personalized as possible for reviewing your trades.
This covers all the features that are common to all three modes within the chart view: static/image chart, tradingview charts, and image type. Now the image type is a relatively newer version, which we added as a lot of users import screenshots and trade images to their trades, and wanted to view them in a single-page tab, like we have for charts. As shown in the screenshots above, the dropdowns dynamically show/hide based on the type of content displayed.
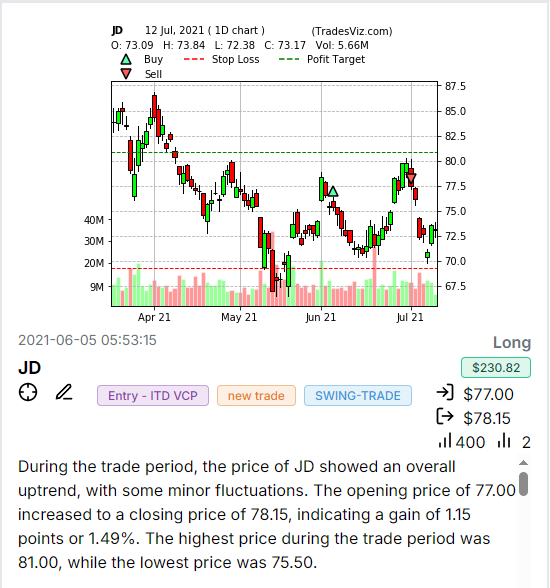
On top of the grid formatting features, you can also view and do your technical analysis, plotting/drawing/note taking from this tab.
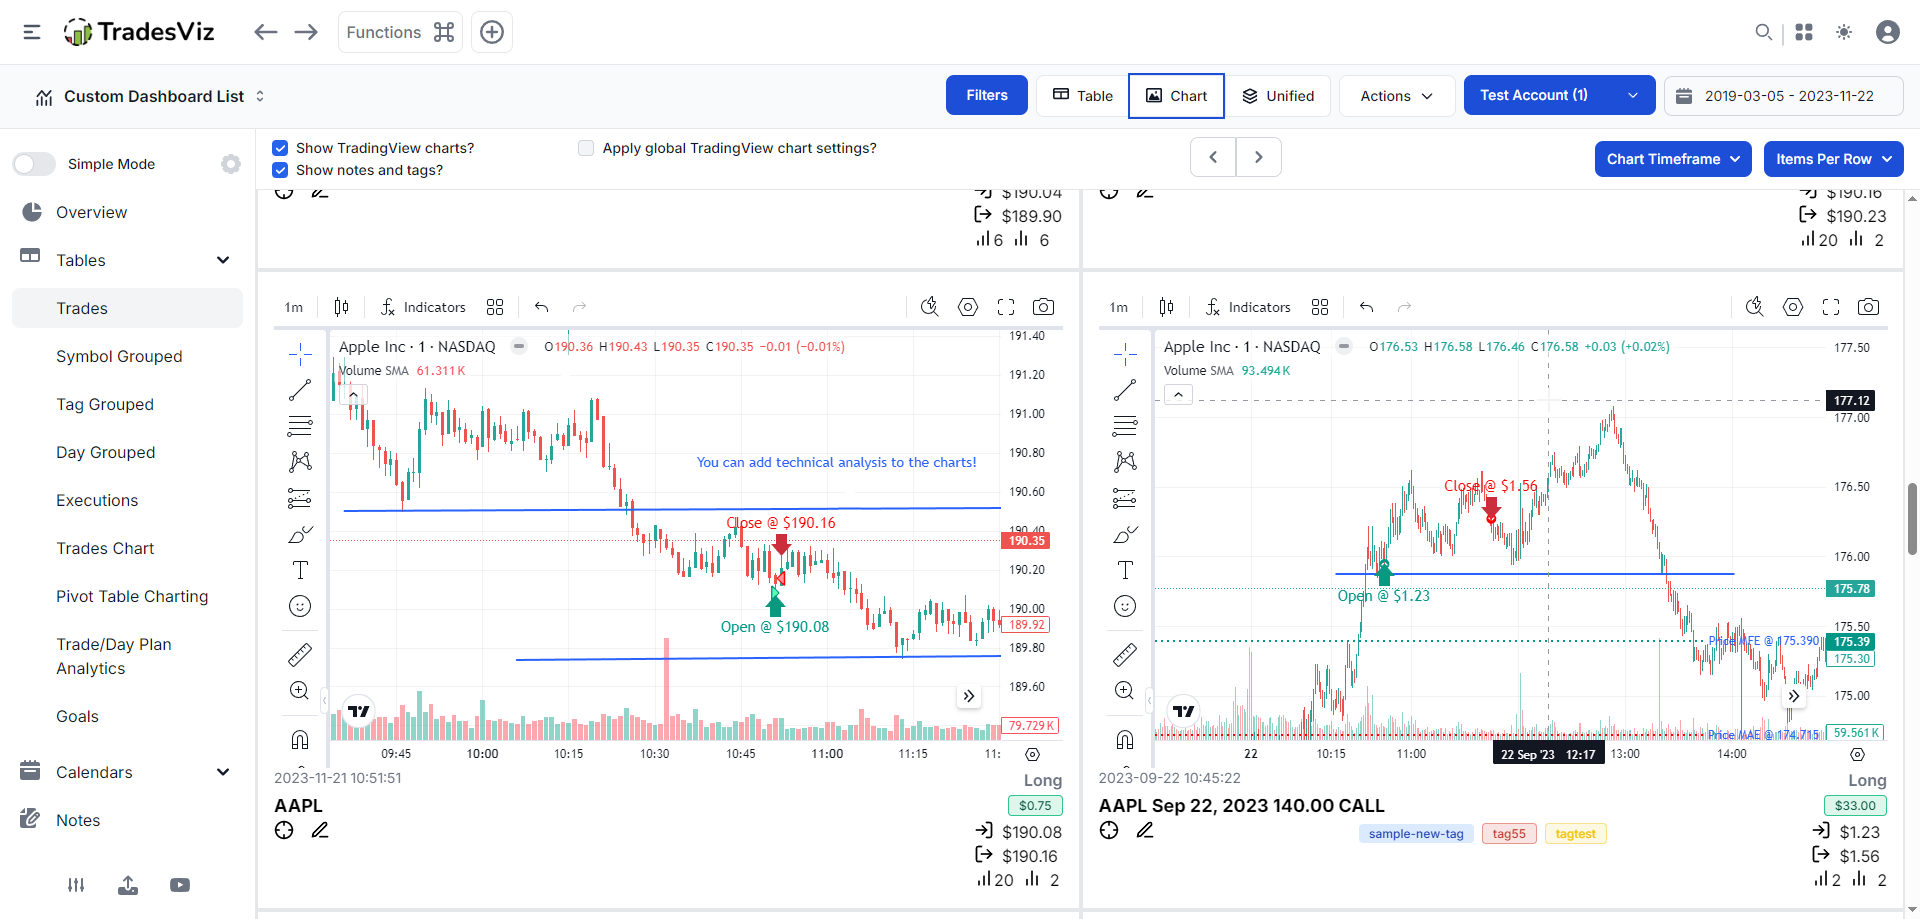
All the drawings you do here are saved just like the dedicated trade charts inside the trade explore tab. So, as you review your trades, you are able to view charts, do technical analysis, edit notes/tags, and also explore the trade using the target icon shortcut.
The chart trades view tab is a versatile tab in TradesViz that is focused on reviewing trades quickly. We hope this guide serves as an updated manual for new and existing users on how to effectively use the chart trades view tab.
As we are always constantly improving TradesViz, if you have any feedback or feature requests, please send an email to [email protected]. A lot of the improvements and changes you see in this tab over the years are carefully added based on 1000s of trader conversations! :)