Symbol charts are a very important part of visualization in TradesViz and in pretty much any tool that involves trading. We understand that some traders prefer simple static charts and some prefer interactive charts like in their trading platforms - each of these platforms have their own pros and cons - but TradesViz is the only platform which has both these types of charts - static and interactive to serve the needs to all types of traders!
We'll start off by learning about all features surrounding static charts and how to generate them in TradesViz. There are a few ways to generate a basic symbol/bar chart for a trade.
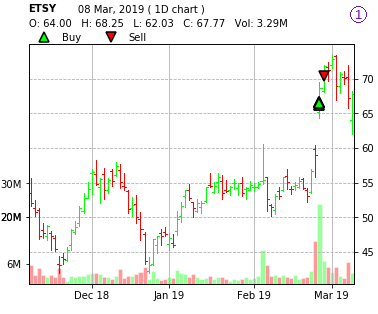
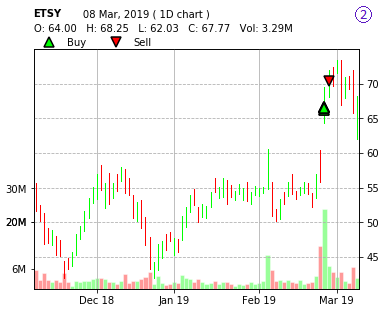
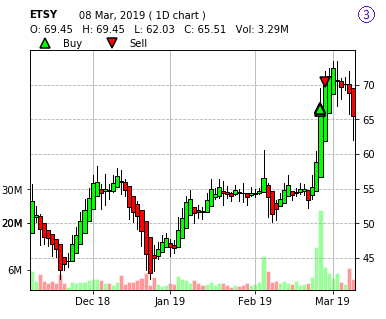
This is the simplest chart you can generate in TradesViz - price, volume, and executions plotted.
Ways to add a chart
Charts can only be viewed in 2 places in your dashboard - in the trade explore and in the day explore view. Both these tabs have a separate section for system-generated charts and there are different ways to add a system-generated chart. Also, you can add a maximum of 12 charts per trade and per day. We may increase this limit based on user suggestions.
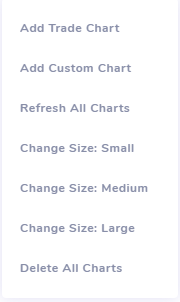
The most common/easiest way is to open a trade explore tab (by clicking the explore button in any of the table views) and then in the "Charts" section below, click on the 3 dots on the top right corner and select "Add Trade Chart". This will add a simple daily-timeframe candlestick chart (like the one in the previous section) by default with the executions of the trade plotted with red (for sell) and green (for buy) arrows. Note that this can only be on in the trade explore tab!
The next way is to add a custom chart by once again, clicking on the 3 dots on the top right corner of the charts container and then selecting "Custom chart".
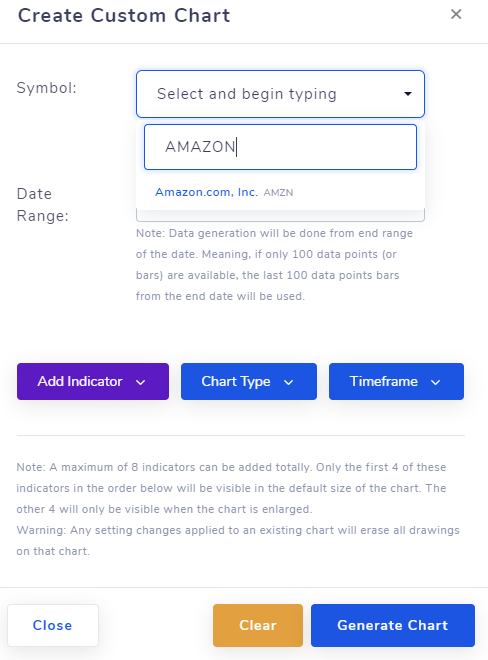
This will open up a popup with chart customizability options along with a live search dropdown for typing in and selecting any symbol. Unlike a simple trade chart, a custom chart can be added from both trade tab and day tab - the reason is that this is simply a chart that has no executions plotted in it. It's highly useful especially for trading days where you want to write out all your plans and have all the charts displayed at once. Unlike other platforms, we not only allow multiple charts per trade and per day, but you also have the freedom to generate ANY supported symbol's chart for trade or for a day - this makes TradesViz a complete trade planner!
The last way to add a chart is by using the group/bulk apply operation in any of the table views. More about group operations are discussed in this blog post. Just select all the trades to which you want to add a simple chart and then click on "Generate simple chart" in the group apply popup. All the trades will have a fresh, simple daily chart added in the charts area. Remember that by default, no trade or day will have a chart. It's a completely user-initiated task!
Note that for 2 of these 3 ways, you can edit the global chart settings in your account settings so that all default/auto-generated charts have specific settings - such as timeframe, indicators, candlestick types, etc., instead of a simple daily chart. These settings are taken into account when generating a chart via the "Add chart" option, bulk/group trade chart generate option, or for when new trades are imported.
Symbols/Market data availability
Currently, we support EOD data for the following asset types:
- Stocks (Most US stocks (from all major exchanges))
- Forex (Inactive + Active - total 600+ pairs)
- Indices (All world - 400+)
- Cryptocurrency (150+)
- Futures (Most popular US futures)
For intraday, we currently have all stock data up to the 1-minute interval, and most of the popular futures contracts up to the 5-minute interval. We are working on getting more data vendors for even lower timeframes and for much longer history. If a symbol's data is not available, you will see a blank chart with no data in it. If you think a symbol or an exchange is missing, please contact us at [email protected] and we'll do our best to add it as soon as possible.
Other chart functions
To access chart functions, hover over any chart and click on the gear icon to open the functions menu.
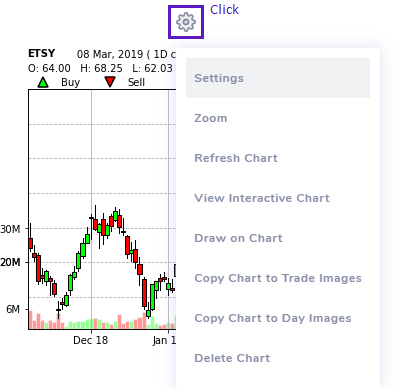
Chart settings
Customize your chart's type, indicators, symbols (if it's a custom chart) using this option. More details about types and indicators further down this in post.
Zooming charts/Chart sizes
There are 3 levels of zoom to control this, click on 3 dots in the top right corner of the charts container and set the size to your preference. Other than that, you can also either click on any chart or click on the "Zoom" option to view the maximum sized chart in a popup.
Refreshing chart
If you update an execution or add an execution, you have to refresh the chart to see the updated markers on the chart. Please do remember that refreshing a chart clears all the writings and drawings on your chart! You can refresh all charts at once by click on "Refresh all" after opening the chart area dropdown by clicking on the 3 dots on the top right corner of the charts container.
You might now notice a trend - the gear dropdown on the top of all the charts has operations that are applicable only to the chart below the gear, but the operations in the 3-dots menu on the top right corner of the charts container apply to all the charts in the container.
View interactive chart - explored in a separate section down below in this blog post.
Drawing on charts
Just like how we showed you can draw on any images uploaded to TradesViz in the trade explore tab, you can also draw on any system generated charts! Similar to how you would mark your potential entries, add comments, draw lines on your platform's charting area. One key difference is that in TradesViz each chart has 3 copies - one for each size. So, depending on the current view you have your charts in, your drawings will only be applied to that view. So, don't be surprised if you don't see your chart drawings if you change the chart's size - it's all there, but you have to revert back to the size in which you drew on to see your drawings again.
Copying chart to trade/day view
You can generate a symbol chart for a trade and then copy it to the trade's day. If you repeat this step for all the trades in a day, you now have a single day view where you can see all the charts with the executions marked! The other use is to just copy the chart from the charts container of a trade view to the image container of the trade view. This way, if you want to mark or draw anything on the chart, but don't want to share it, you can just uncheck the images option in the share trade settings popup. This is because all the system generated charts will be publicly visible (applies to both shared trading days and shared trades).
Chart types
The main customization you might want to do is change the bar-type. We currently have 7 types available:
- Candlestick
- OHLC
- High-Low
- Heikin Ashi
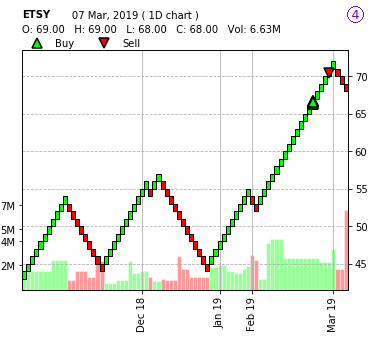
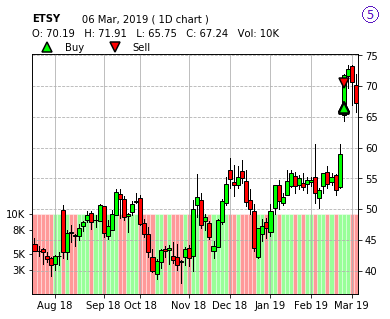
- Renko
- Volume
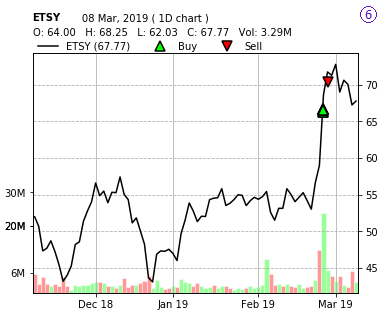
- Line
Below are examples of these charts types in the same order as the listing above (except Candlestick chart) of the same symbol of the same trades in daily timeframe:
More about special bar types
For Renko and volume bars, the chart settings popup will show an additional input box for the bar sizes (ticks/points for Renko bar and volume size for volume bar). For all other chart types, there is no other input needed. Note that Renko and volume bars are not fully tested for all asset classes. We are constantly working on improving the functionalities of our chart generating system. Let us know if you notice any inconsistencies or have issues with generating a proper chart.
Indicators
Currently, we have 9 different indicators. Let us know if you need more! Our currently available and ready to use list:
- SMA
- EMA
- Bollinger bands
- VWAP
- RSI
- ROC
- CCI
- MACD
- Symbol Compare
We assume most traders will know about these indicators and their parameters. If you are unsure about a particular indicator, we suggest looking at the videos and pages in investopedia.com. The last "indicator" (aka Symbol Compare) is just plotting another symbol of the same timeframe and data range in the same plot - overlaying different symbols like SPY, and maybe other indices may give you a better idea of how the underlying performance was compared to the market.
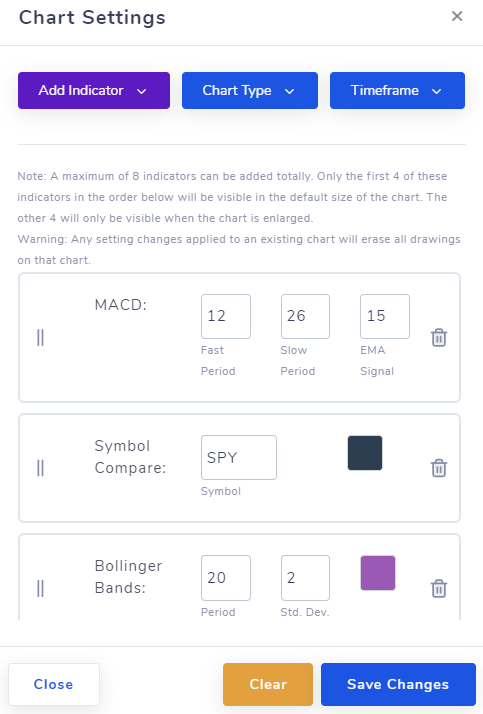
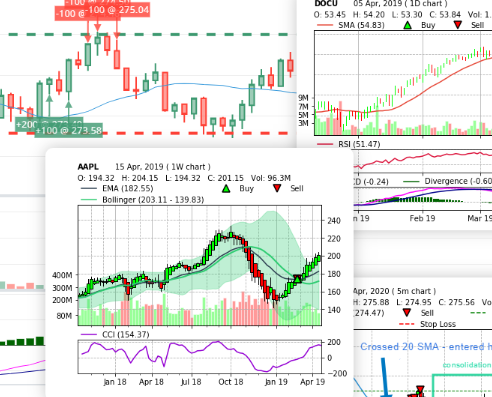
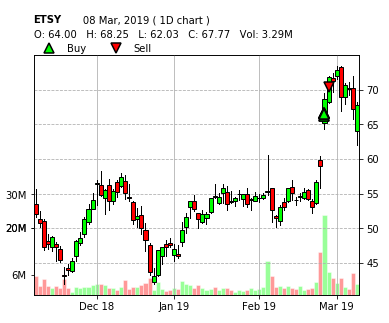
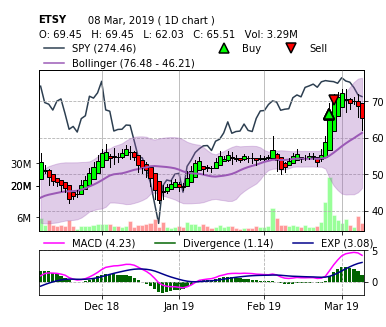
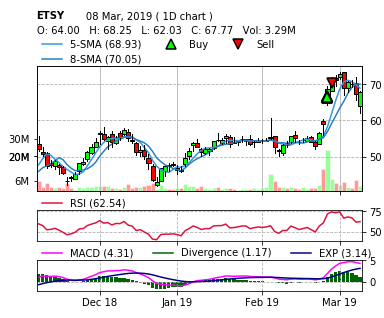
Up to 8 indicators can be added per chart. Depending on the chart size, only a portion (top 4 in the order of indicators in the settings list) of the indicators may be shown to make the chart less cluttered. You can rearrange the indicators using the drag icon in the chart settings popup to make sure the most important indicators according to your preference stay on the top so that they are always visible on all charts. Below are some examples of the available indicators plotted on an ETSY chart.
Interactive chart
Having a lot of interactive charts can be nice - easy to compare, can glace at the big-picture quickly. But what if precision is required? what if you need to know exact OHLC prices, volume, and even indicator information? You can now look at bar-by-bar info just like you would in your trading platform right in your trade view tab itself!
In the chart menu which popups up when you click on the gear icon, click on "View interactive chart" and a fully interactive chart will load right below the charts section. This means you can view ANY system-generated chart with any indicator in with full interactivity right in your browser. Here's an example of the interactive chart generated for the ETSY chart with RSI and MACD (static chart example above).
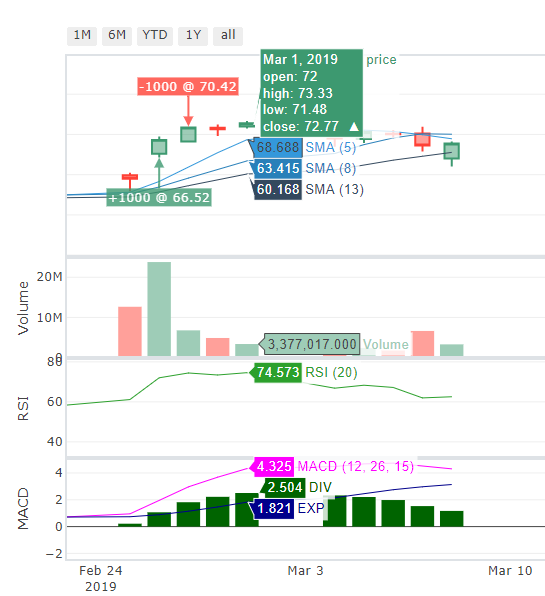
Zoom, pan, look at every individual data point with this mode - this even works for Renko, volume, and line charts. Note however the drawings and text you might have on your charts will not be visible on the interactive chart!
With this, we have explored every chart-based feature of TradesViz. Let us know what you think! Do you need more bar types? more indicators perhaps? or maybe additional chart features? send us an email at [email protected] or fill up and send the contact form here.