If you are an existing user, it is not new to you that the TradesViz Trade Explore is one of the most visited tabs in the TradesViz trading journal.
It has been nearly 4 years since we first wrote about this in our blog. You can read the original here: https://tradesviz.com/tab-explore-tradeold.
With the launch of TradesViz v2 along with plenty of updates in the previous years the Trade Explore tab has evolved a lot and we wanted to write a full blog post about the Trade Explore tab with all its new features.
Before diving into the details, if you are more interested in a video format, please check this:
(We have 10 NEW videos all focusing on features of TradesViz v2.0 UI)
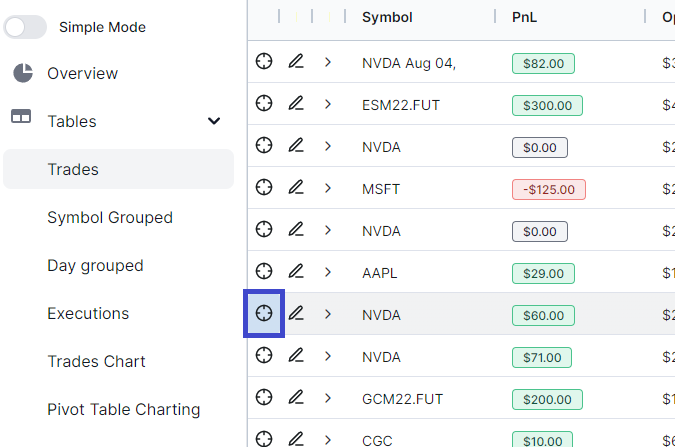
Ok, now let's see how we can first get to the trade explore tab. To visit a trade's trade explore tab, simply click on the target icon in ANY trades table in your dashboard:
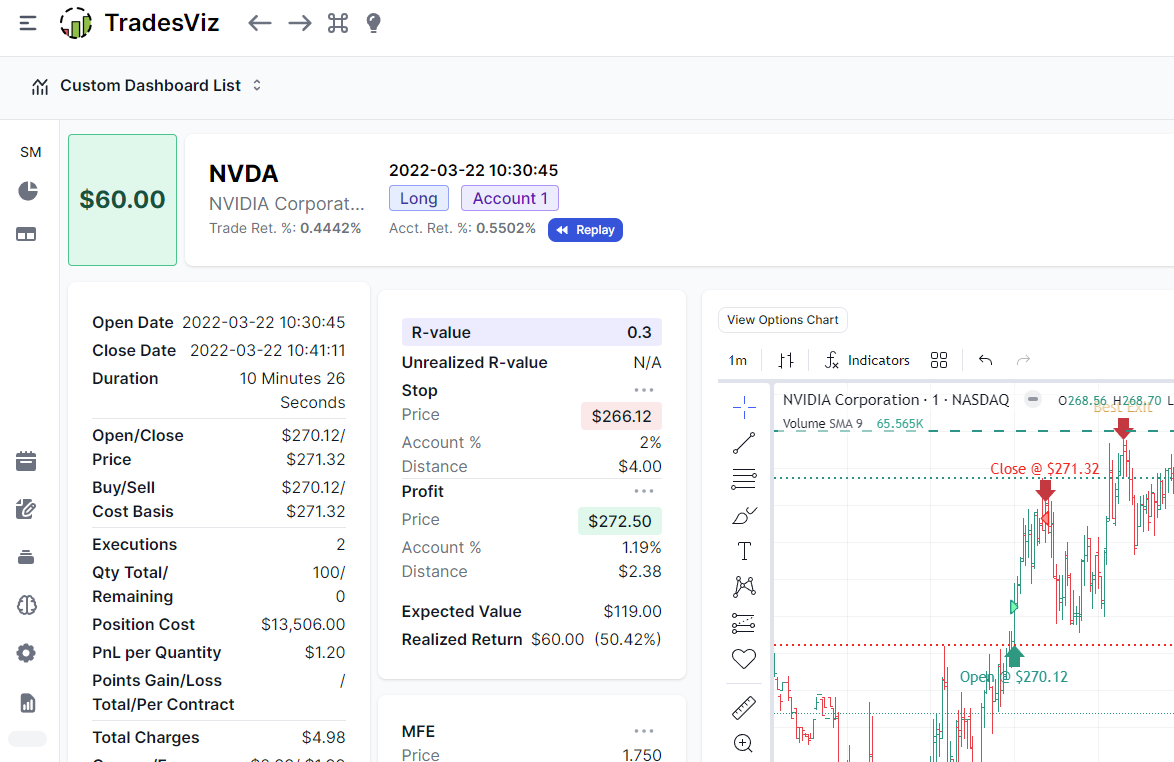
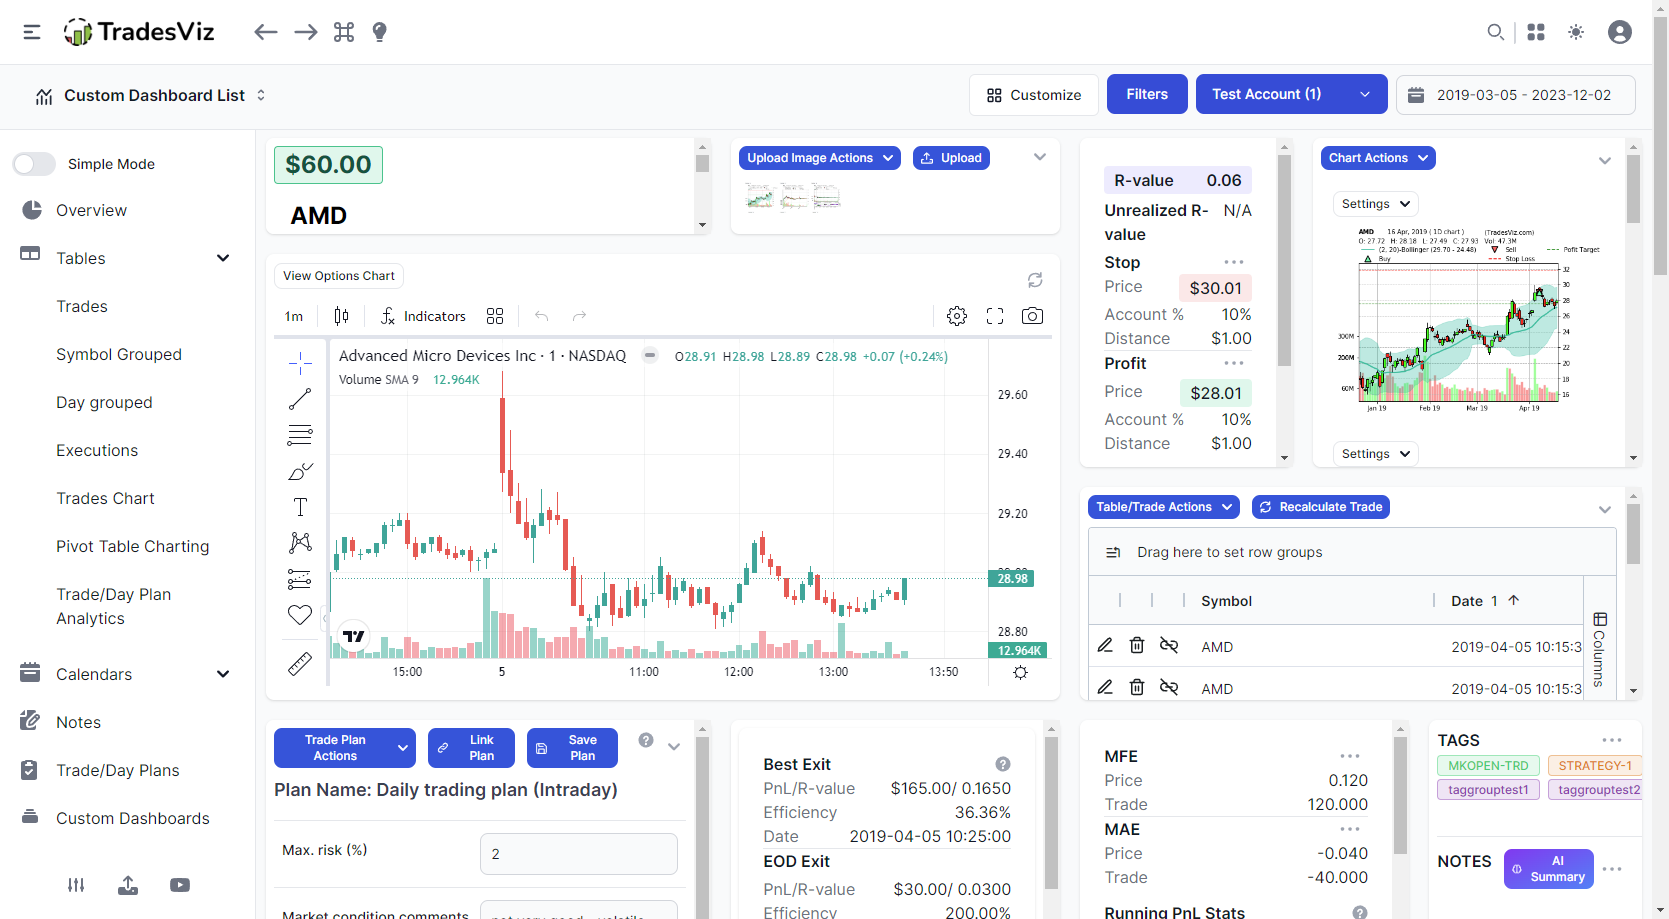
Once clicked, you will be redirected to the trade explore tab that looks like this:
This is where learning happens for most traders on TradesViz.
Why?
This page has A-Z info about the trade you are exploring. Open-close prices, best exit, running pnl, tags, comments, charts, risk values, and more - they are all laid out for you.
On the top left corner of the tab, you will see information about:
- PnL
- Stock name
- Open datetime
- Account return % (in relation to the deposits made in the account so far)
- Trade return % (based on trade investment)
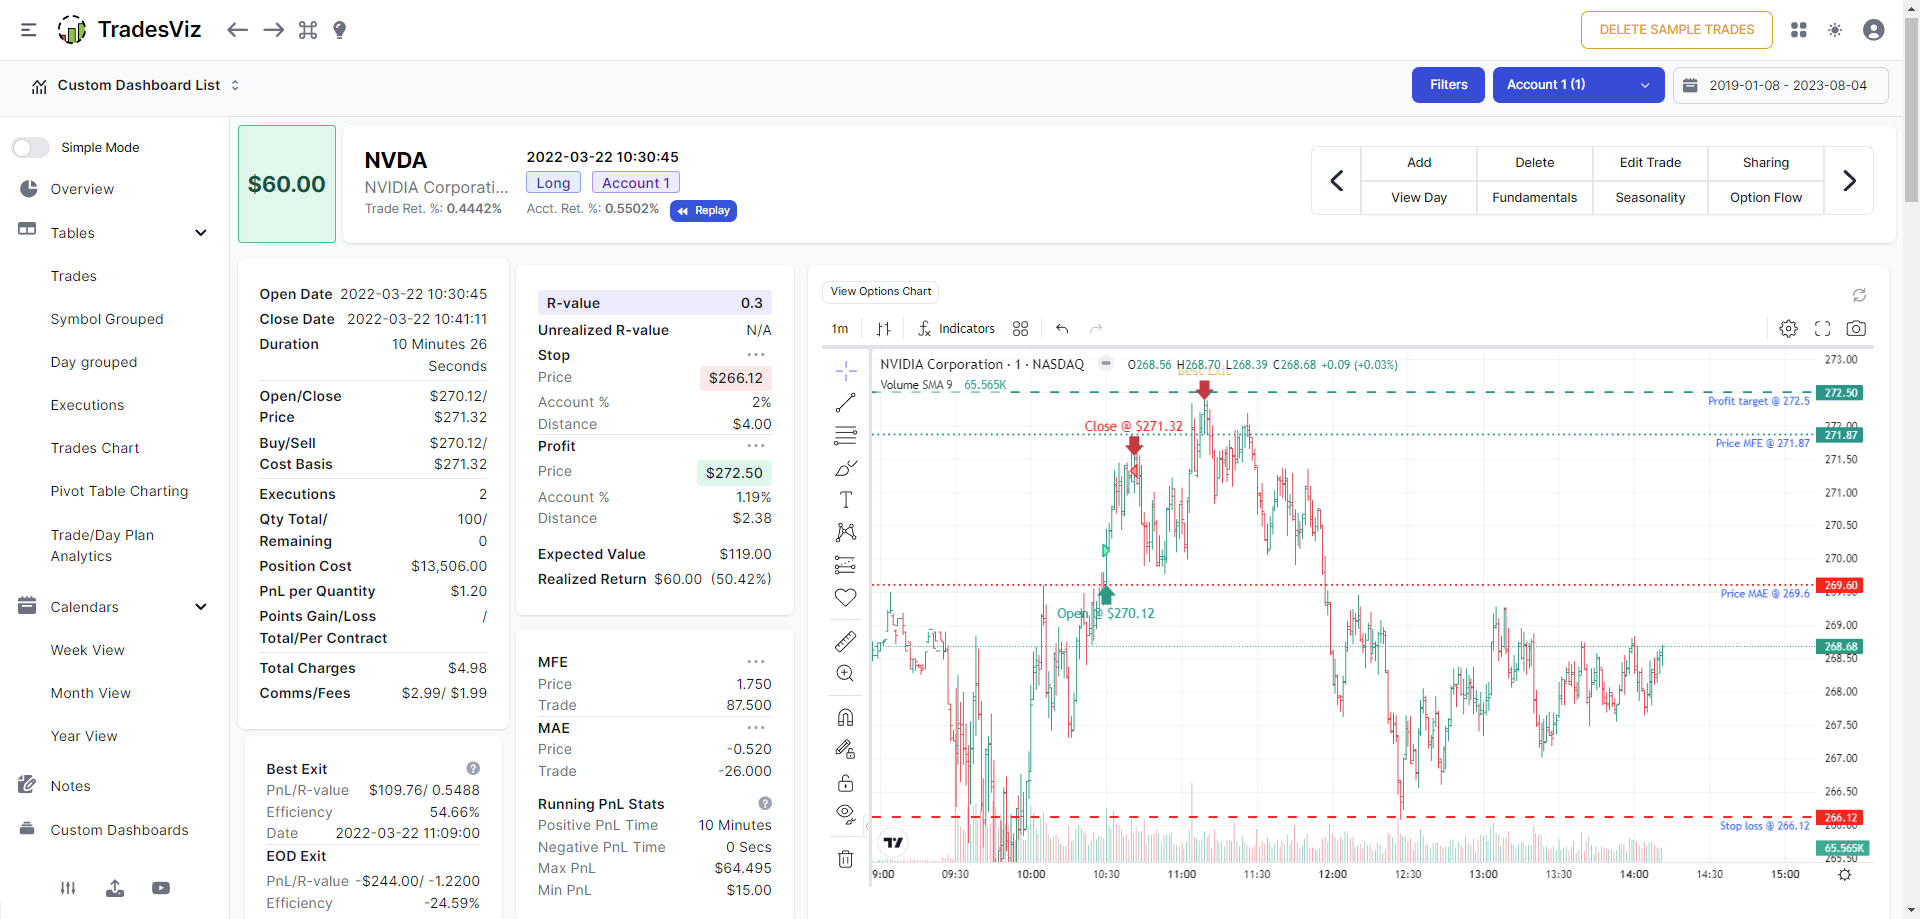
On the right side of the same row, we have buttons for:
- Adding more execution
- Deleting the trade
- Editing trade misc. data like notes, tags
- Sharing settings (if you want to share this trade as a link publicly)
- Exploring the day on which this trade was made
- Shortcut to view the Fundamentals page of the underlying
- Shortcut to view the Seasonality page of the underlying
- Shortcut to view the Options flow info of the underlying
- Left/Right buttons to go to next/previous trade based on the order in the trades table
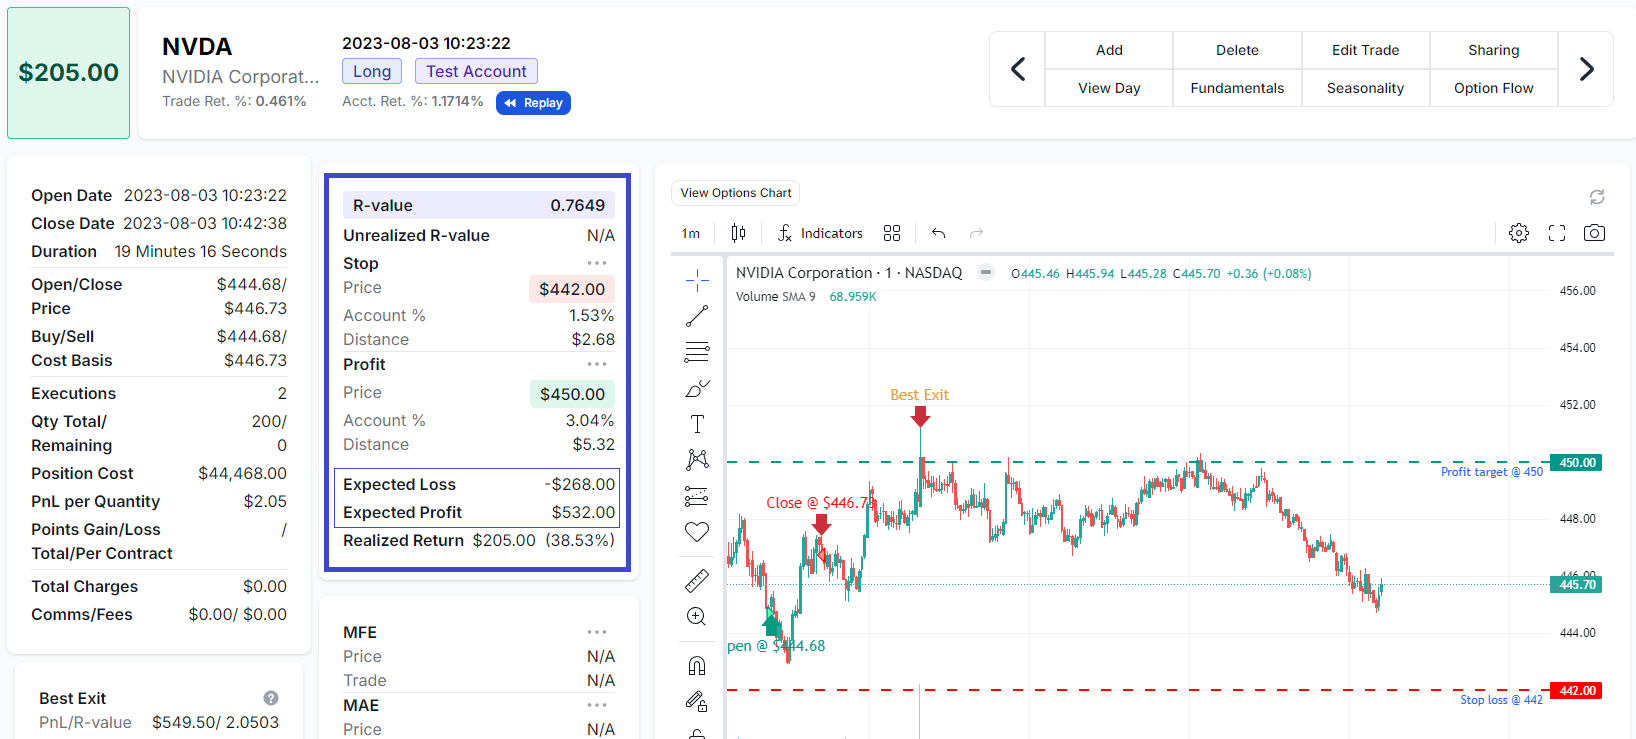
Below this, you will see multiple stats sections on the left side and a chart on the right. The chart shows your individual executions marked exactly where the execution took place (price - y-axis) and at what time (x-axis) along with open and close markers. You will also see the MFE/MAE lines, stop, profit target lines, and finally a marker for the best exit of the trade.
The sections on the left show you all the quantitative stats of the trade. Note that you may see a minor difference in what sections/type of data is shown based on what asset type you are viewing. For example, if you are viewing options, you will see greeks in addition to the above-shown stats.
Scrolling down further, you will see dedicated sections for entering notes and tags.
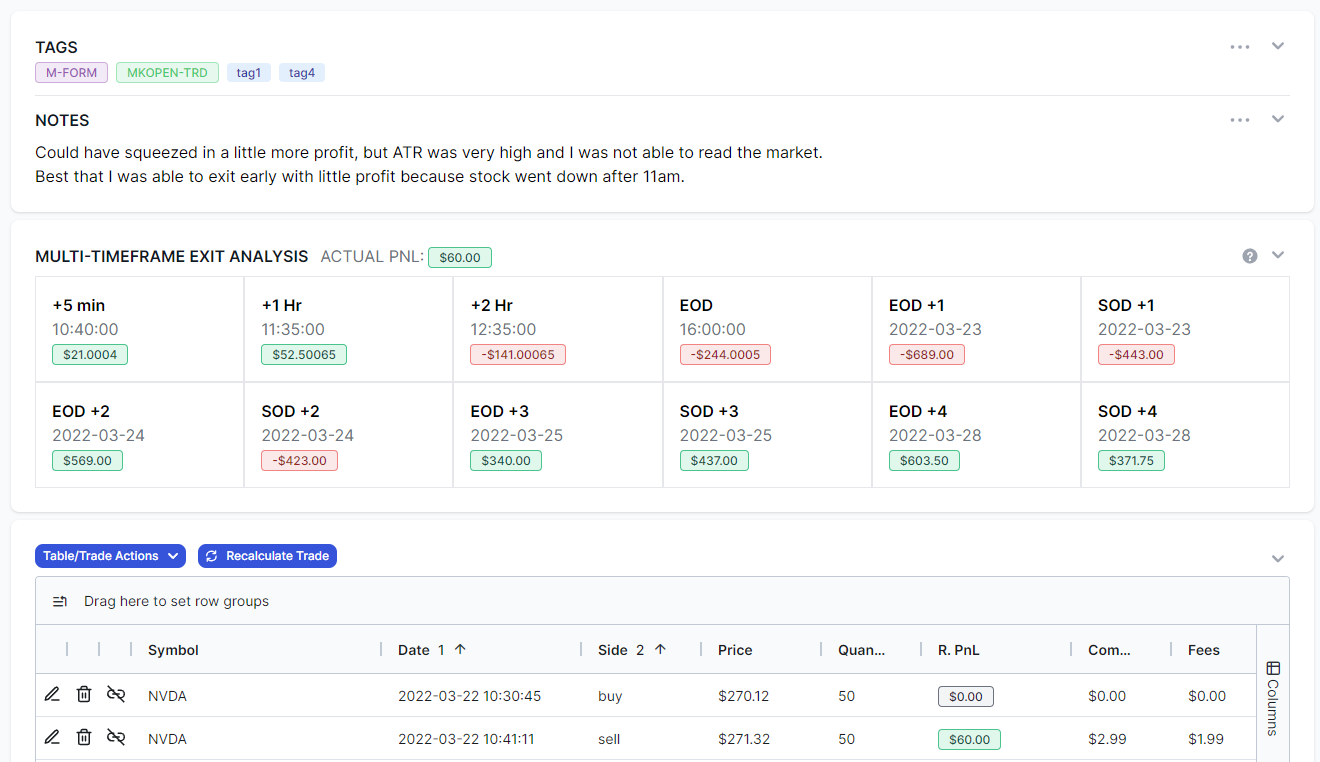
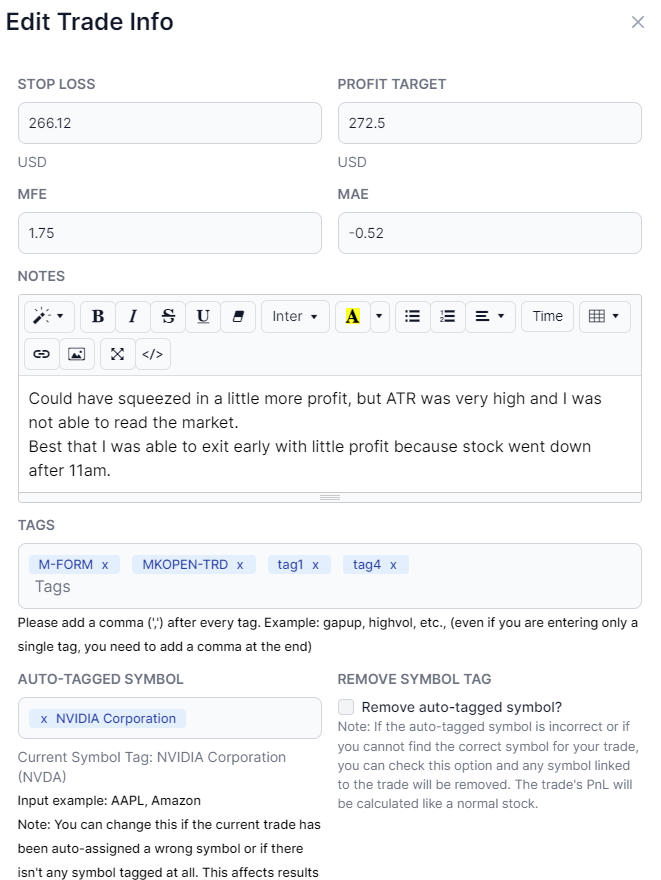
Note that you can edit the notes or tags by clicking on the 3 dots icon at the top right corner of the respective containers. Clicking on the edit button at the top right corner of the page will also open a new that contains fields to edit notes and other attributes of the trade:
Another icon that you will see in all the following boxes/sections is the down arrow at the top right corner. Clicking on this will collapse the section and preserve it across sessions. This can be used if you don't want to view a particular section.
The next section is stats for multi-timeframe-exit anlaysis (MTA). We will not go in-depth into this, but the gist is that multi-timeframe exit shows that would have been your pnl if you had exited say, 1 hr after, 2 hrs after or 1 day after opening the trade. This can be used to optimize your trade closing/exit times and duration. More info can be found here.
Below the MTA stats is the execution table. This is where you will see all of your executions of your trade. You can sort, filter, and chart using the data here (most of the grid charting filters also apply here).
You can edit, delete, and split executions via this section. If you want to learn more about trade and execution management, we highly recommend watching this video:
Up next is the upload images section where you an attach your own screenshot. A unique feature of TradesViz is that you can upload and also draw/edit any image or chart. To do this, click on any image or chart and click on "Edit" button or on the pencil icon at the top right corner. For example, the arrows in the image you see below are added via the TradesViz's built-in editor.
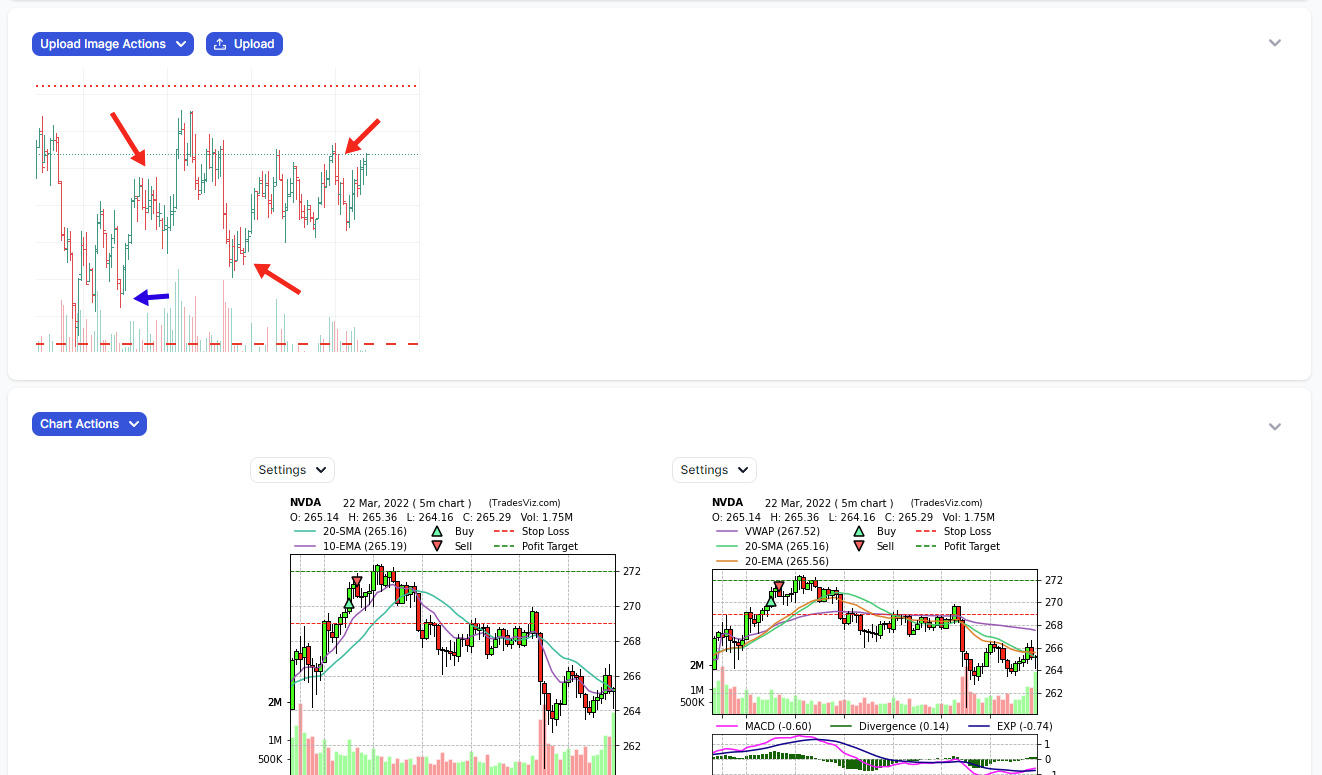
Next is the static charts container. Stats charts were the first and the original way to view bar charts in TradesViz. Even after years, they are still one of the highly used features of TradesViz. It's fast, easily editable, and can be shared easily compared to the interactive charts that we now have in addition to this.
The charts are highly customizable. You can set up TradesViz to automatically generate multiple charts for each added trade and also manually add trades whenever you want.
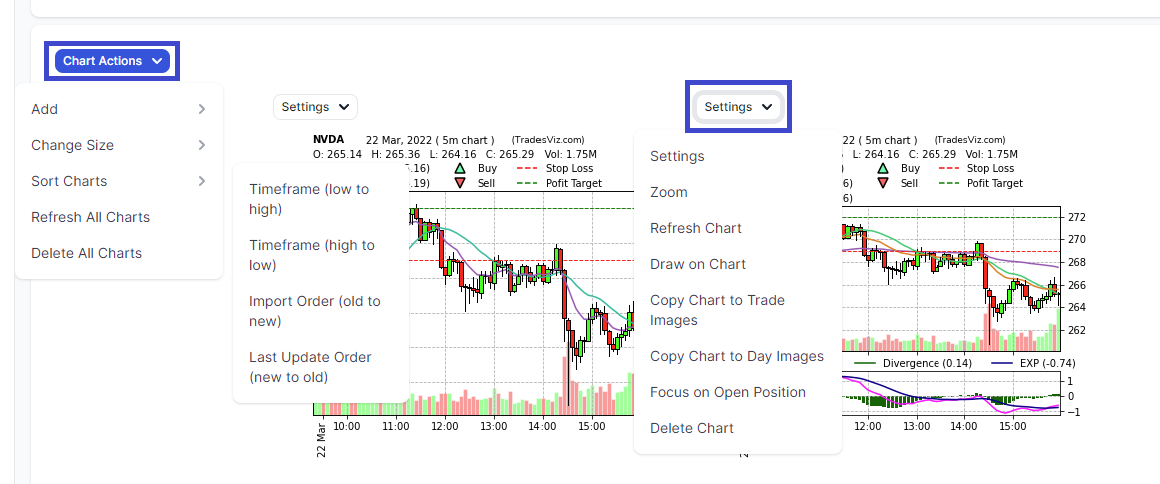
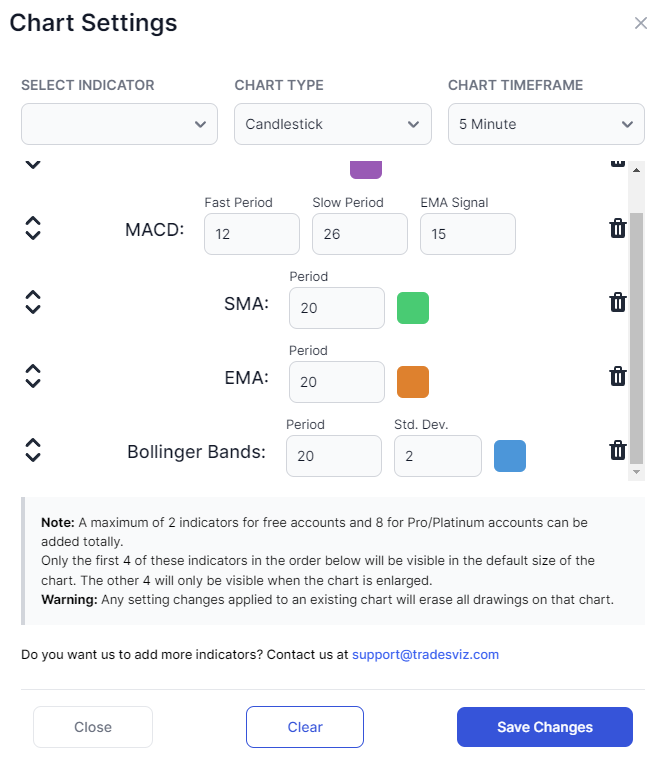
To add refresh or change the size of charts, click on the chart actions dropdown at the top left corner. Similarly, to edit charts, click on the settings dropdown at the top left of each chart. You can change the timeframe, indicators, type of chart, and so on.
After the charts section, you will see a delayed chart (TradingView widget) of the underlying. The final two sections are for viewing the realized pnl and the running pnl of the trade. You can learn more about running pnl here and running pnl stats here,
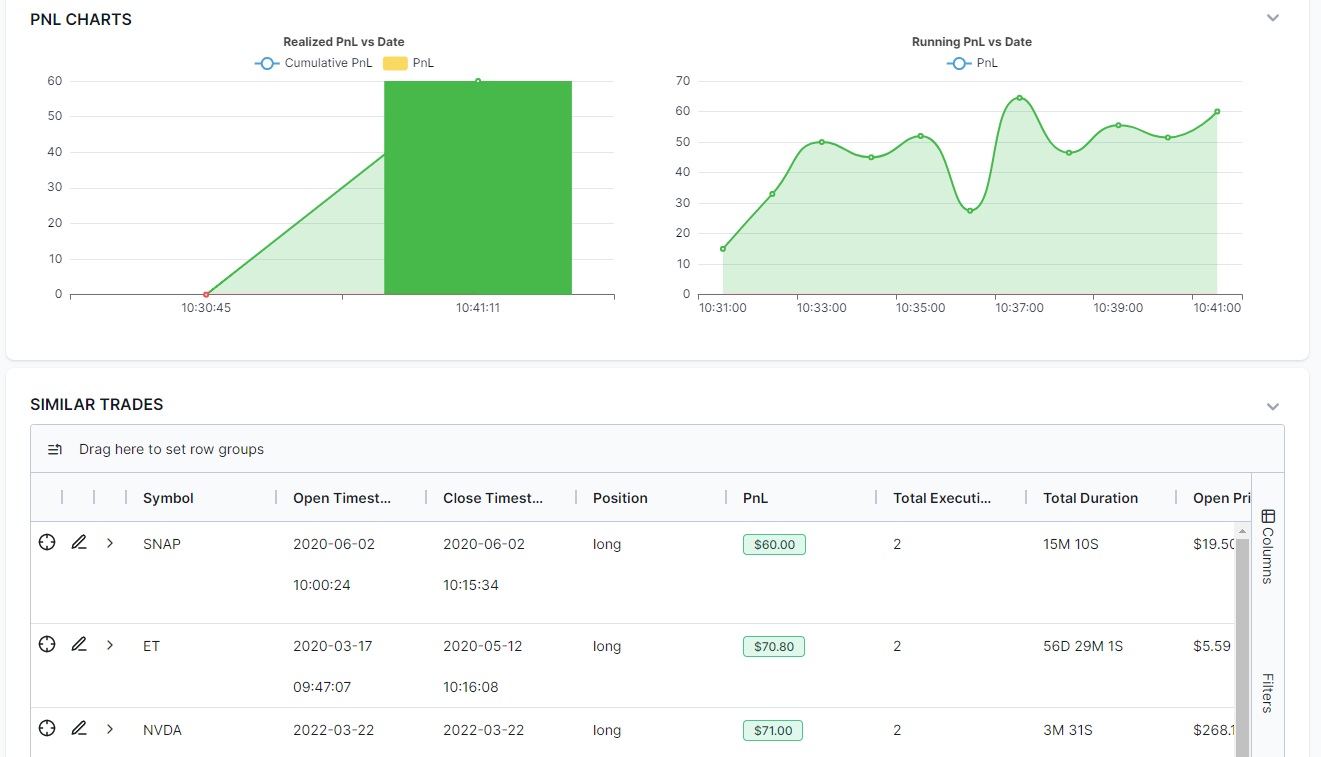
Finally, the last section is a list of similar trades based on the pnl of the current trade you are viewing. Think of this as "most like.." sections you would see on e-commerce or media websites like YouTube. It's a good way to quickly get a list of trades that you might want to explore.
This concludes the new trade explore section. Compared to the 2020 version, we have greatly improved the interface, usability, and utility of Trade Explorer. Compared to similar solutions for journaling when compared to TradesViz in 2020, there was no competition even close to what we had back then. The same remains true even in 2024. While the competitors and similar solutions have fallen behind, we have continually improved every aspect of our dashboard using user feedback.
We will soon release blog posts for other important tabs like for the day explore, calendar, and more using updated v2.0 screenshots and info. Meanwhile, we have already released videos about all of these tabs so please make sure to check them out.
June 2024 Update
You can now have a 100% custom trade explore tab using the customize option. This lets you select only the stats you need or be 100% custom and select and modify exactly where you want each widget to be placed. Learn more about this feature here: https://www.tradesviz.com/blog/customize-explore-tab/
Jan 2024 Update
We have renamed "Expected Return Value" to "Expected Profit" and added "Expected Loss" to increase the clarity of the presented stats. Expected profit (in $/currency amount) as the name implies is the profit expected from the trade based on open price, profit target, and quantity. Similarly, expected loss (in $/currency amount) is the maximum loss expected based on open price, stop loss, and quantity. Both of these columns are also available in the trades table grid for filtering and further analysis. They can also analyzed via the AI Q&A feature now.