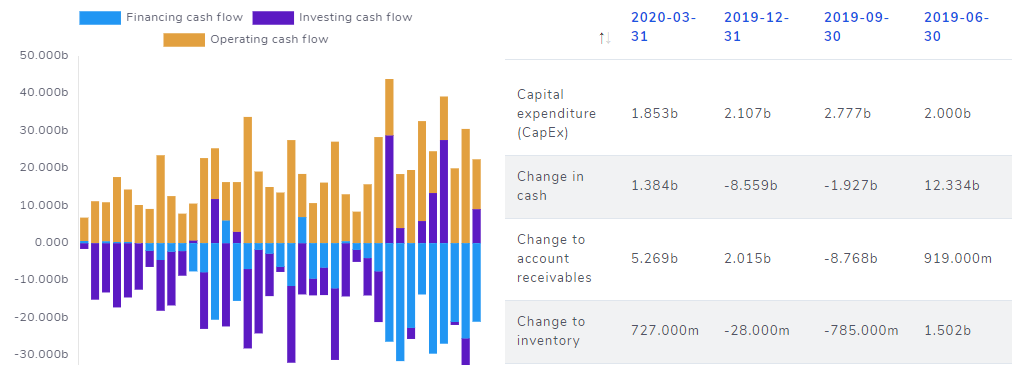
TradesViz fundamentals brings stock fundamental analysis directly into your trading journal. You can research the company behind a ticker, review its financial statements, compare valuation and financial health, check earnings and analyst expectations, review ownership, and connect that context back to the trades you are already analyzing in TradesViz.
Fundamental data is available to all TradesViz users, including free users. It is not a separate paid research terminal. It is built into the TradesViz workflow so every trader can quickly understand the business behind a stock before, during, or after reviewing a trade.
We support fundamentals for the markets and countries supported in TradesViz: United States (US), Canada (CA), India (IN), and Australia (AU). If data is available for the symbol, you can open the fundamentals page and review the company in a clean, visual format.
How To Access Fundamental Data
You can open fundamentals from multiple places in TradesViz. This is intentional: the tool is integrated into the platform, not isolated from your journal.
1. From The Dashboard App Drawer
Click the apps/grid icon in the top right corner of your dashboard and select Fundamental Data. This opens the standalone fundamentals page where you can search for any supported symbol.
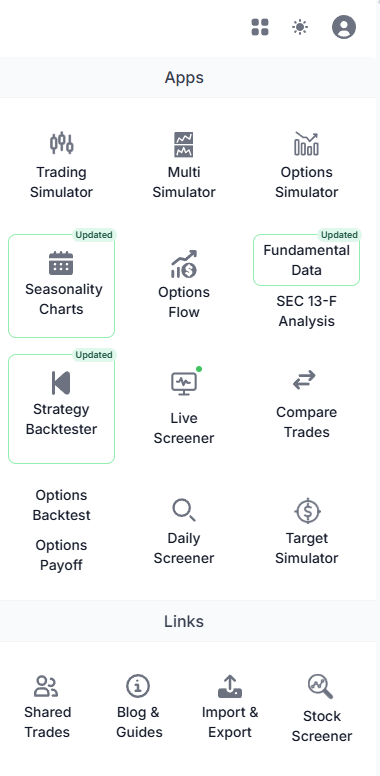
This is the best entry point when you want to research a symbol directly, without starting from a specific trade.
2. From Trade Explore: More > Fundamentals
When you are reviewing a specific trade in Trade Explore, open the More menu and click Fundamentals. TradesViz will open the fundamentals page for the trade's underlying stock.
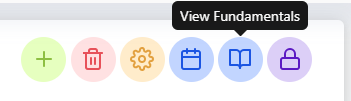
This is useful when you are reviewing a trade and want to know whether the company context supported or contradicted the setup. For example, you can quickly check earnings growth, revenue trends, debt levels, valuation, or recent analyst estimate changes for the same symbol you traded.
3. From Trades Chart: Fundamentals
You can also open fundamentals from the Trades Chart page. Enter or select a symbol, then choose the Fundamentals tab beside Seasonality and Options Flow.

This access path is useful when you are charting your trades and want market research beside the same symbol context. You can move from chart review to fundamentals without copying tickers into another tool.
You can also go directly to a symbol page, for example /fundamentals/AAPL.US, and then use the symbol selector at the top of the page to switch symbols.
Fundamentals Page Overview
The fundamentals page starts with a symbol selector, company header, market summary, navigation tabs, key stats, latest reported quarter, and a price chart. This top section is designed to answer the first question quickly: what company am I looking at, and what is the current market context?
Use the top section to confirm the ticker, exchange, company name, sector/industry, reference price, market cap, 52-week range, and beta. For US stocks, you can also jump to the company website, SEC 10-K, and SEC 10-Q links directly from the header.
The quick metric cards show high-level valuation and trading context such as trailing P/E, forward P/E, dividend yield, short interest, and moving averages. The latest reported quarter area summarizes important recent changes like revenue, diluted EPS, gross margin, operating margin, free cash flow, and diluted shares.
Earnings And Estimates
The earnings and estimates section helps you understand what the market expected, what the company reported, and how analyst expectations are changing.
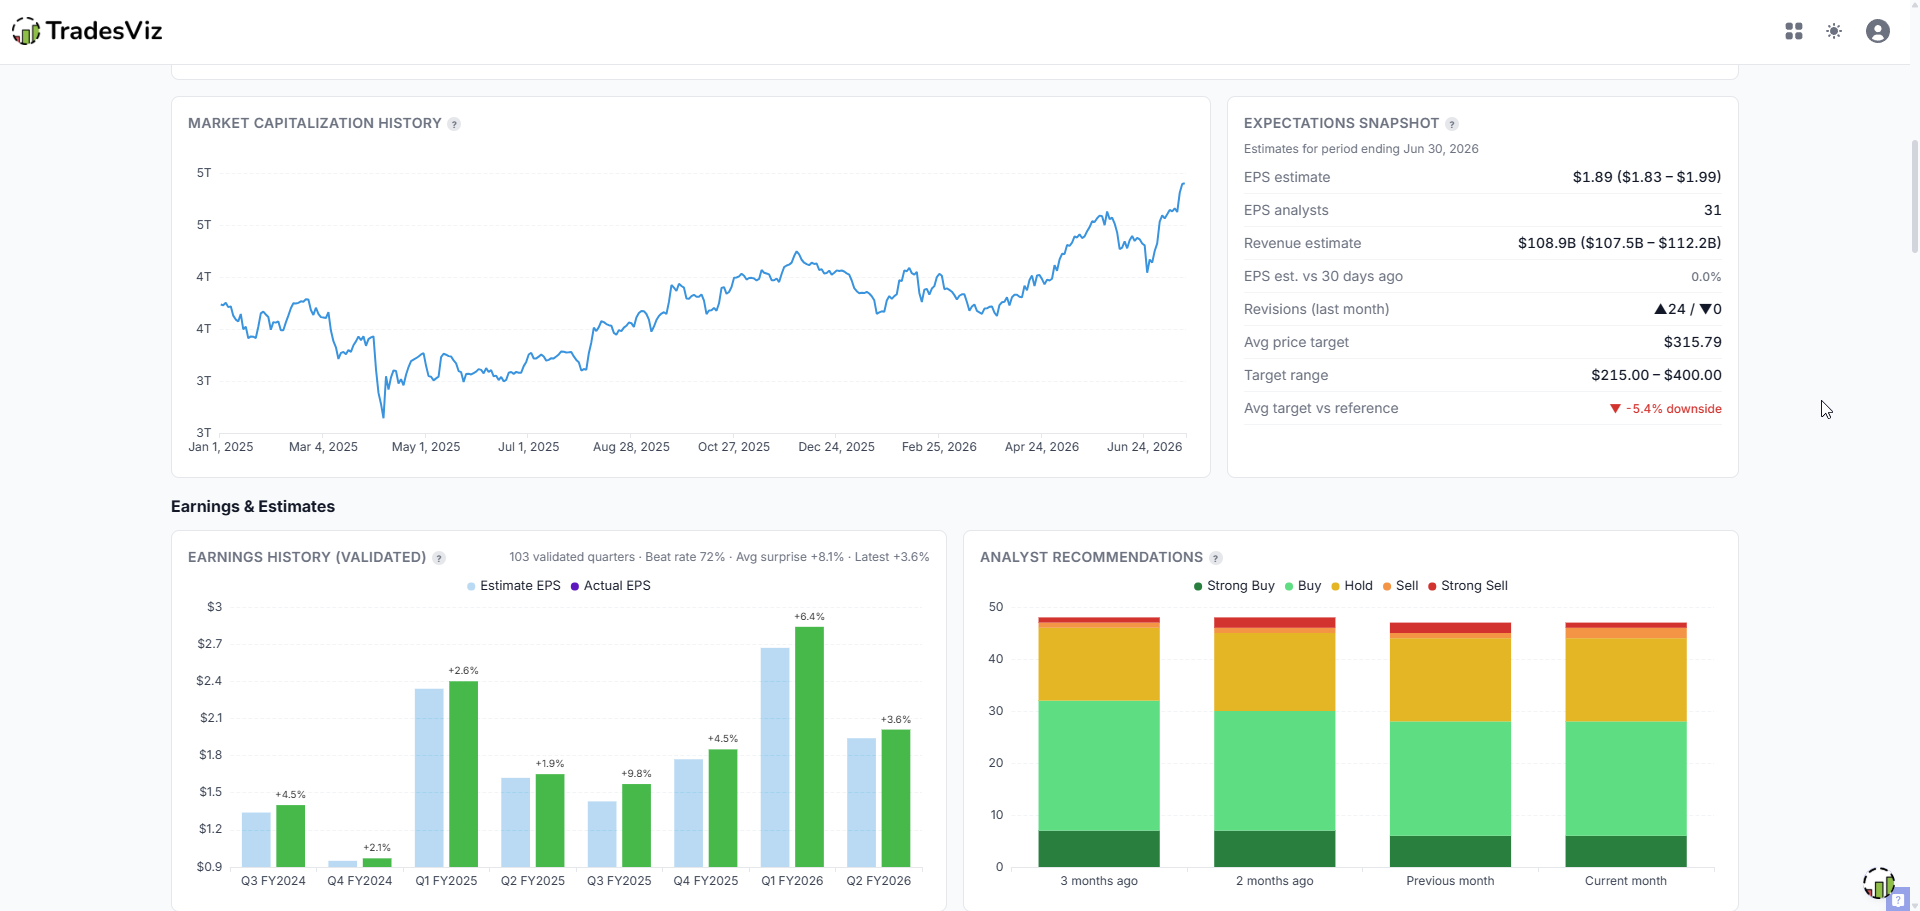
The market capitalization history chart shows how the company's value has changed over time. Beside it, the expectations snapshot summarizes upcoming EPS and revenue estimates, analyst count, revisions, average price target, target range, and whether the current reference price sits above or below the average target.
The earnings history chart compares estimated EPS with actual EPS. This makes it easier to see whether the company has been beating or missing expectations, and whether surprises are consistent or unusual. The analyst recommendations chart shows how the mix of Strong Buy, Buy, Hold, Sell, and Strong Sell ratings has shifted recently.
The analyst price targets section shows low, median, average, high, and reference price values in one view. The EPS and revenue estimates table separates next quarter, current year, and next year expectations. The estimate momentum and revisions table shows whether estimates are improving or weakening across 7-day, 30-day, 60-day, and 90-day windows.
Use this section when you want to understand the expectation side of a stock. A chart setup may look strong, but earnings revisions, revenue expectations, or price target context can help explain why a stock is moving or why it may be under pressure.
Financial Trends
The financial trends section turns raw financial statement data into charts that are easier to scan. You can switch between Quarterly and Annual views depending on whether you want recent detail or a longer-term business trend.
The revenue and diluted EPS chart helps you see whether sales and earnings are expanding, flattening, or contracting. The margins chart shows gross margin, operating margin, net margin, and free cash flow margin, which can highlight changes in business quality and profitability.
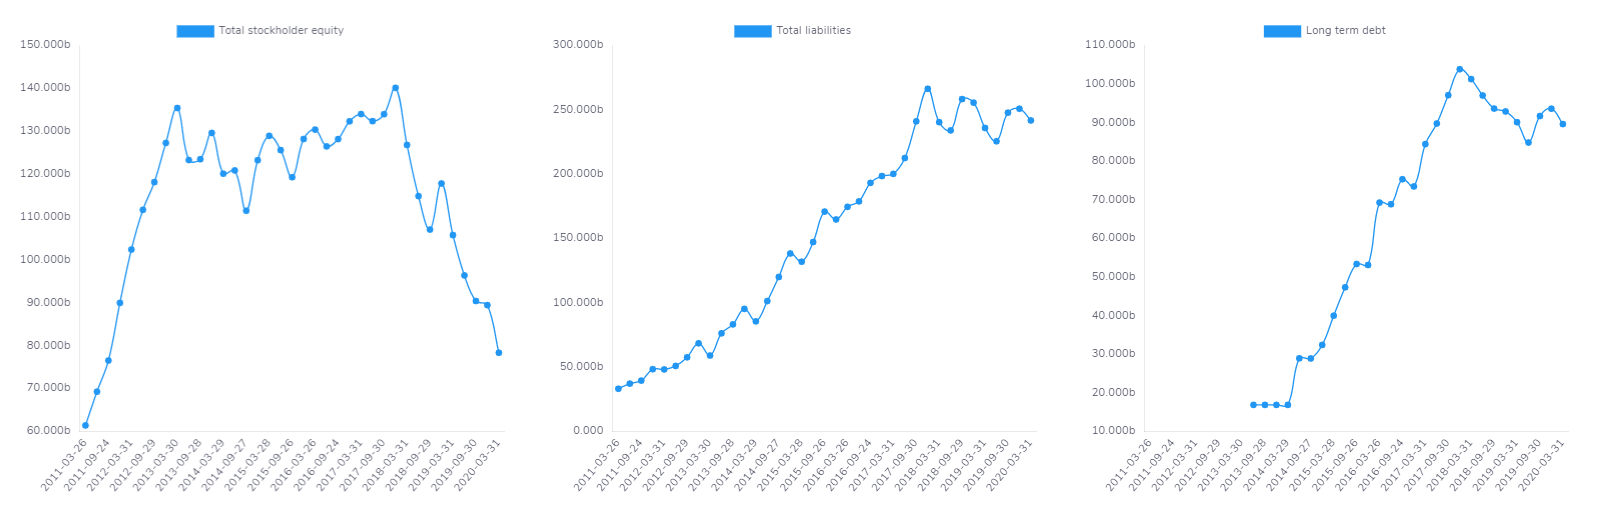
The cash generation chart compares operating cash flow, free cash flow, and capital expenditure. This is useful because earnings alone do not always tell the full story. The cash, debt, and net debt chart helps you understand whether the company has financial flexibility or is carrying increasing debt pressure.
Use this section for trend validation. Instead of reading many rows of data first, scan the charts and ask: are revenue, earnings, margins, cash flow, and debt moving in a healthy direction?
Valuation, Financial Health, And Statements
The valuation and financial health section gives you a compact view of important ratios and balance-sheet measures. The statements table below it gives you the detailed numbers when you want to verify the source data.
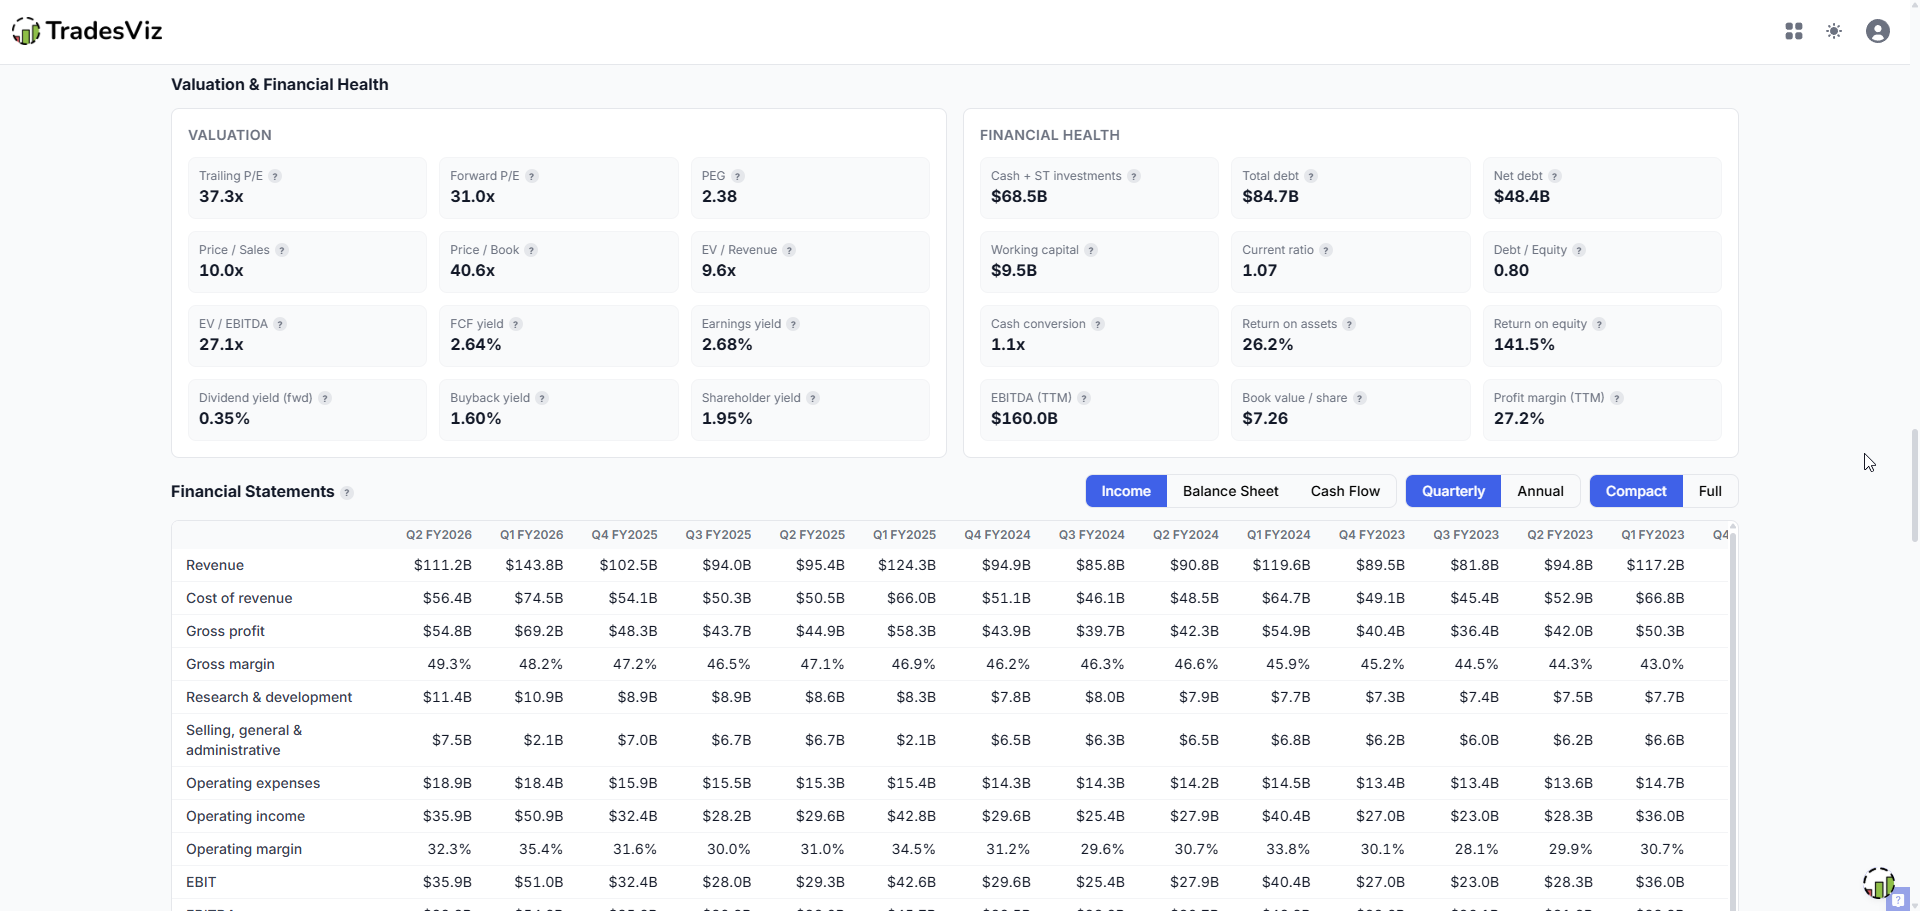
The valuation cards include metrics such as trailing P/E, forward P/E, PEG, price/sales, price/book, EV/revenue, EV/EBITDA, free cash flow yield, earnings yield, dividend yield, buyback yield, and shareholder yield. These can help you compare a stock's price against earnings, sales, book value, cash flow, and shareholder returns.
The financial health cards show values like cash and short-term investments, total debt, net debt, working capital, current ratio, debt/equity, cash conversion, return on assets, return on equity, EBITDA, book value per share, and profit margin. Use these to quickly evaluate whether the company looks financially strong, stretched, efficient, or capital intensive.
The financial statements table lets you switch between Income, Balance Sheet, and Cash Flow. You can also toggle Quarterly or Annual and use Compact or Full mode depending on how much detail you want. Use the table when you need exact period-by-period numbers instead of chart summaries.
Ownership And Insiders
The ownership and insiders section helps you understand who owns the stock and what insiders have recently reported.
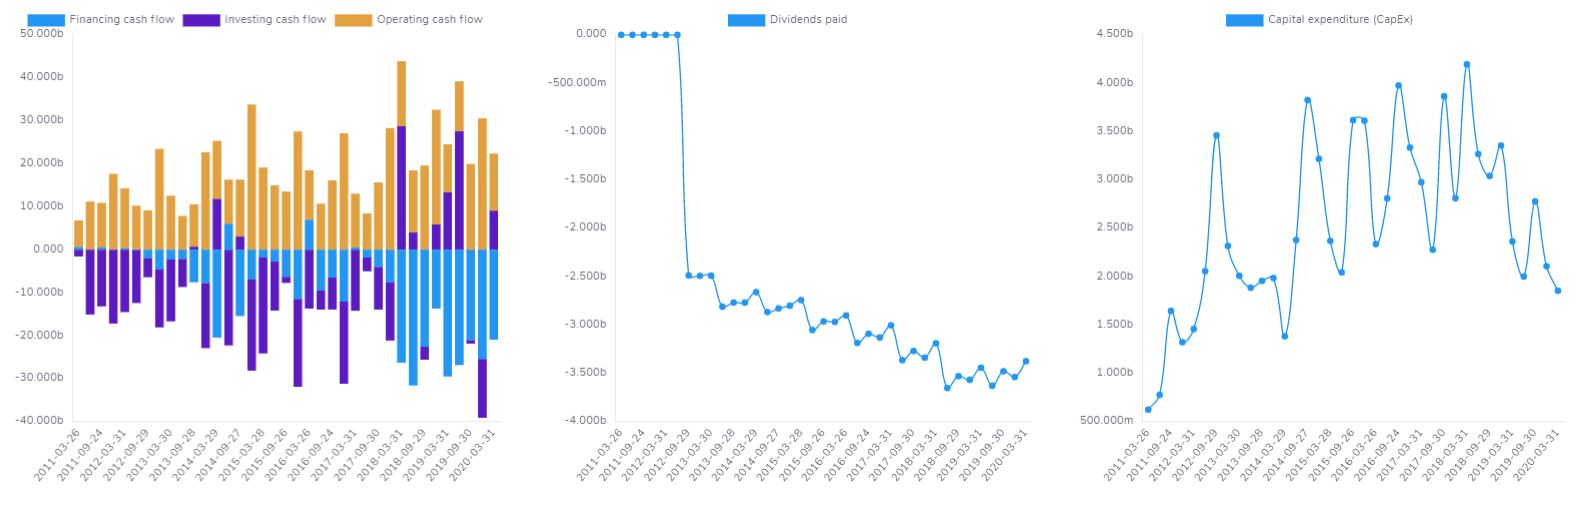
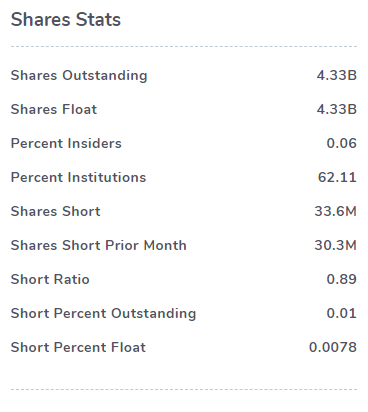
The top cards show insider ownership, institutional ownership, float, shares short, short percentage outstanding, and short ratio. The institutional and fund holder tables list major holders, shares, percent held, reported dates, and related values where available.
The insider transactions table shows recent insider activity with date, insider, position, transaction type, shares, value, and whether the transaction was direct or indirect. This is not a standalone buy or sell signal, but it is useful context when combined with price action, earnings, valuation, and your trade notes.
Dividends, Splits, And Company Details
The dividends and splits section is useful for income-focused traders, longer-term investors, and anyone reviewing historical price behavior around corporate actions.
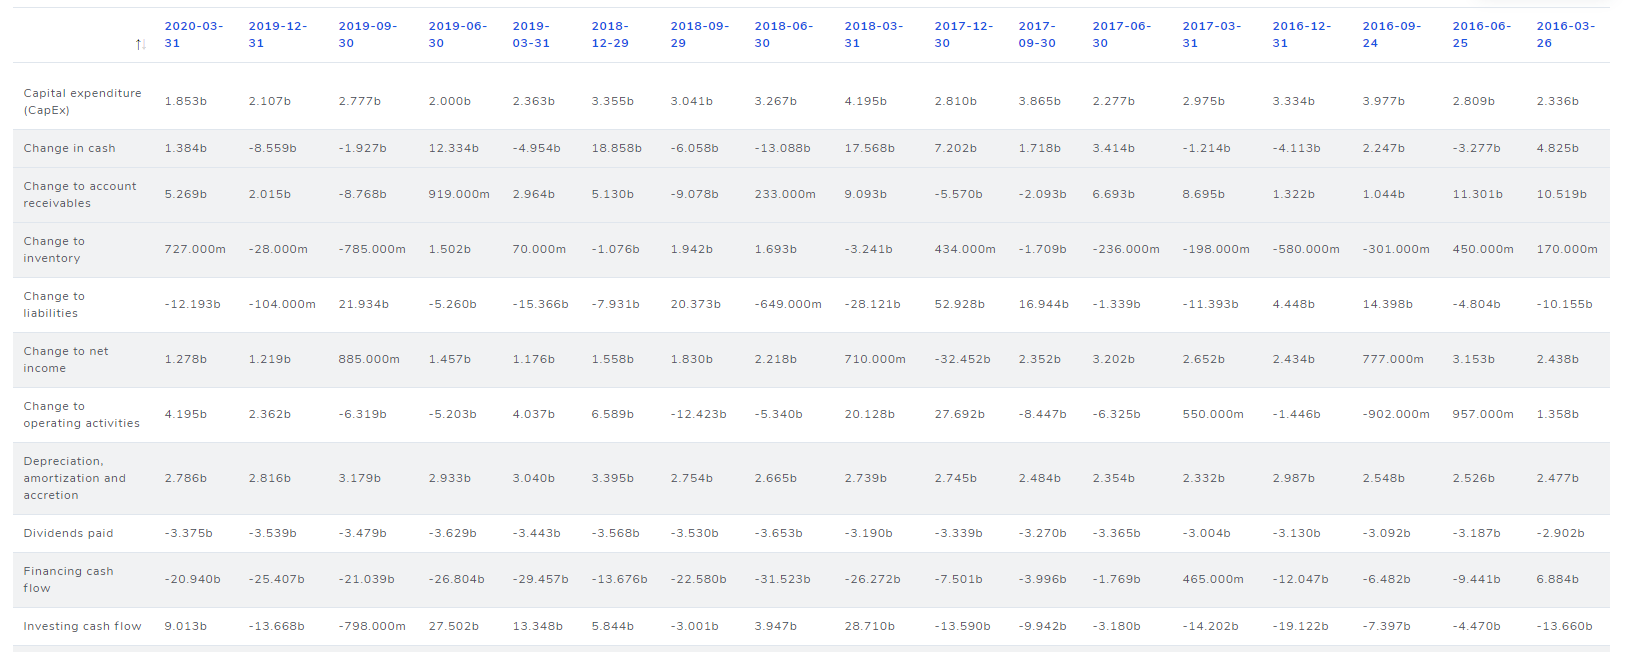
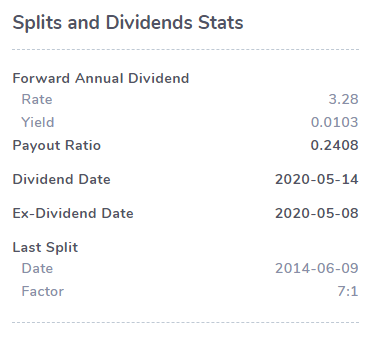
The dividend cards show forward annual dividend, forward yield, trailing annual dividend, trailing yield, payout ratio, latest ex-dividend date, and latest payment date. The dividend history chart shows how payments have changed over time, and the split history table lists past stock splits.
The company section explains what the business does and provides basic profile data such as sector, industry, employees, headquarters, phone, security type, exchange, and CEO. Use it to quickly understand the company before you trade the ticker. This is especially helpful when a symbol appears in a screener or chart and you want to avoid trading something you do not understand.
The key executives table gives you a quick look at leadership roles, ages, and compensation data where available. It is not the first place most traders will start, but it completes the company profile and can be useful for deeper research.
How To Use Fundamentals In Your Trading Workflow
Fundamental data is most useful when it is used as context, not as an isolated prediction tool. In TradesViz, it is connected to your journal so you can move from a trade to the company's fundamentals, then back to your trade review without losing the symbol or workflow.
- Before taking a trade: check revenue, EPS, margins, cash flow, debt, valuation, and upcoming expectations to understand the quality and risk profile of the company.
- During trade review: open fundamentals from Trade Explore and compare the trade outcome with the broader company context. Was the stock reacting to earnings, estimate revisions, short interest, or valuation pressure?
- When building watchlists: use the symbol selector and fundamentals tabs to compare companies across the US, CA, IN, and AU markets supported by TradesViz.
- When reviewing longer-term positions: focus on annual and quarterly trends, dividend history, financial health, ownership, and statement-level changes.
- When studying mistakes: add notes about whether you ignored important fundamental context. Over time, this can help you identify whether you trade better with or without certain types of fundamental filters.
The main benefit is accessibility. You do not need to leave your journal, open another research tool, search the same ticker again, and rebuild context manually. Fundamentals, chart review, trade review, seasonality, options flow, and other TradesViz tools are designed to work together.
Free Fundamental Data For All TradesViz Users
TradesViz fundamentals is available for all users, including free users. That means every trader can access company research tools inside the same platform used for journaling, charts, reports, and trade review.
For supported markets - US, Canada, India, and Australia - the goal is simple: make company fundamentals easy to access, easy to understand, and useful inside your actual trading process. You can quickly see what matters, open the details when needed, and connect company data to your own trades.
We will continue improving fundamental data in TradesViz. If you have suggestions for additional metrics, sections, countries, charts, or workflows, send us your feedback at [email protected].