TradesViz since its launch in 2019 has become one of the most favored and liked journals in the world among traders from many countries. We've made strides in the journaling world that have become the standard in the business for other competitors to follow. The features and utility we have are still unbeaten by any other competitor. All of this is due to our obsession with delivering maximum value to our users.
With this massive revamp, that is no longer the case.
We have completely rebuilt the front end of TradesViz to reflect modern design standards whilst greatly improving utility and ease of use.
Welcome to TradesViz v2.0
This is a completely new era of TradesViz where we focus on ease of use, and simplification of UI/UX all while not removing a single feature from the original TradesViz dashboard.
"This is long overdue" - is what many users tell us and we're excited to finally share our update with you!
How to switch to the new dashboard?
Click on the new Star button in your current TradesViz dashboard and confirm the change. Alternatively, you can go to your account settings and check the "Use TradesViz v2.0 home dashboard?" option.
What's our goal with this?
Make sure users from all backgrounds who come into trade journaling have an easy experience and are not daunted by the learning curve or the design.
Using the latest design libraries and principles to serve as the foundation for the upcoming years of updates and features in TradesViz.
Focusing on usability on different screen sizes as Desktop or laptops are longer the only devices that journals are viewed on now.
Efficiency and clarity of features: Making sure every important feature is within just a few clicks and the entire dashboard is even easier to navigate and customize.
Massively improved charting and tabular experiences: The bread and butter of any analytics software - charts and tables. These elements are now powered by the world's best tools to give the users of TradesViz a vastly better experience compared to ANY other journaling competitor. These upgrades include massive speed boost, utility increase, and new dimensions of flexibility of how you want to view and visualize your data.
This is not just an update; it's a foundation for all future enhancements to TradesViz.
What are the improvements and changes?
First, we want you to understand the following:
- You have the flexibility to switch back to the old dashboard anytime via account settings.
- The new dashboard will be the platform for all future features on TradesViz.
- We are actively seeking your feedback and feature requests to further enhance the new dashboard.
- Rest assured, none of your data will be lost, changed, or modified in any way. This upgrade is purely a visual enhancement, not a functional change.
- Currently, only the main dashboard has been revamped. We are diligently working on other pages (import/export, settings, simulator, etc.,) and aim to complete the entire TradesViz revamp in the coming month!
- We have preserved the originality of our core features and their functionality - the charts, notes, AI queries, tables, etc.
- New guides, videos, blog posts, etc., will be posted soon to assist you with the transition.
Simply put, you have nothing but great new features and a FAR better experience waiting for you with ZERO downsides once you start using the new dashboard. We are still keeping the old dashboard active until we complete the revamp process for the other parts of TradesViz.
OK!
Complete Tour:
The short video below will show you a complete tour of the new dashboard with all the new tables/charts and improved UI elements. We will explore the changes and what has improved specifically in the sections below (The video is in 2x speed!).
Overall Dashboard Layout:
Far fewer buttons
With the use of the dropdowns and usage-based rearrangement of tabs on the left, we've greatly de-cluttered the dashboard. This is one of the main complaints of new traders seeing our old dashboard - that it was complex. It was not a problem for existing users as we added those features/buttons one by one over time. But when you are new, you get the impression that are dealing with something complex when the reality is far from it.
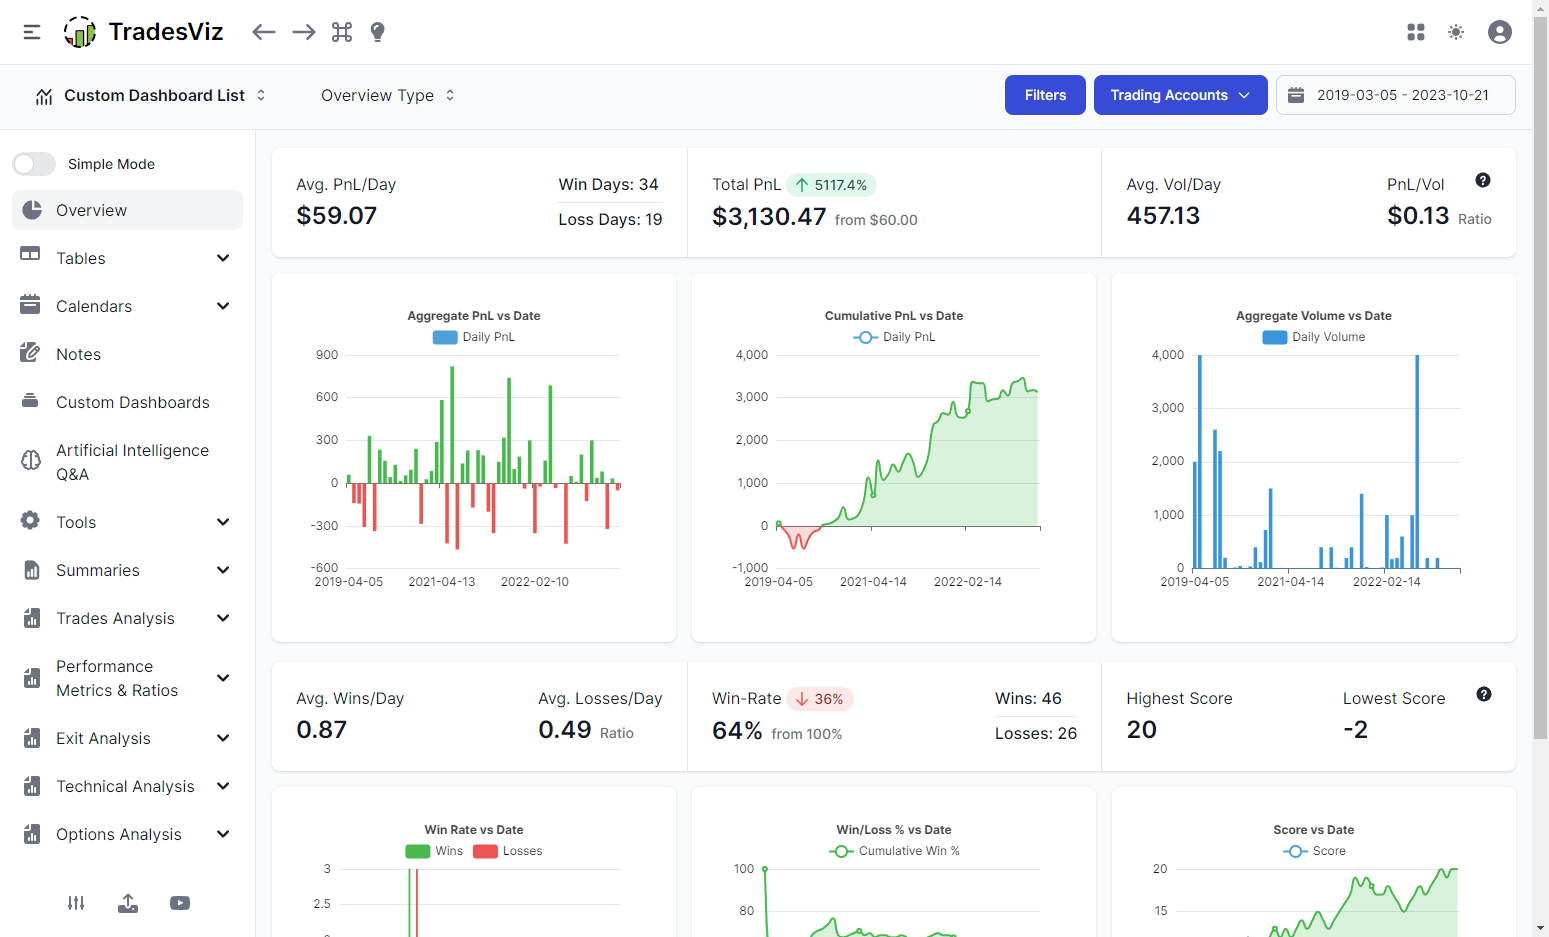
The most essential elements: filter button that opens a filter drawer, trading accounts, date range. These are the most frequently used buttons and they are staying exactly where they were in our old dashboard.
More utility via dropdowns
Where are all the shortcuts, you ask? Don't worry! We've still retained all of them and added more via the application and function dropdowns on either side of the top nav bar:
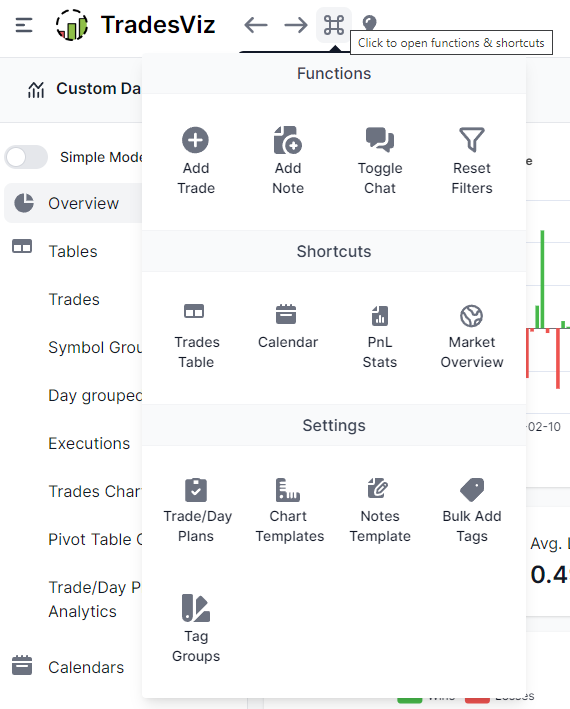
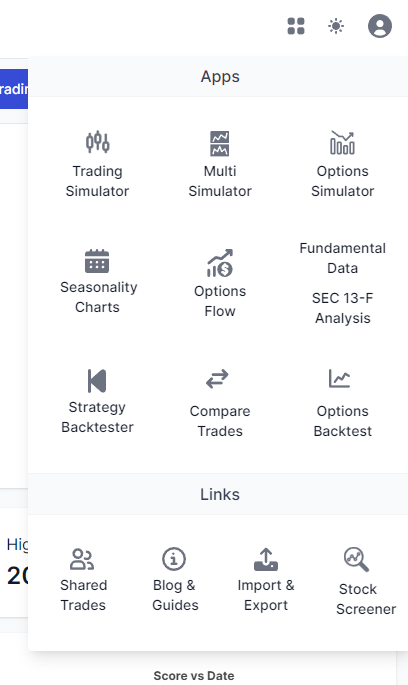
You can now even access some functions from the account settings via the functions dropdown. All the special features such as simulator, seasonality, fundamentals, backtester (coming mid nov 2023), options flow, compare trades, etc., are all now moved to the application drawer (4 box icon) in the top right corner.
Easy access to the custom dashboards/multiple overview pages
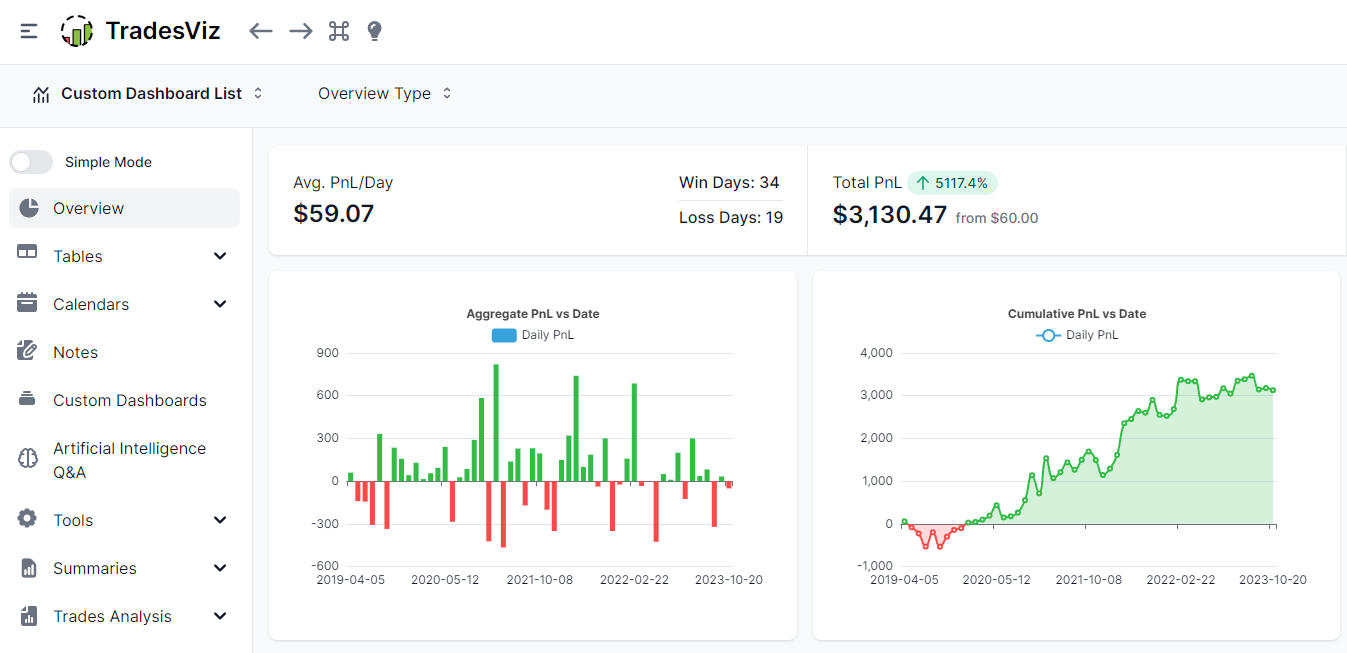
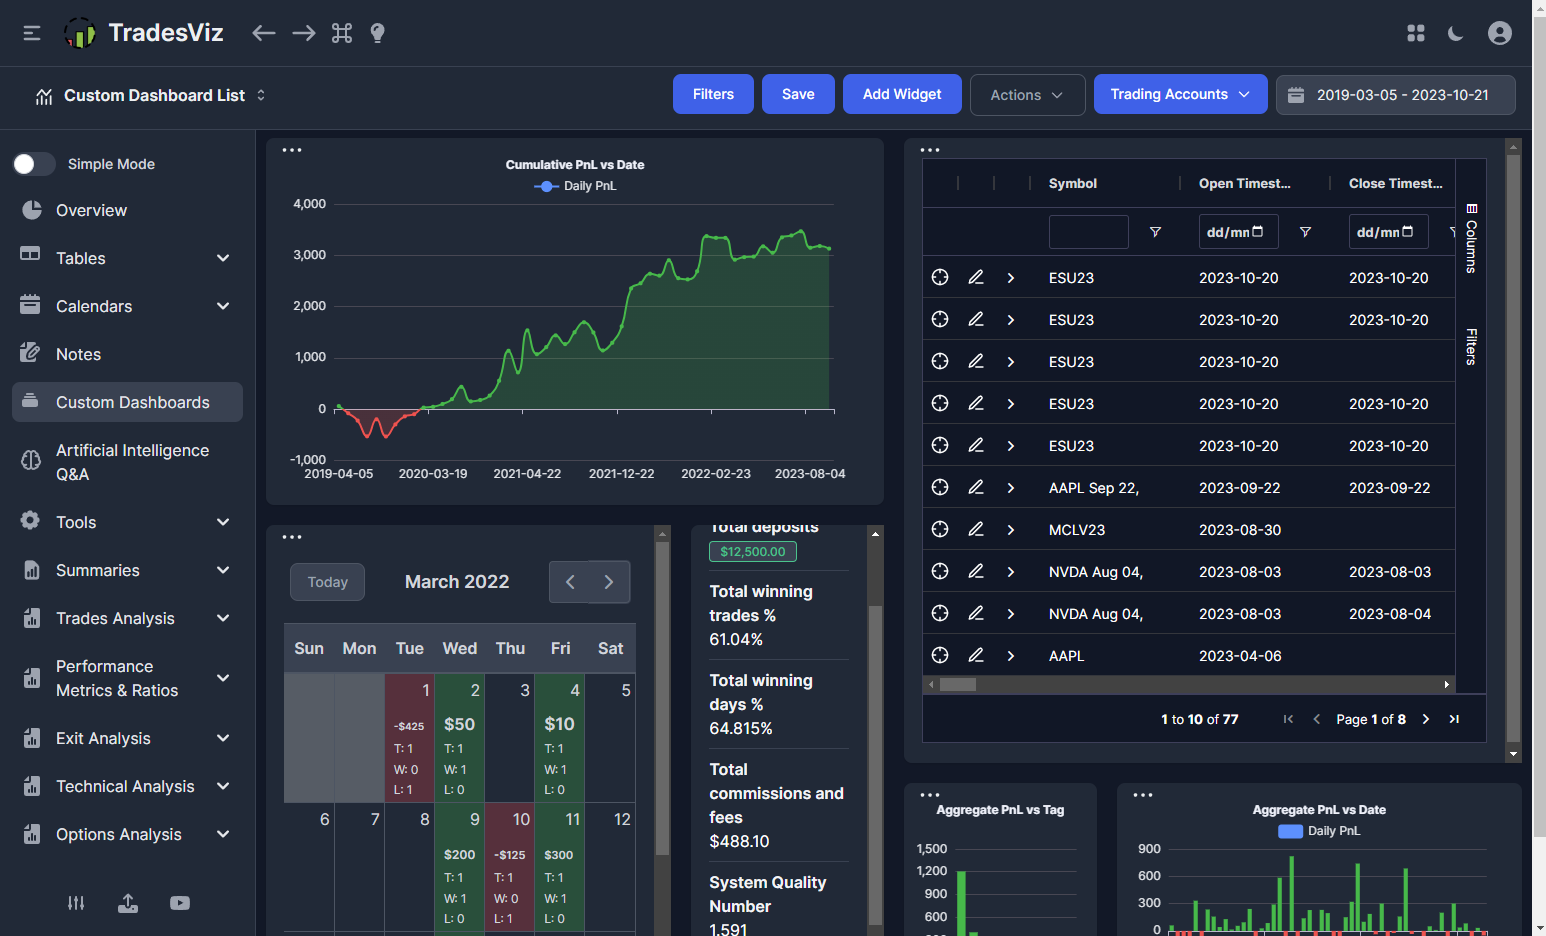
If you noticed in the overview page screenshot, you will see that we have dedicated buttons for custom dashboards and also one for selecting the overview type. This is new.
Since the custom dashboard is one of our most used features and seeing how users frequently switch between it, we wanted to have a way to get to the custom dashboard AND set them as the home page in just a couple of clicks.
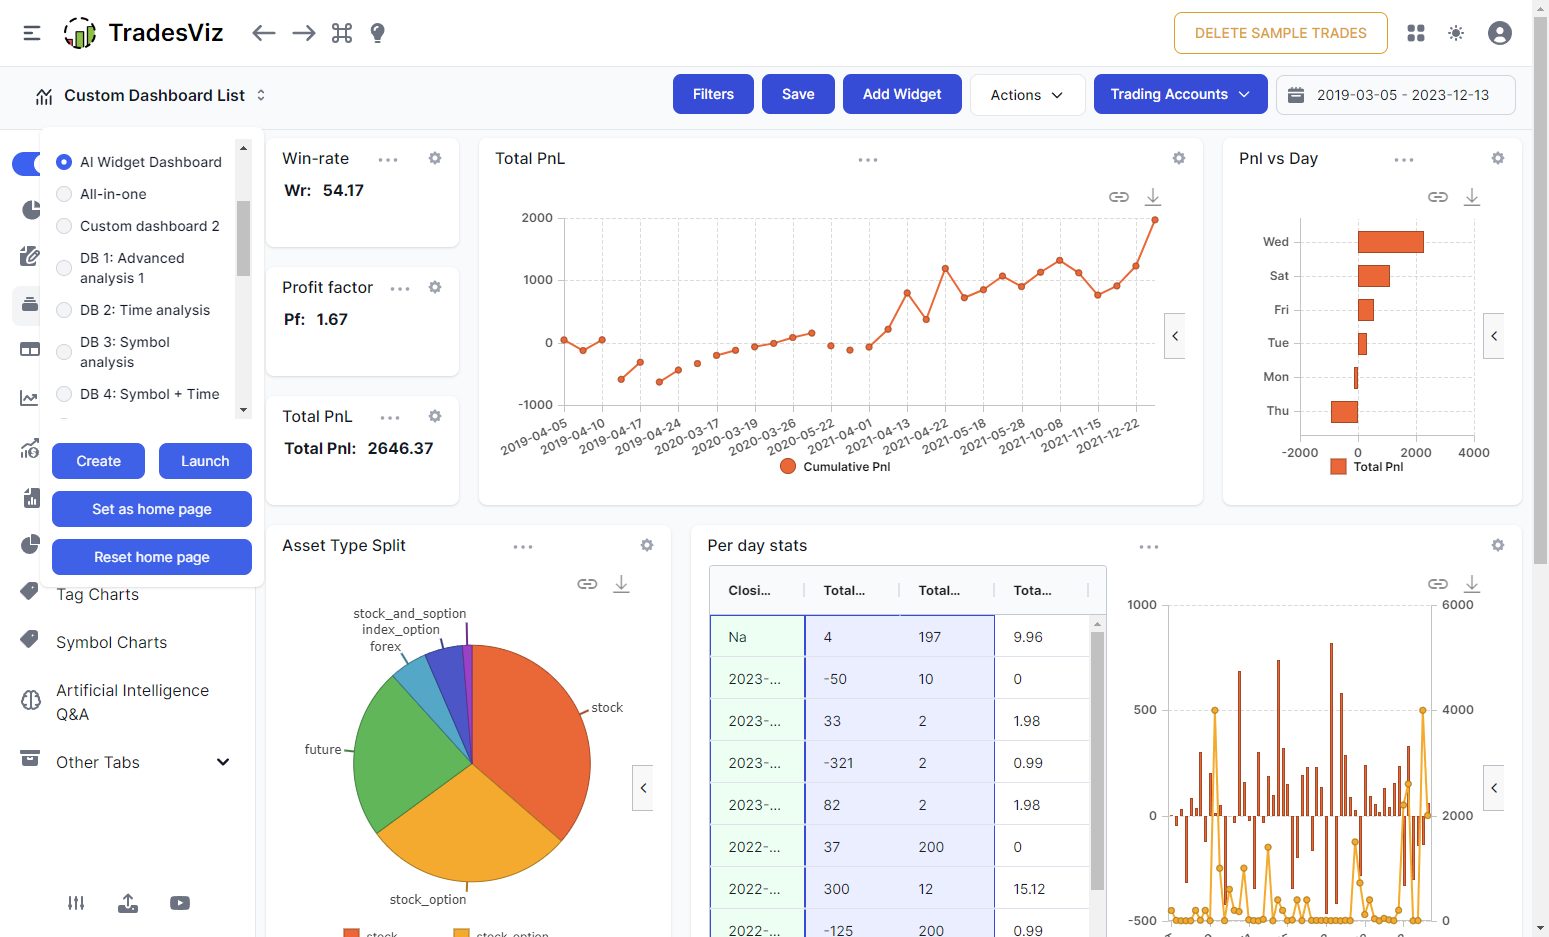
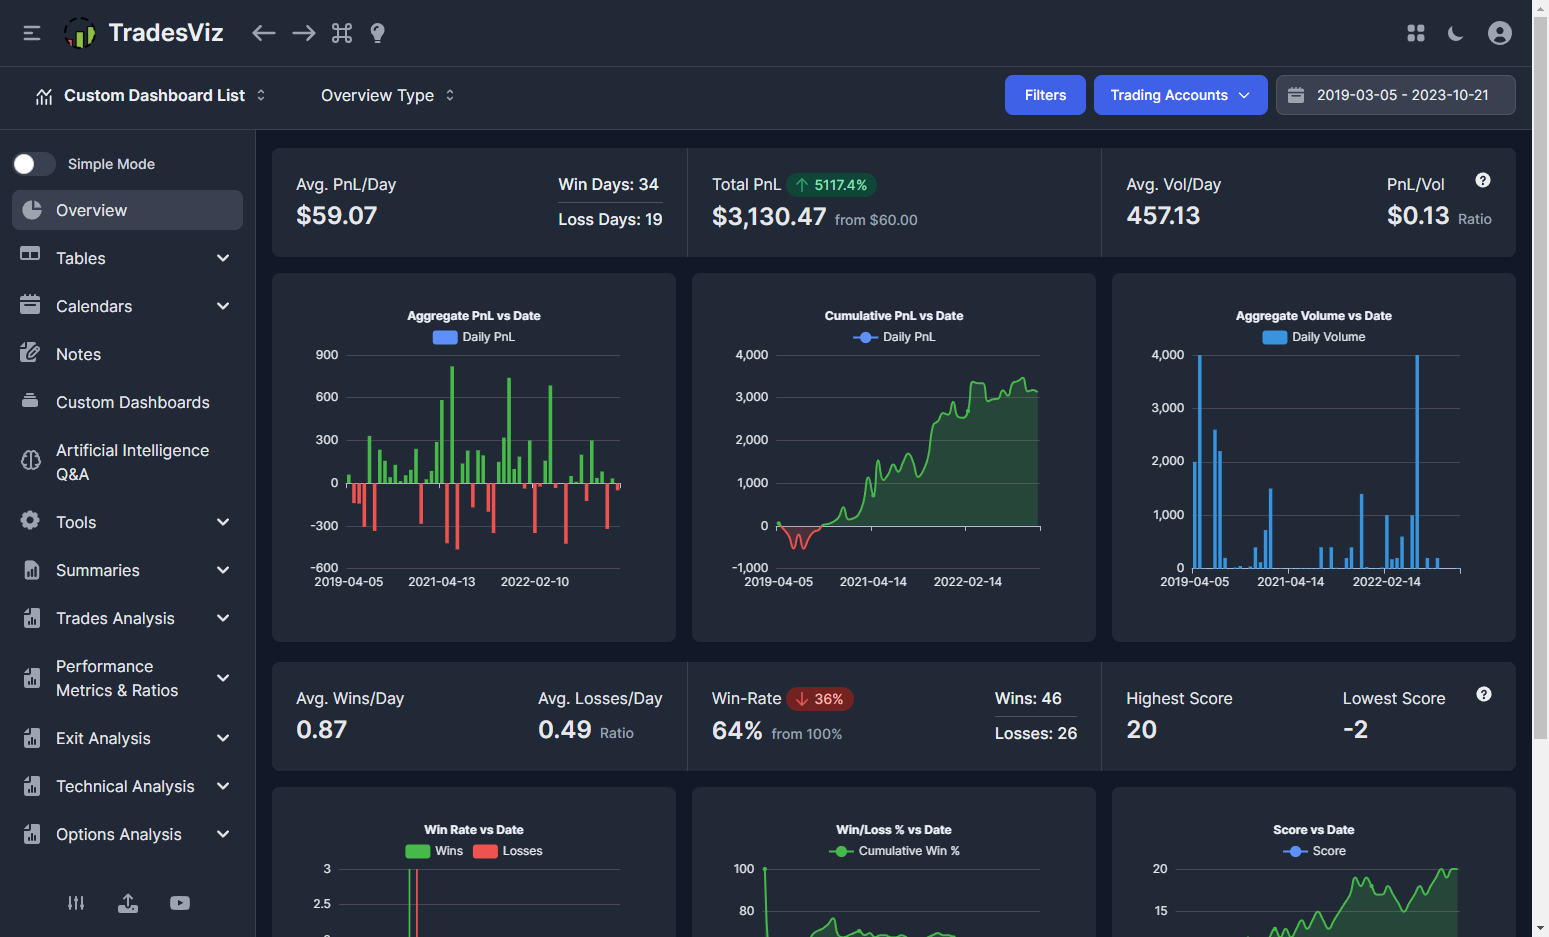
The new feature here is the overview. We noticed some users were initially reluctant to try the custom dashboard, but still wanted choices on what the default view was. This is our answer/solution:
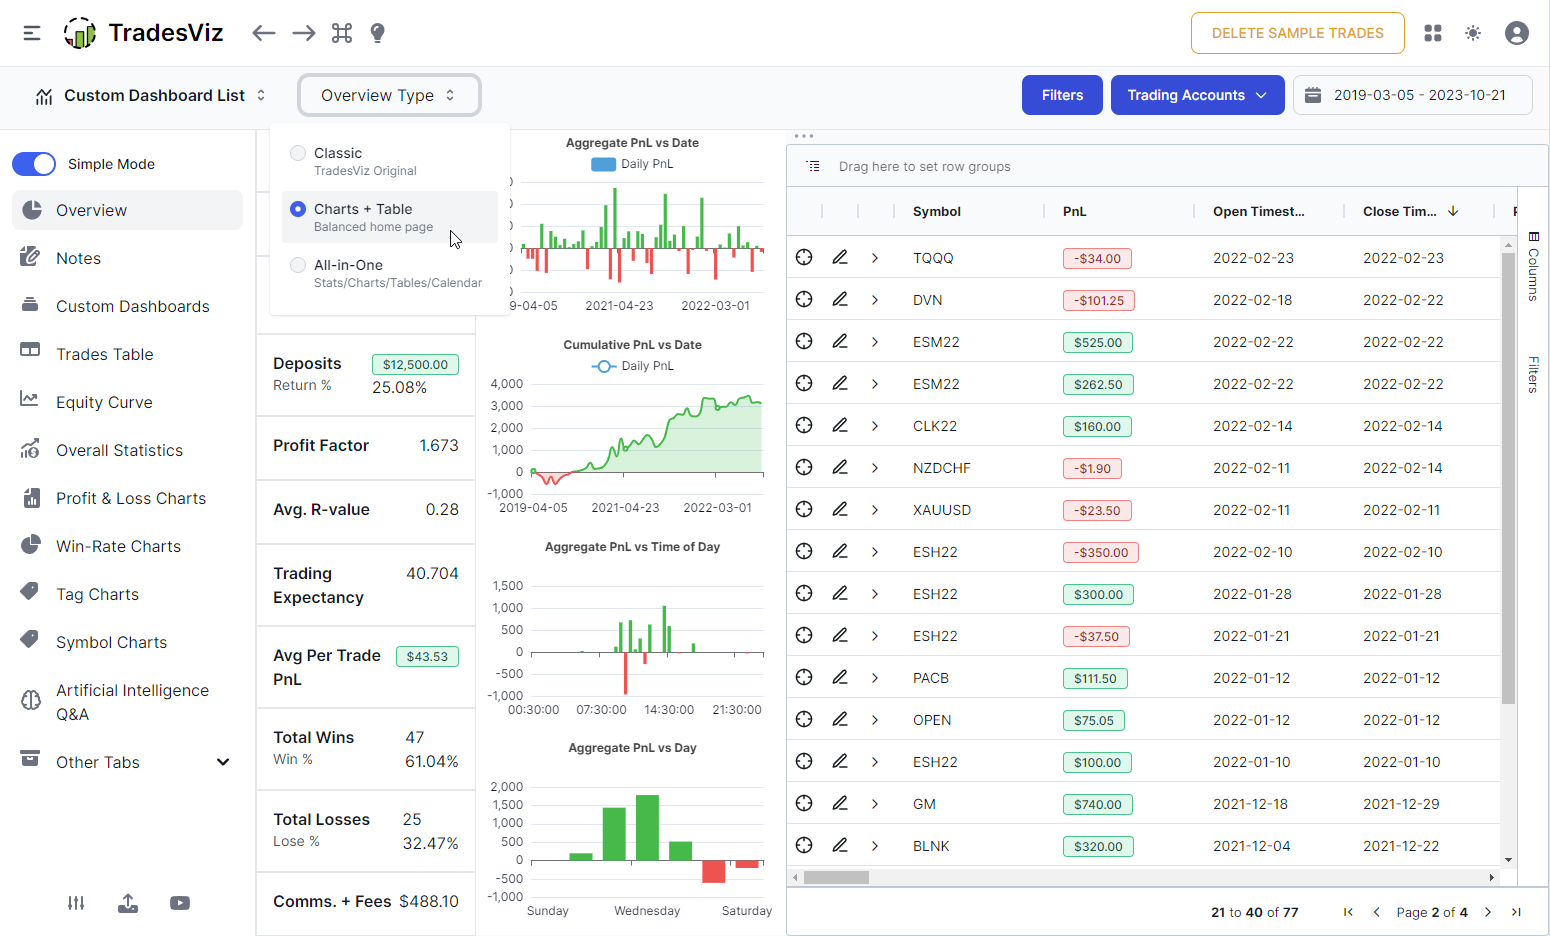
3 new overview types - the classic, charts+table, all-in-one (charts + tables + calendar). This is a great way to start off your customized journaling journey if a custom dashboard seems too complex for you. Moreover, we will also try to add more overview alternatives in the future based on your feedback!
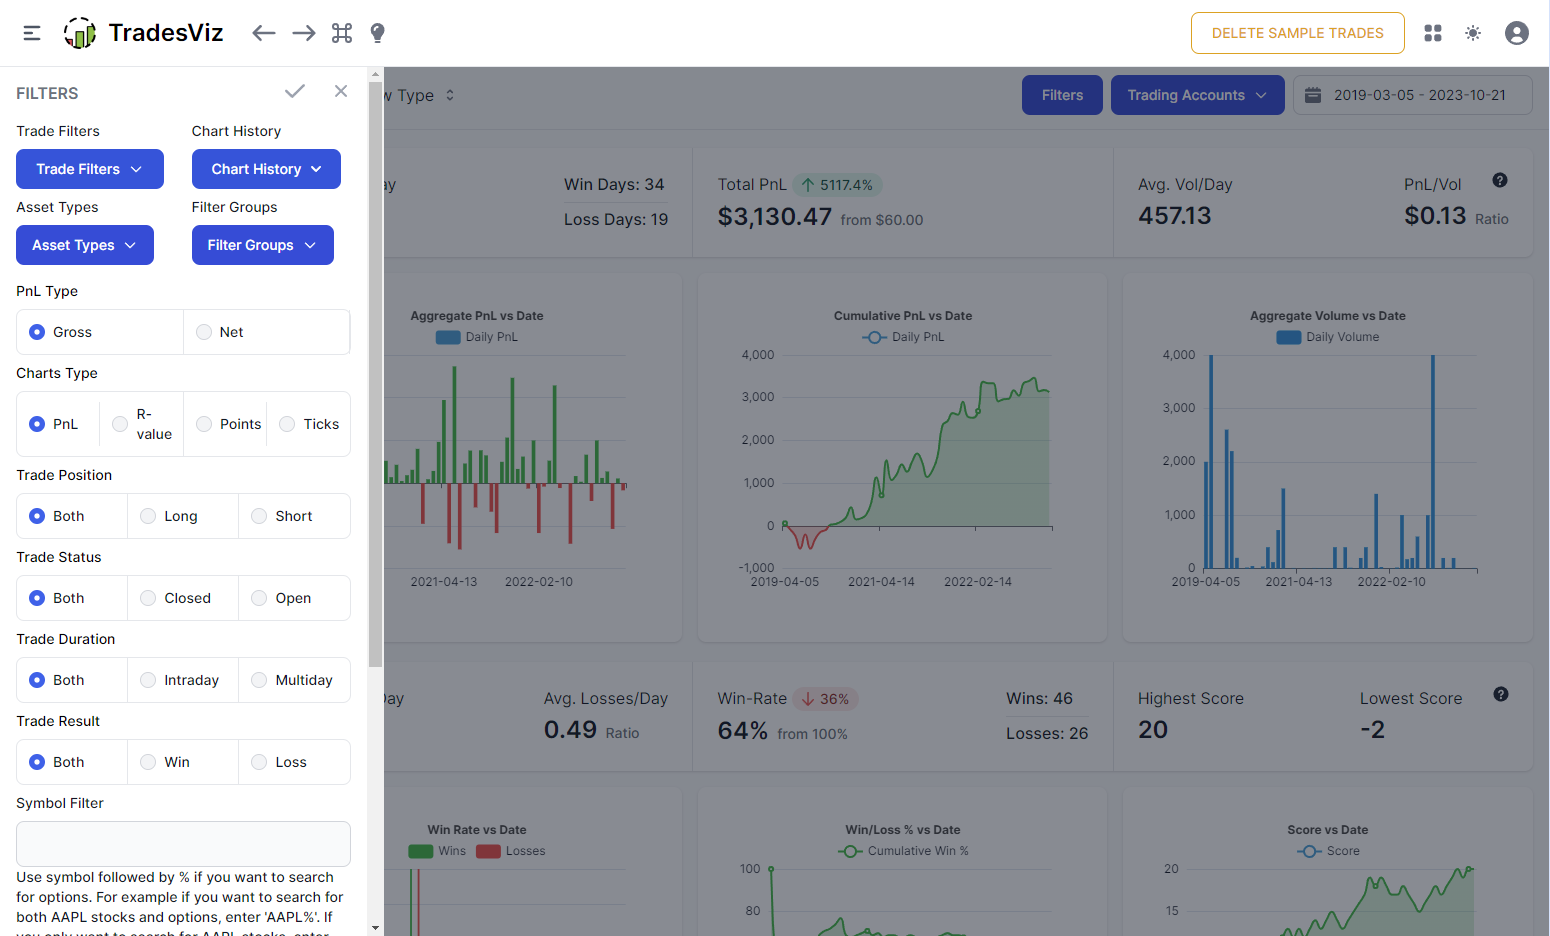
Improved filters section
Clicking on the filters will no longer open a cramped popup, but rather a drawer/sidebar on the left side of the screen. This has ALL the original filter settings + room to add more without responsive issues. This also works on ALL devices seamlessly - no more zooming in/out or switching to landscape mode on mobile. When the screen is smaller, all the buttons like date, trading account selection automatically go inside the filters drawer.
Reorganized sidebar for efficiency in access + Simple mode
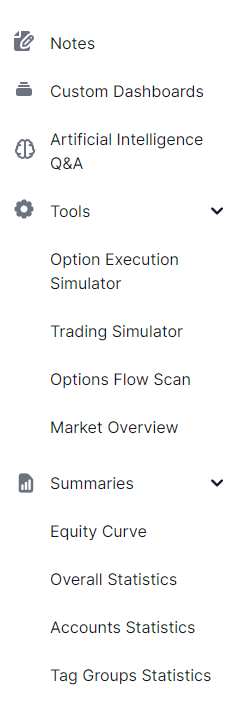
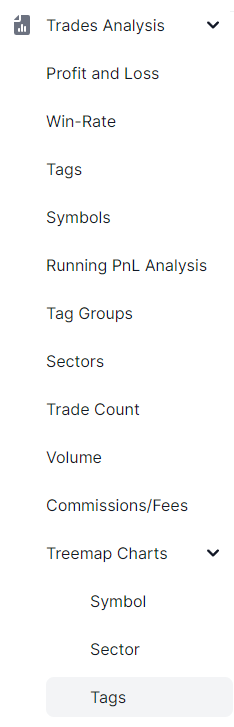
You might have noticed that the order of the tabs in the sidebar has now changed. Over the course of 3 years, we have added around 20 unique tabs. A reorganization was warranted to make access more efficient. Here's how it looks now with all the tabs expanded:
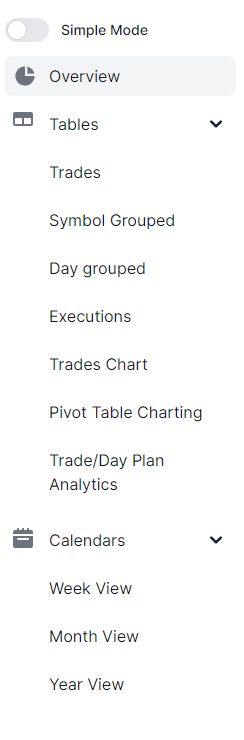 |
 |
 |
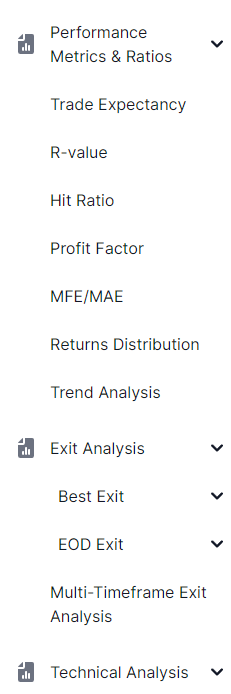 |
As you can see the charts, summaries, and tables are all grouped together because we found these to be frequently visited together from user feedback. This should no longer cause any confusion regarding where specific tabs are located. The only missing tabs are that of Tradier trading (which will be implemented last) and grouped compare charts which we may implement as we saw very little to no usage for that particular chart.
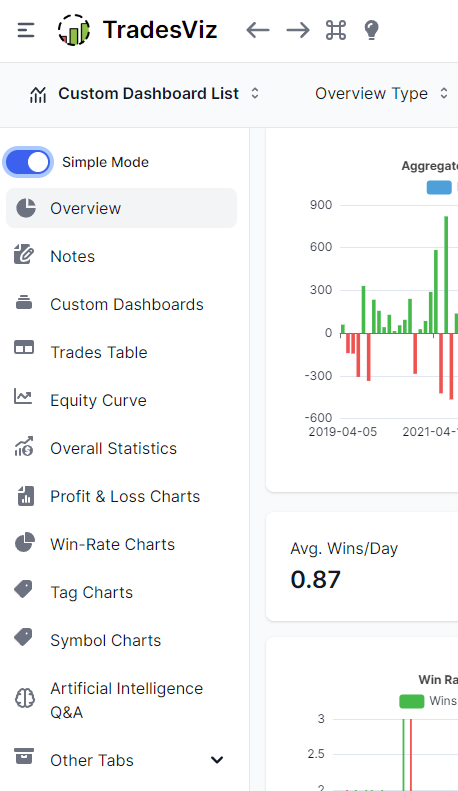
Finally, if you don't need any of this and if you just want to simplify everything, just turn on "Simple mode" and ONLY the MOST essential tabs will be shown with all other tabs put under the "Other tabs" section.
Trades Tables:
Grids! Grids! Grids everywhere!
One of the biggest changes in TradesViz v2.0. If you recall the pivot grid feature where we introduced the grid and pivot tables, there was a massive improvement in productivity and positive feedback on how good the tables were.
We took those tables and applied them to EVERY single table structure in TradesViz.
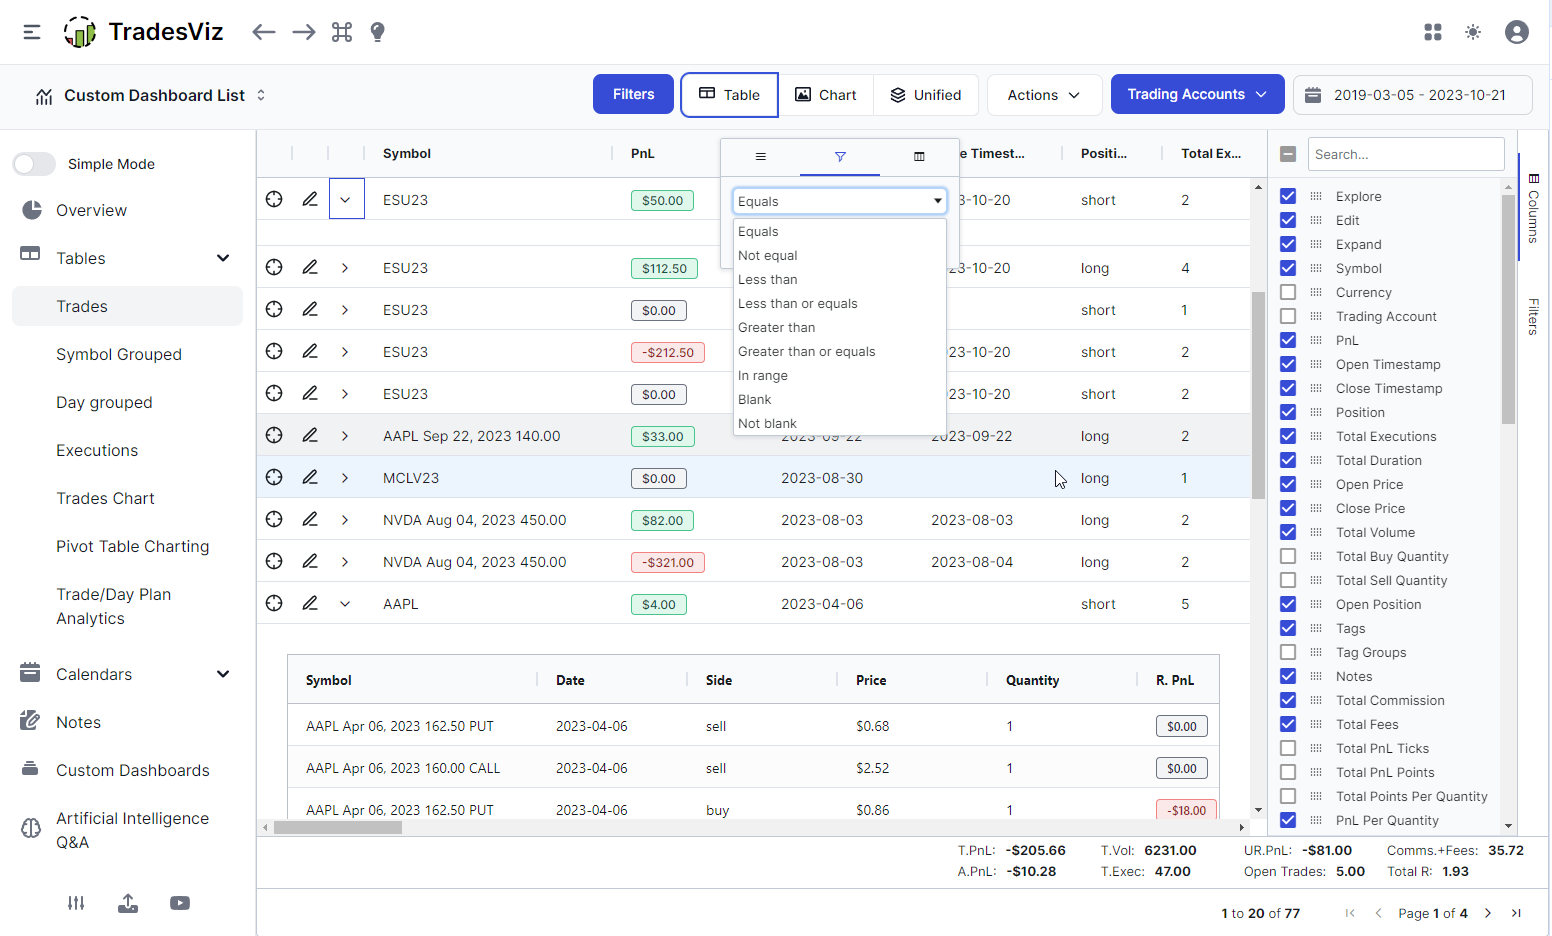
Yes, now you will have the same level of smoothness, flexibility, and utility for EVERY table. Moreover, each of the main tables + widgets of them have its own state. Meaning, you can customize the table - i.e, no. of cols, size, etc., and save the state for EACH table individually. No more horizontal toggle. No more local cache wiping out your data. All your table data are stored to your profile. Look for the small 3 dots icon on the top left corner of any of these tables or if you are in the main trades tab, they will be "Action" dropdown (as also in the plans tab).
While you are not able to do row grouping and pivoting in the main tables (the standalone pivot table feature still exists!), see quick summaries, customize and rearrange columns, sizes and more - which is a huge step up from the static tables of old TradesViz
PLUS
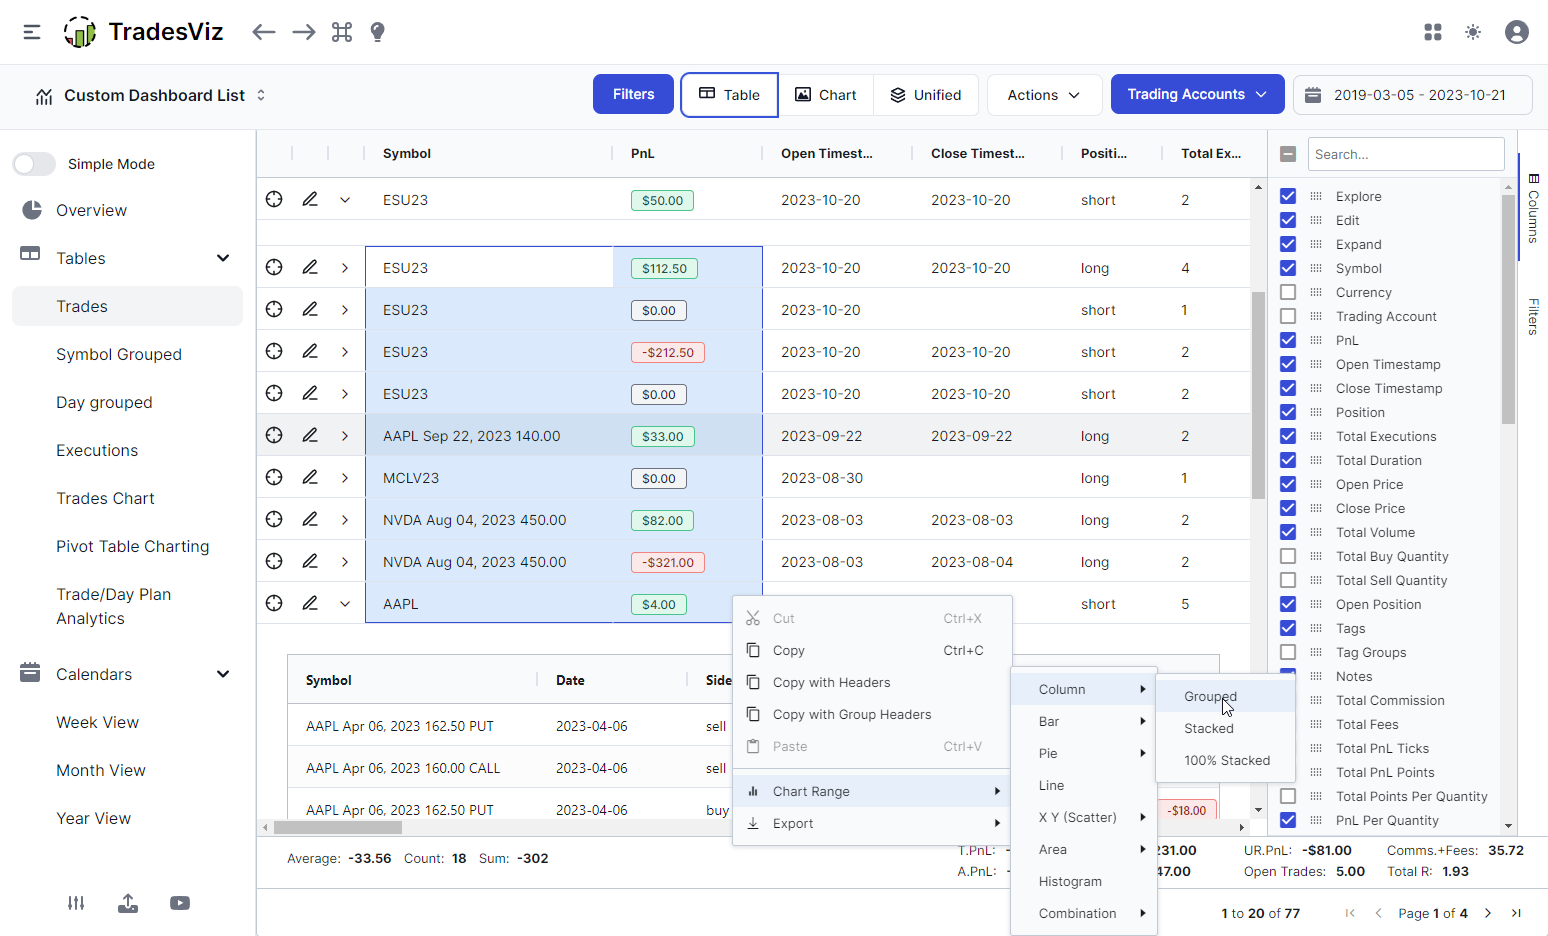
You can ALSO draw charts by selecting the cells/rows in the table!
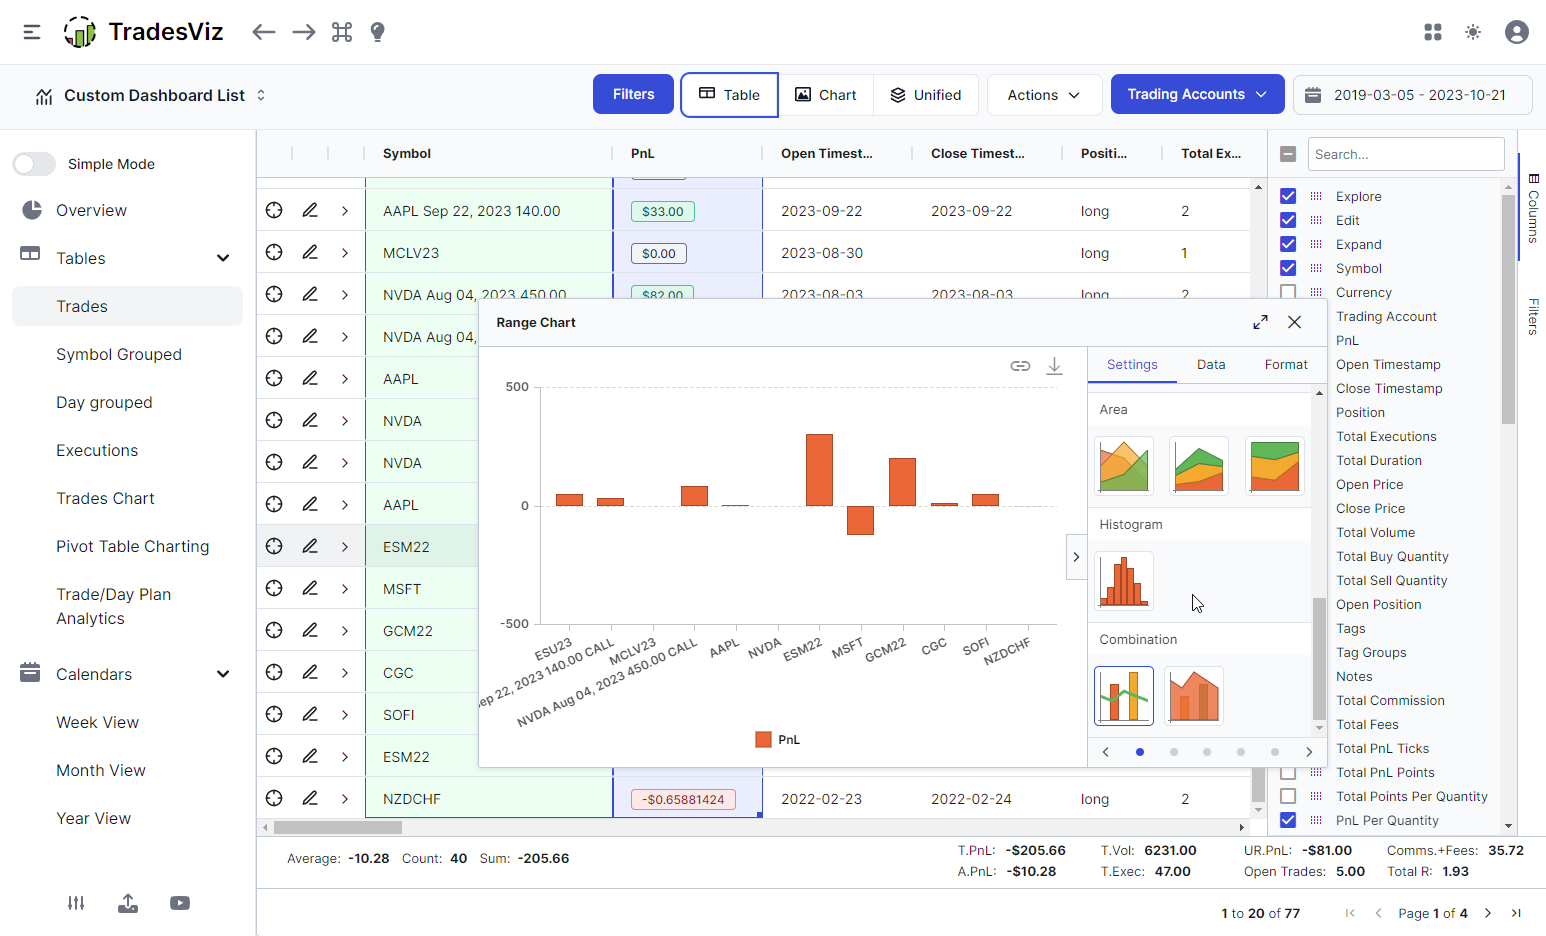
Yet another pivot-only feature is now available in most of the tables in TradesViz. This has been immensely helpful in quickly visualizing say, a bunch of 100 trades vs pnl overlayed over commissions or best exit without visiting the dedicated tabs + you can customize the way you want to visualize the trades.
Elements that stay the pretty much same
All analytics chart layouts
If you are wondering where the chart settings that appear at the top of each tab went, they are tucked within the chart settings dropdown! It's dynamic and changes according to the tab you have selected. The goal here is not to be intrusive but also not lack the utility that the original UI had.
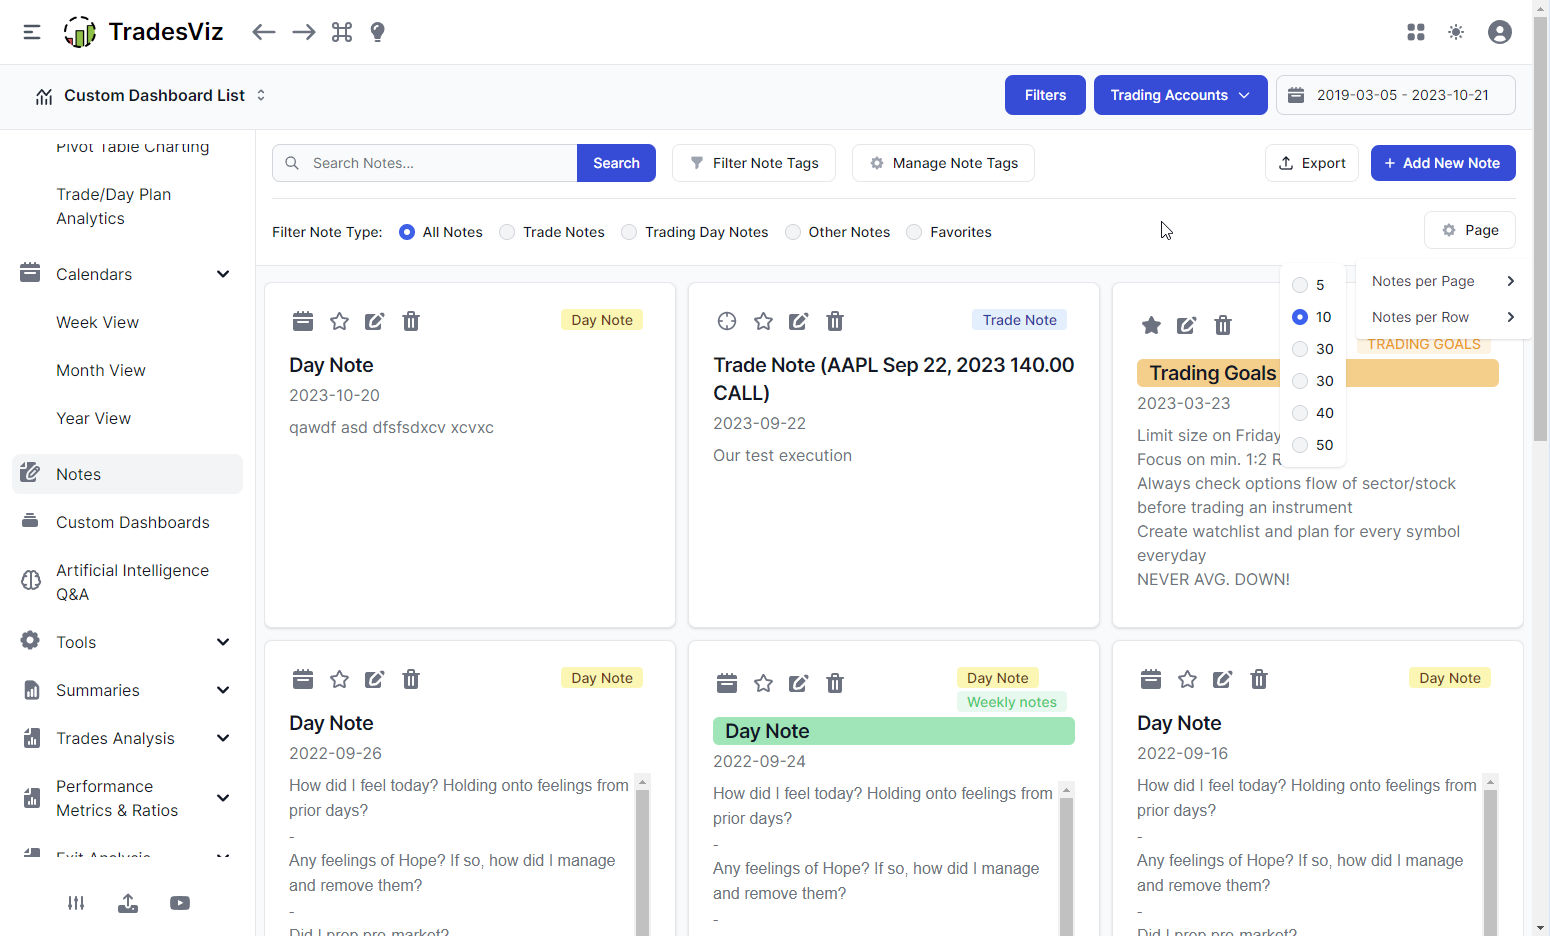
Features of Notes tab (except for the completely new, more intuitive UI)
Trade/Day explore
Another user favorite - our unique day and trade explore tabs have also had a full refresh, but they still maintain the same structure with some additional flexibility. The trade explore's main page had a lot of wasted space in the old UI which we have used to fit the additional stats correctly based on the asset type.
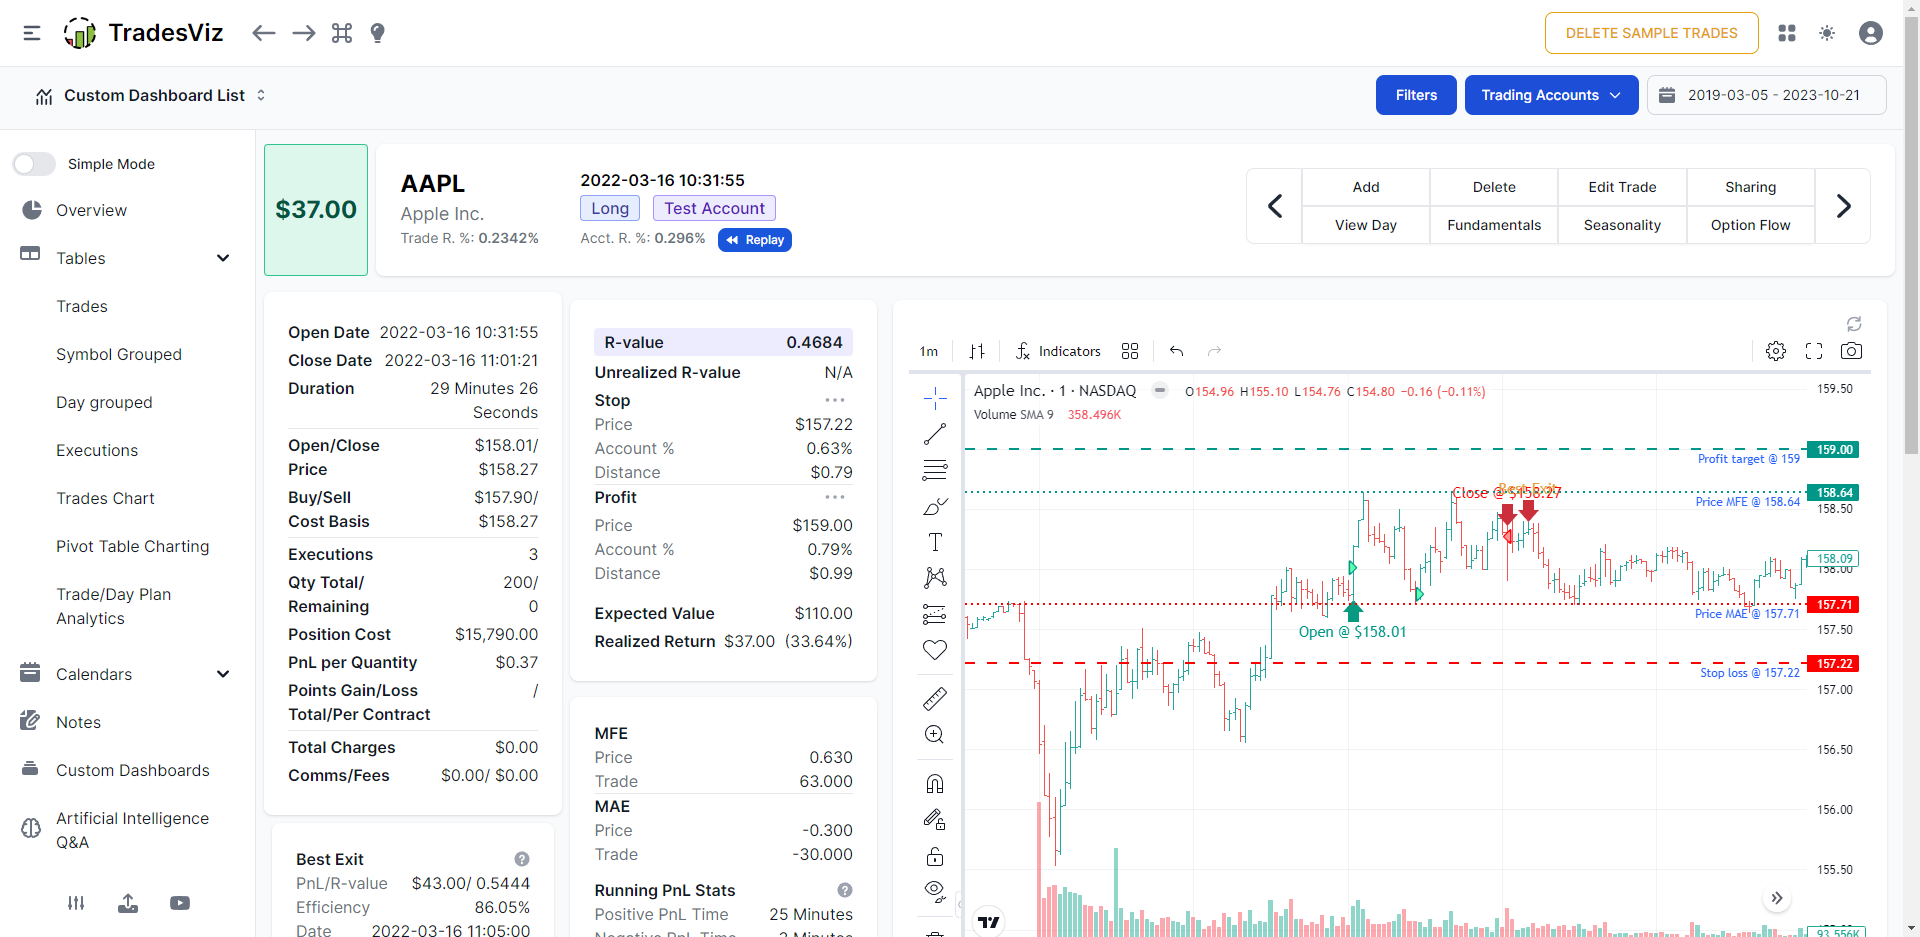
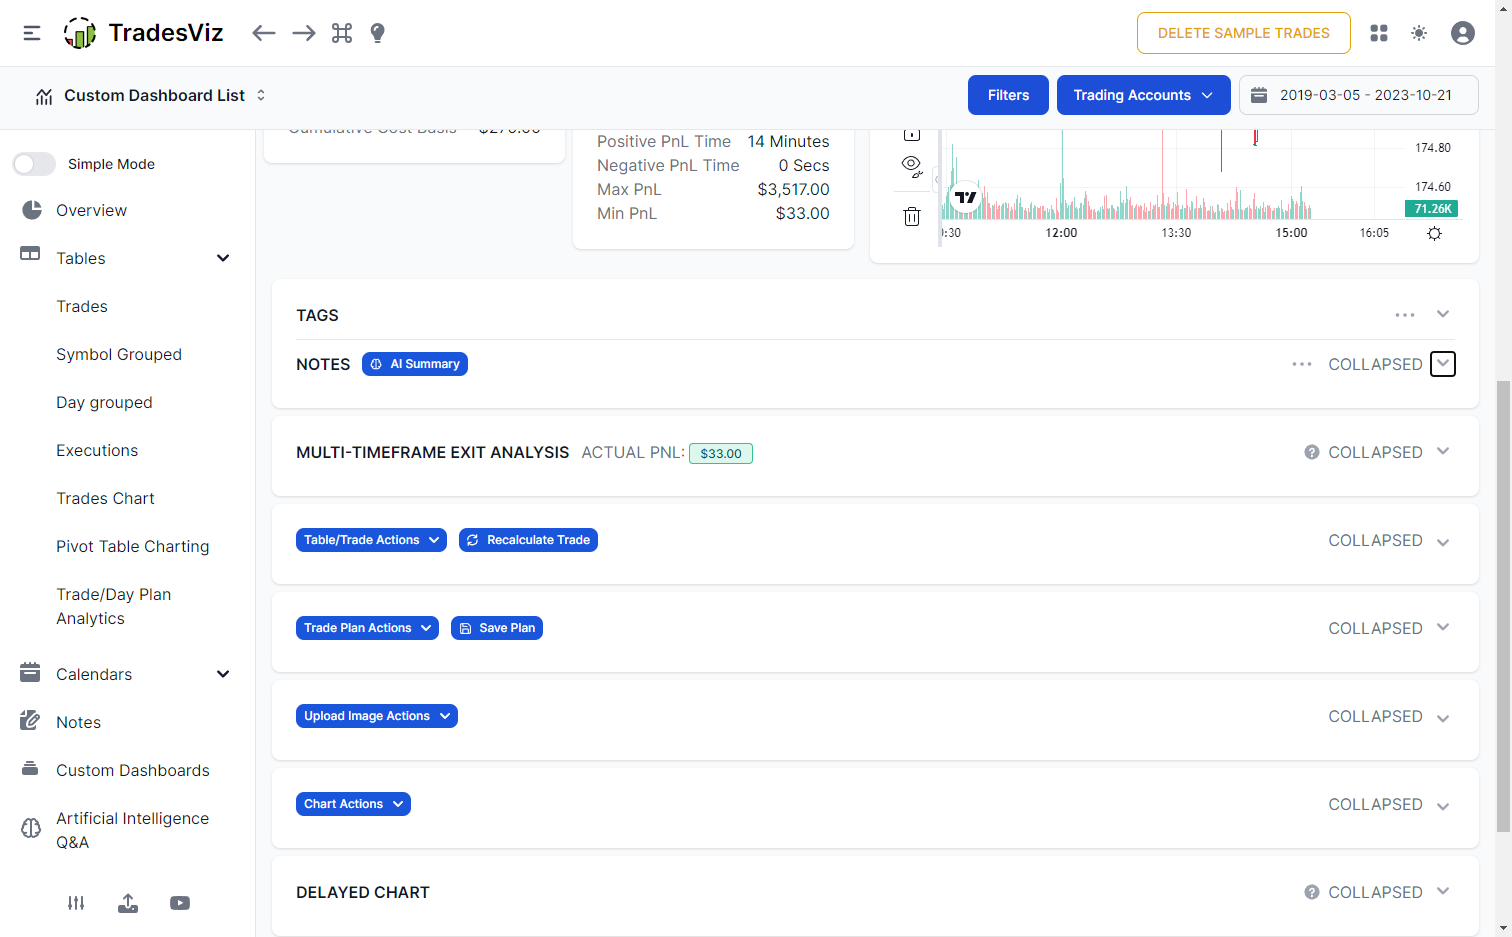
You can now expand/collapse ALL the containers in the day and trade explore page!
Other tabs
If you are an existing user, you will find that most tab's inner design has been refined to go with the theme of the overall dashboard. The features of most of these tabs remain the same the existing guides are also fully applicable (albeit with the UI changes).
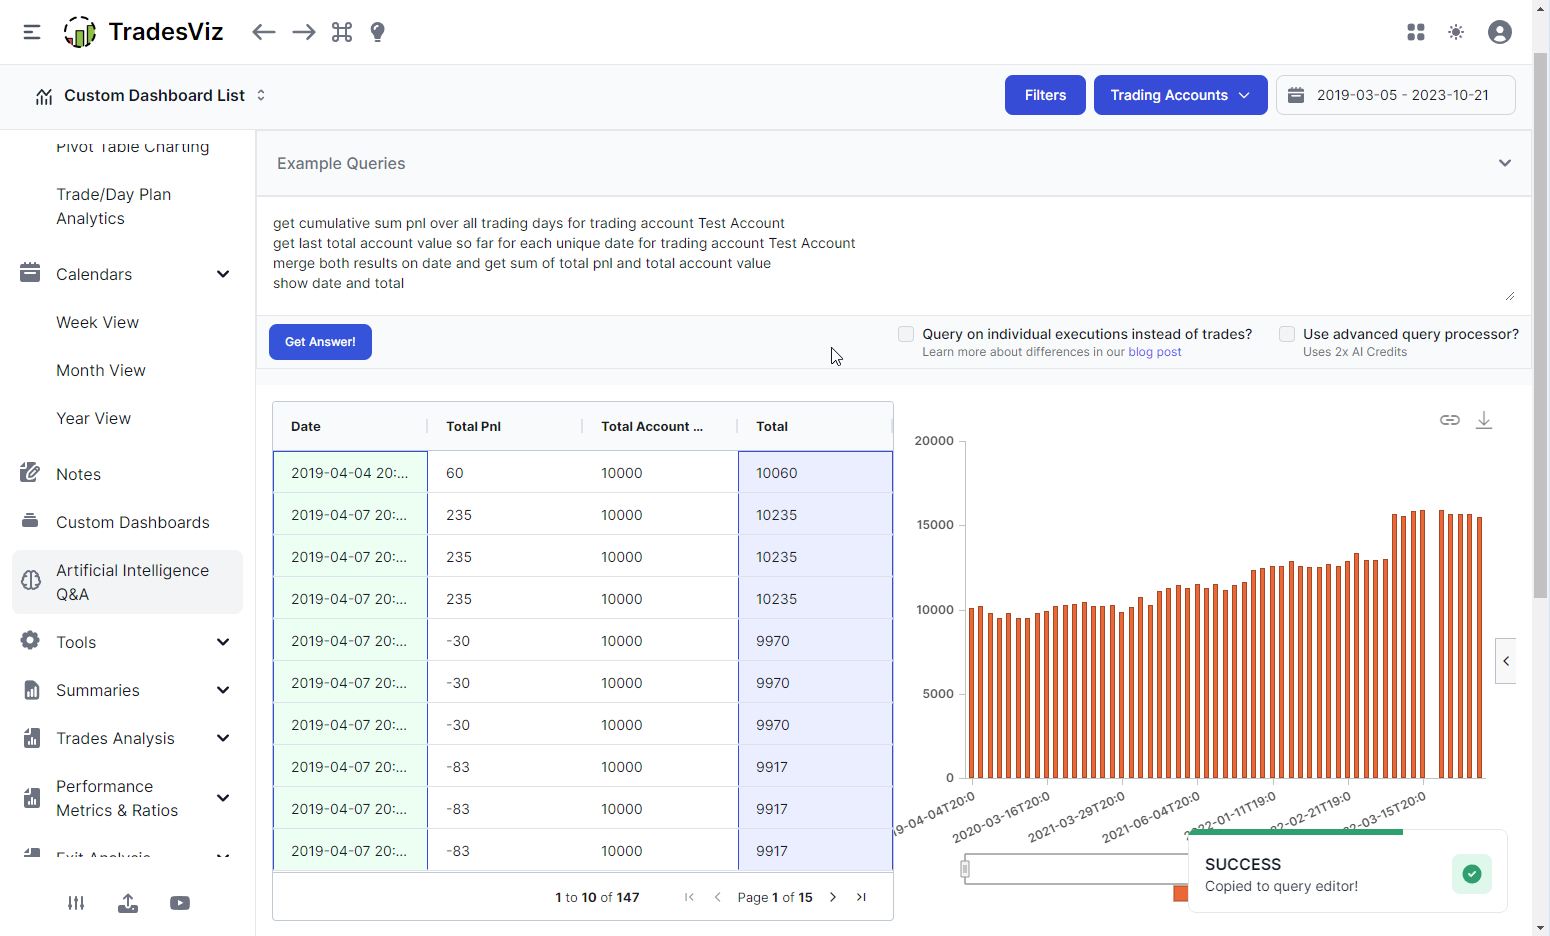
Here's the AI dashboard:
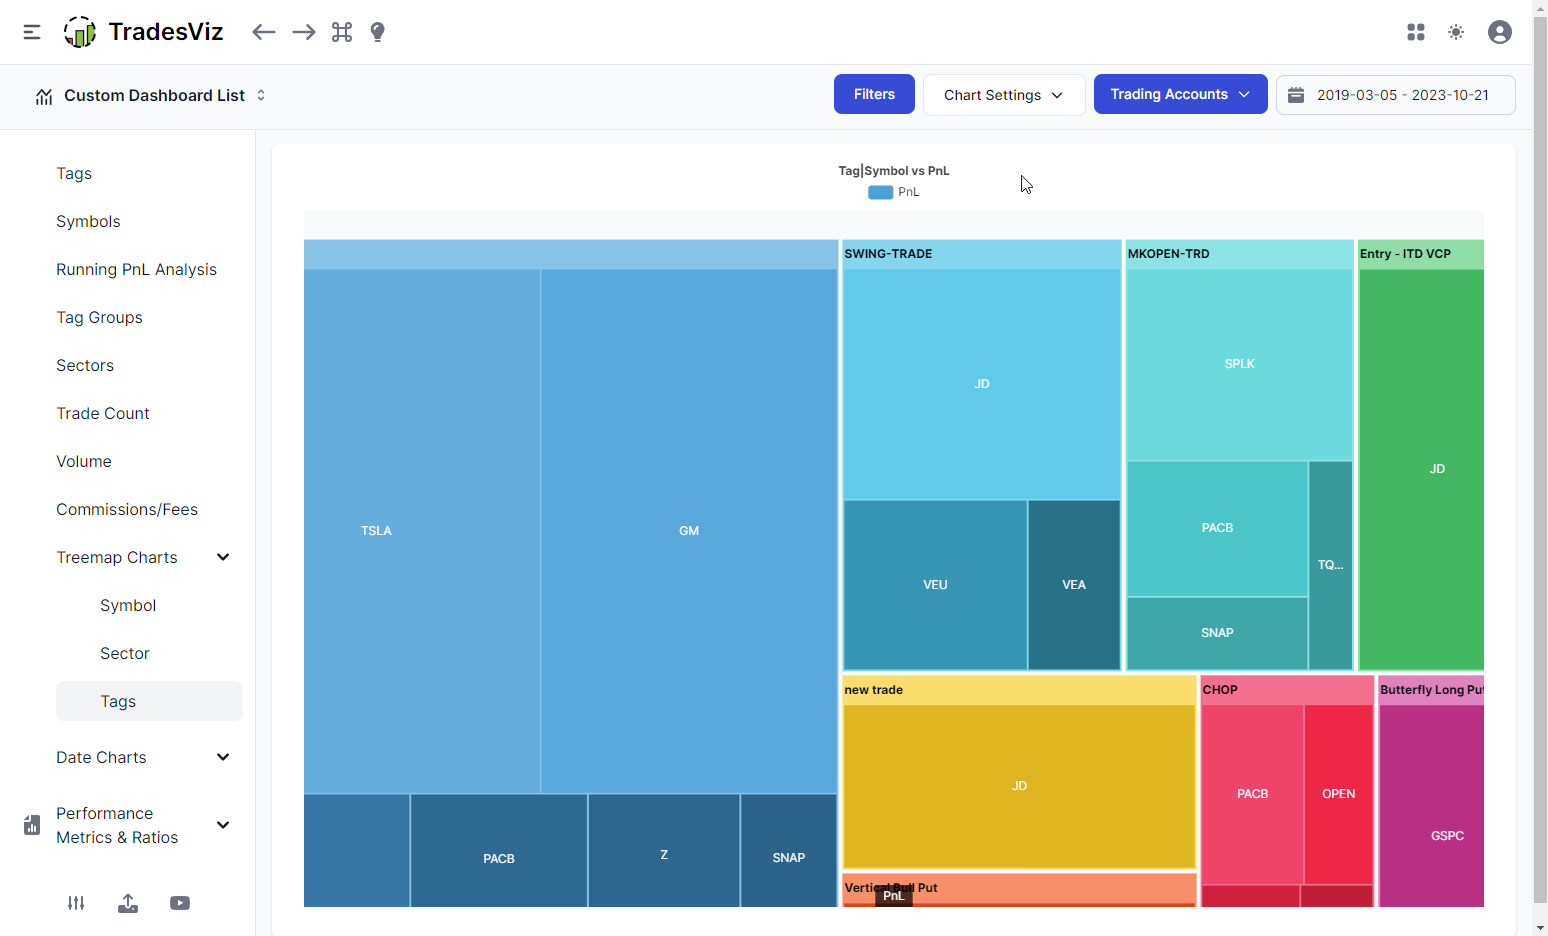
Tag/Symbol vs PnL Treemap (Improvement: treemaps are now zoomable by click + mouse scroll)
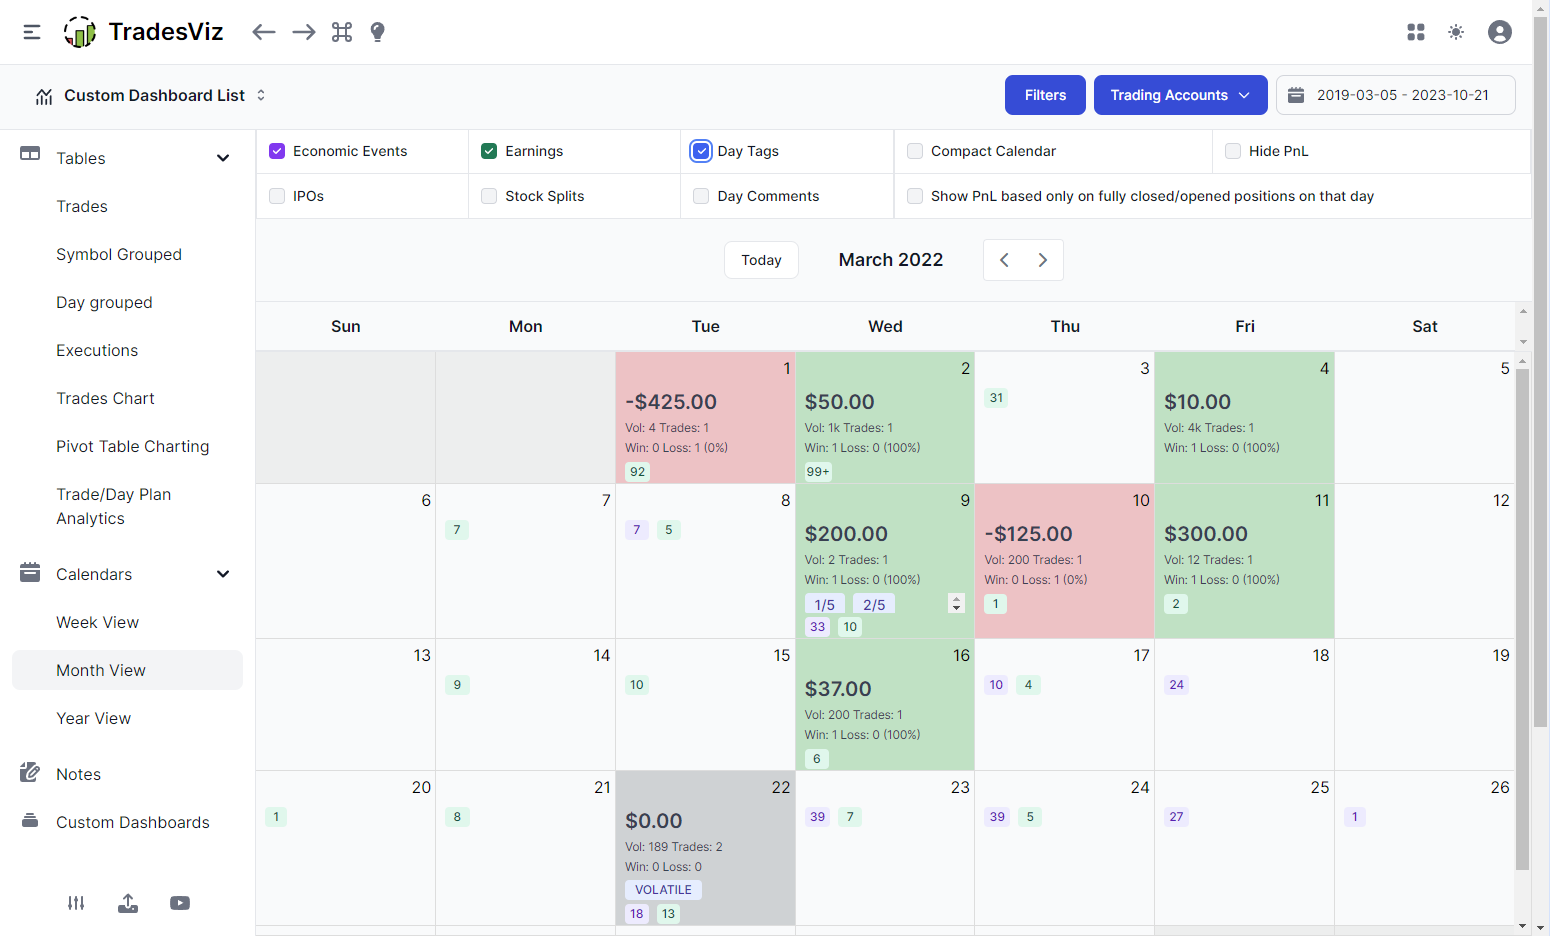
Calendar: The responsiveness of the calendar has been improved. Buttons/controls are streamlined at the top section of the tab. You will see this theme across many tabs.
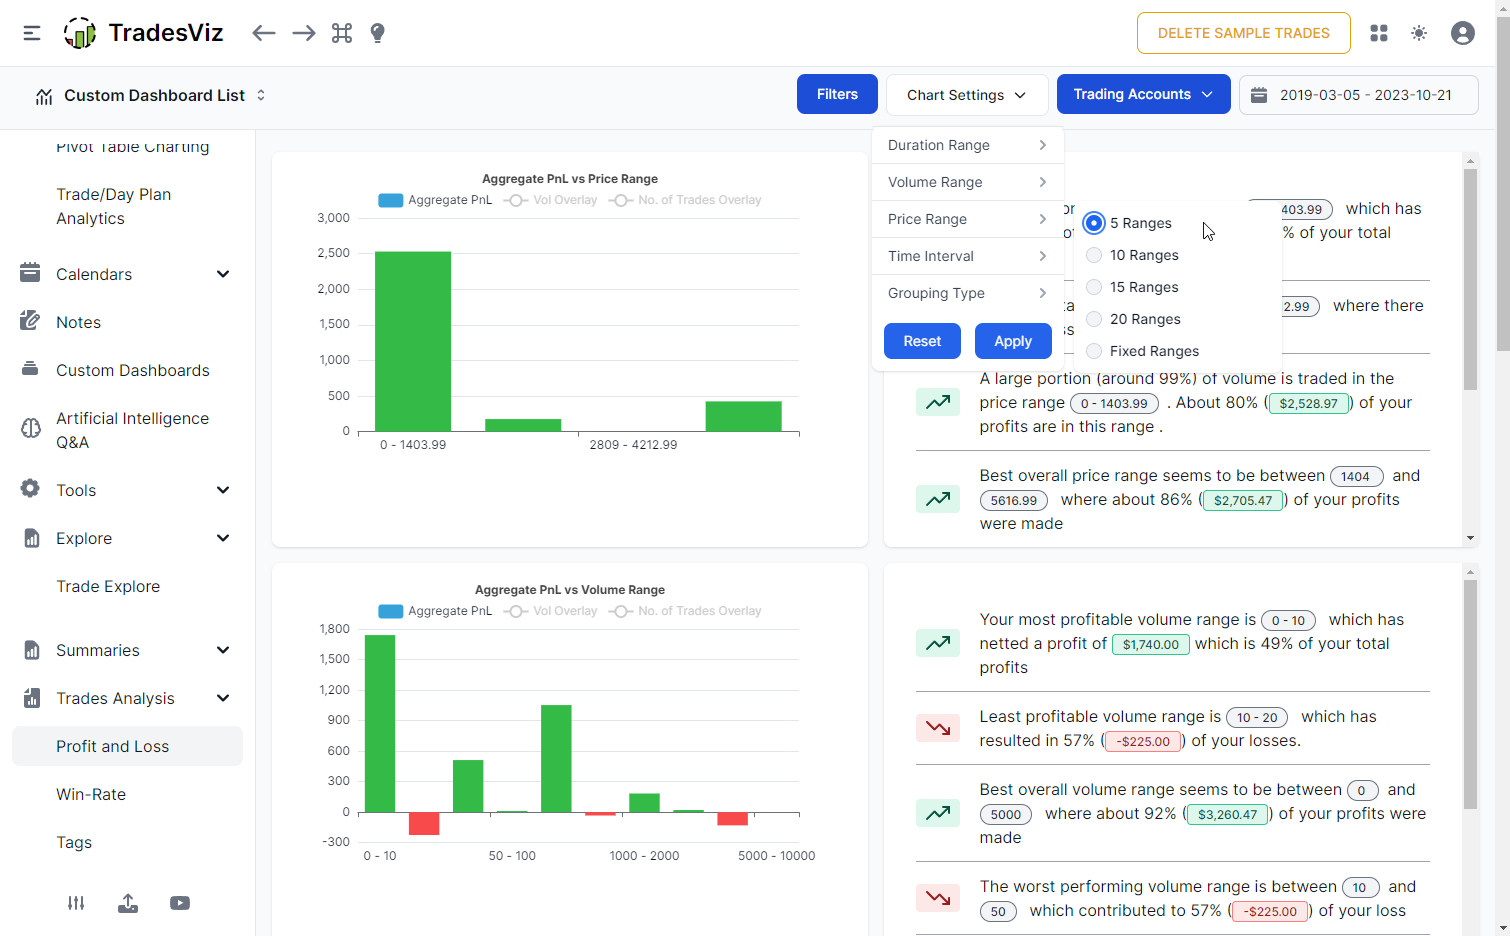
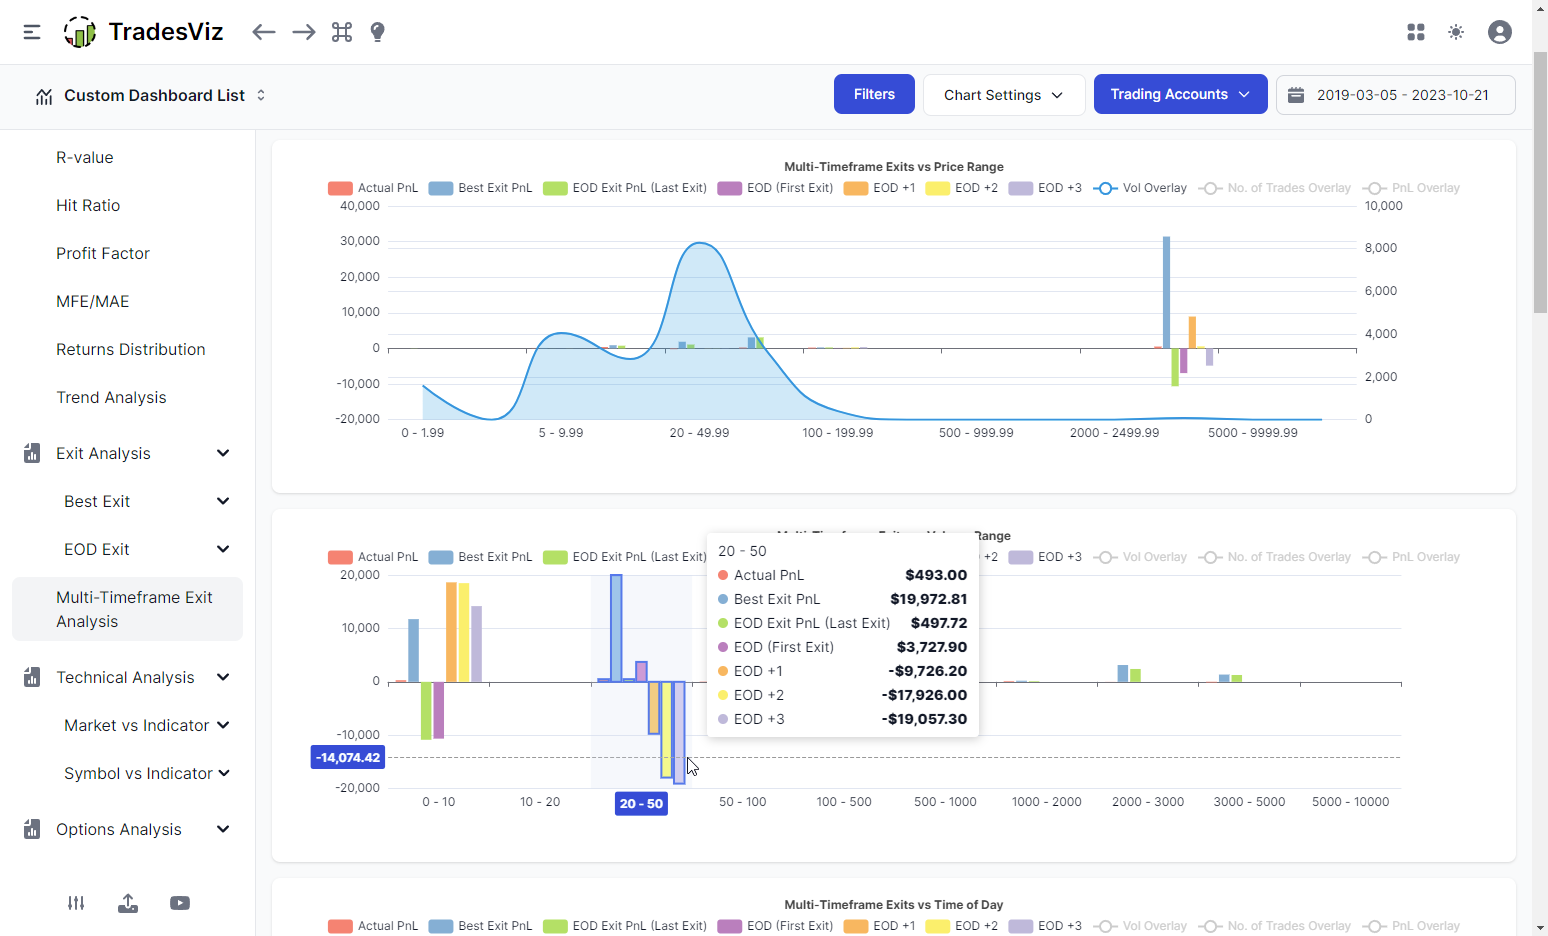
Multi-exit analysis: A lot of the charts now come with toggleable overlays that are hidden by default. For example, the first chart in the screenshot below has a volume overlay toggled (Quick insight: A lot of volume is traded in the lower price range, but most of the best pnl seems to come from the higher-priced ones - we wonder why...)
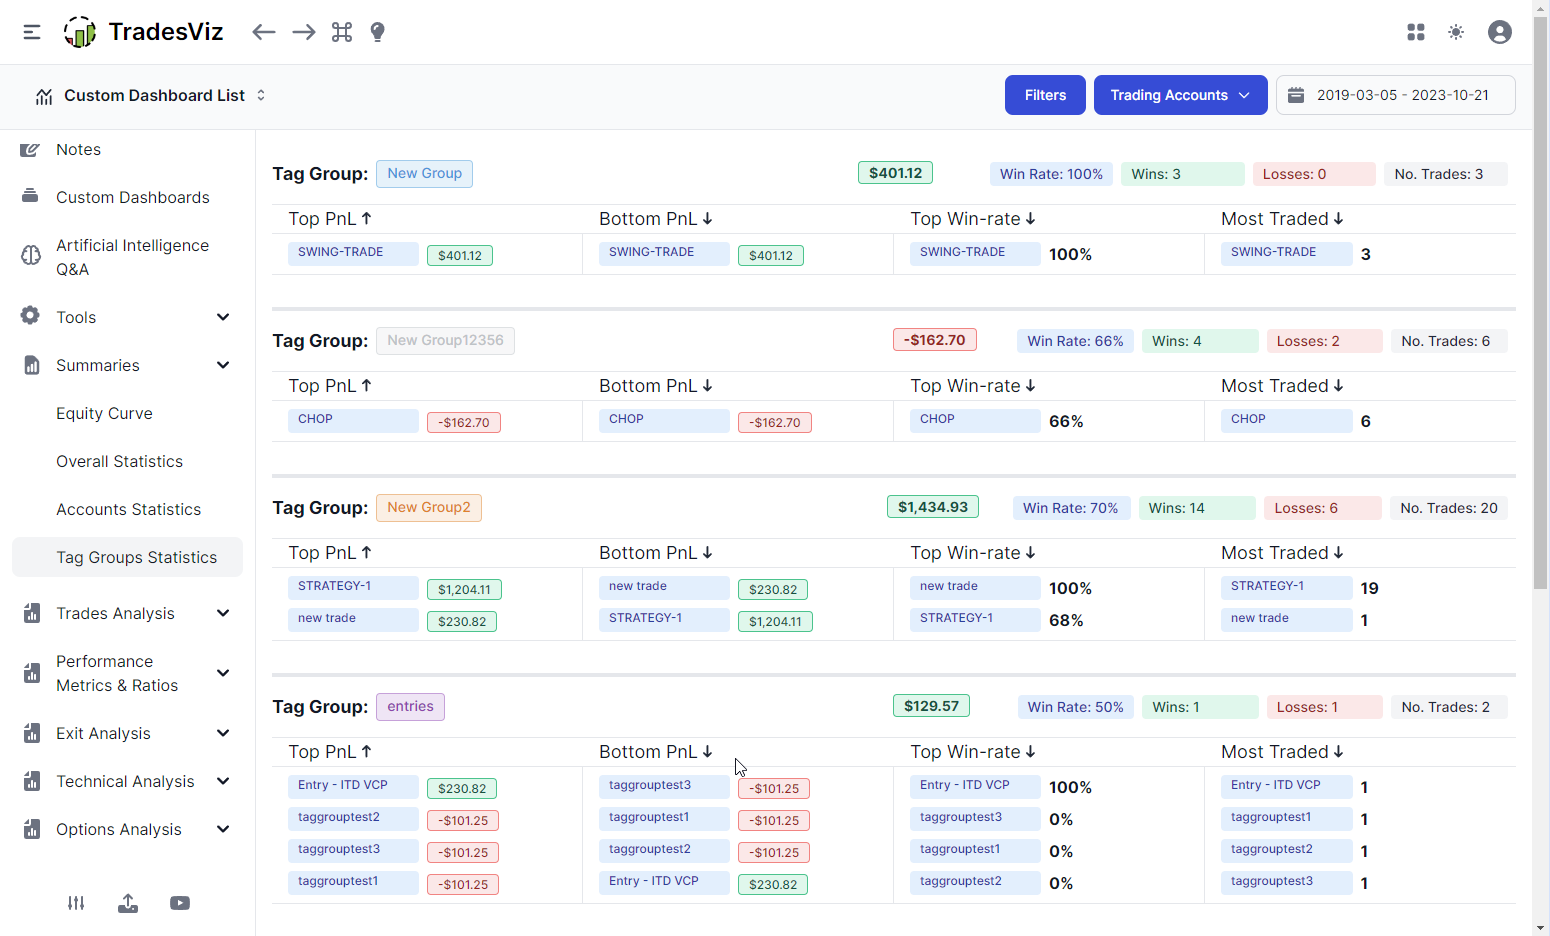
The tag groups summary has been revamped to offer much better readability. This one tag gives you an entire snapshot of all your tags and tag groups. Simply put, it will show you the tags with the highest/lowest pnl, win-rate, and no.of trades for each tag group.
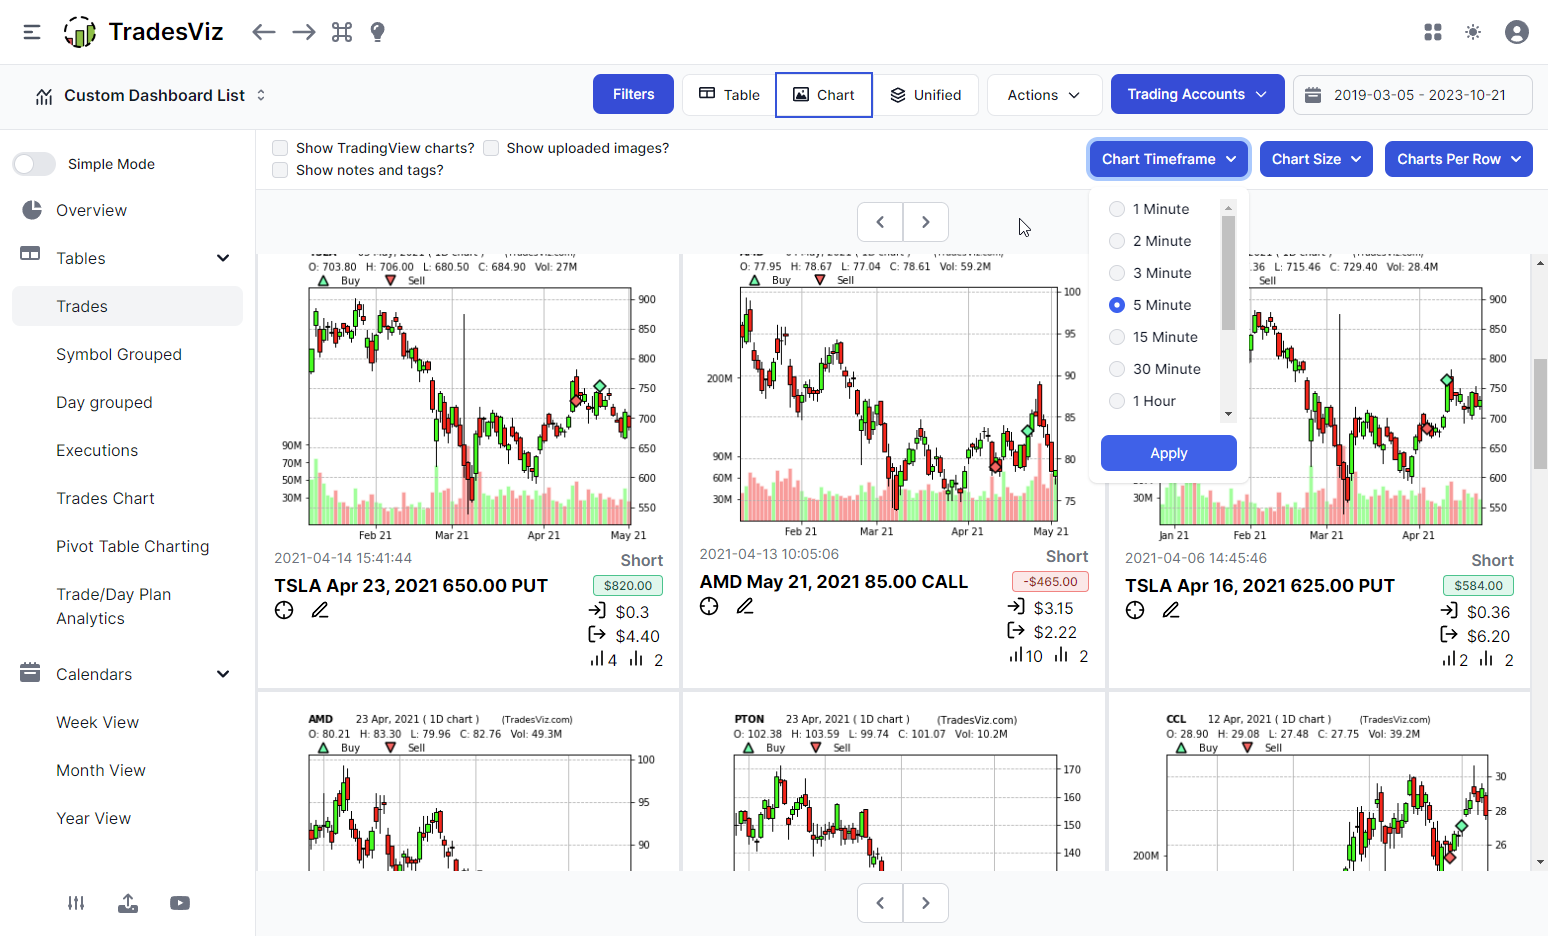
The famous and user-favorite chart view of the table is still the same - the grid layout has been tightened/compressed to show the data better.
Dark mode
Dark mode availability from Day 1. The entire dashboard has been perfected for both light and dark mode across all tabs and widgets.
A lot of dark modes improvements have also been made in the modals and also with respect to much better color combinations and contrast ratios to make sure all text is comfortable to view and read.
What's next?
Your feedback has been instrumental in shaping this transformation. Over the past three years, we've implemented hundreds of small features and changes based on your valuable suggestions. This is not just a new dashboard, it's an experience crafted by you, the users of TradesViz!
While you may notice that some pages of TradesViz, such as import/export and account settings, are still in the old theme, rest assured we're working diligently to update these as well. We prioritized the dashboard to ensure you could start benefiting from these improvements as soon as possible.
Next on our list is the import/export page, the second most frequently used feature. Our commitment is to deliver a sleek, robust, and modern TradesViz experience to every trader in the coming months.
Thank you for your continued feedback and support. Together, we're making TradesViz better than ever!
Got more ideas? Improvements? Let us know! We are always looking forward to your feedback!