This is a very unique feature of TradesViz that allows you to create custom comparisons/filter groups of trades and plot them versus each other. Unlike most other platforms which have very limited features in the way of "comparing" trades from within the same account, we went all out and created around 20 individual filters for you to choose and play with.
To access the trades compare page, click on the Trades compare icon (2 arrows opposite direction) in the top-right corner of your TradesViz home page or you can click here if you are already logged into TradesViz.
The way this works is, you construct a filter group by setting the various filters in the Filter settings page and add that as a "filter group" and then click on "Generate Comparison Analysis". This will group trades into the colors you have chosen for each group and then plot them stacked versus each other on the trades analysis charts (same charts as the ones in your dashboard). Since these are the same types of charts as in your dashboard, you can click and explore trades for any data point on any chart.
It might take a while for you to understand all the filtering possibilities since at the beginning you might start off with applying too generic filters that have a lot of trades or your filters might be too specific in which case you might not see any trades in the charts that are generated at all. Getting a balance between these 2 extremes requires a good understanding of what you are expecting out of this comparative analysis and your own trading ranges.
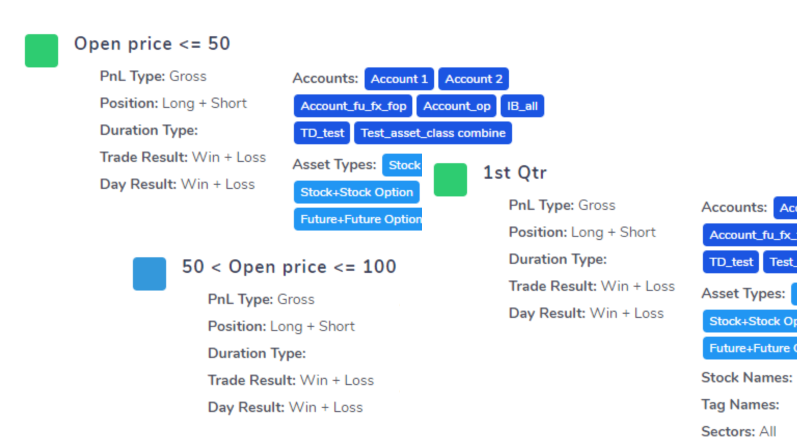
To make things even easier, we have added 8 pre-made filters which cover the basic of using a lot of different filters.
Choosing any of the filters will redirect you to the groups tab which shows all the filter groups in detail.
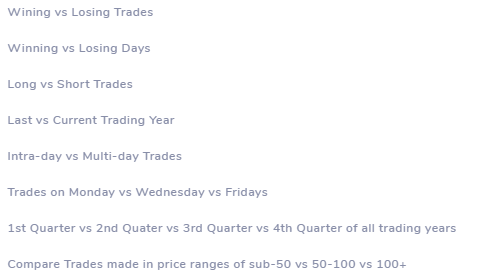
Let's take the example of comparing trades made in different price ranges. Here's how the filter group page looks like:
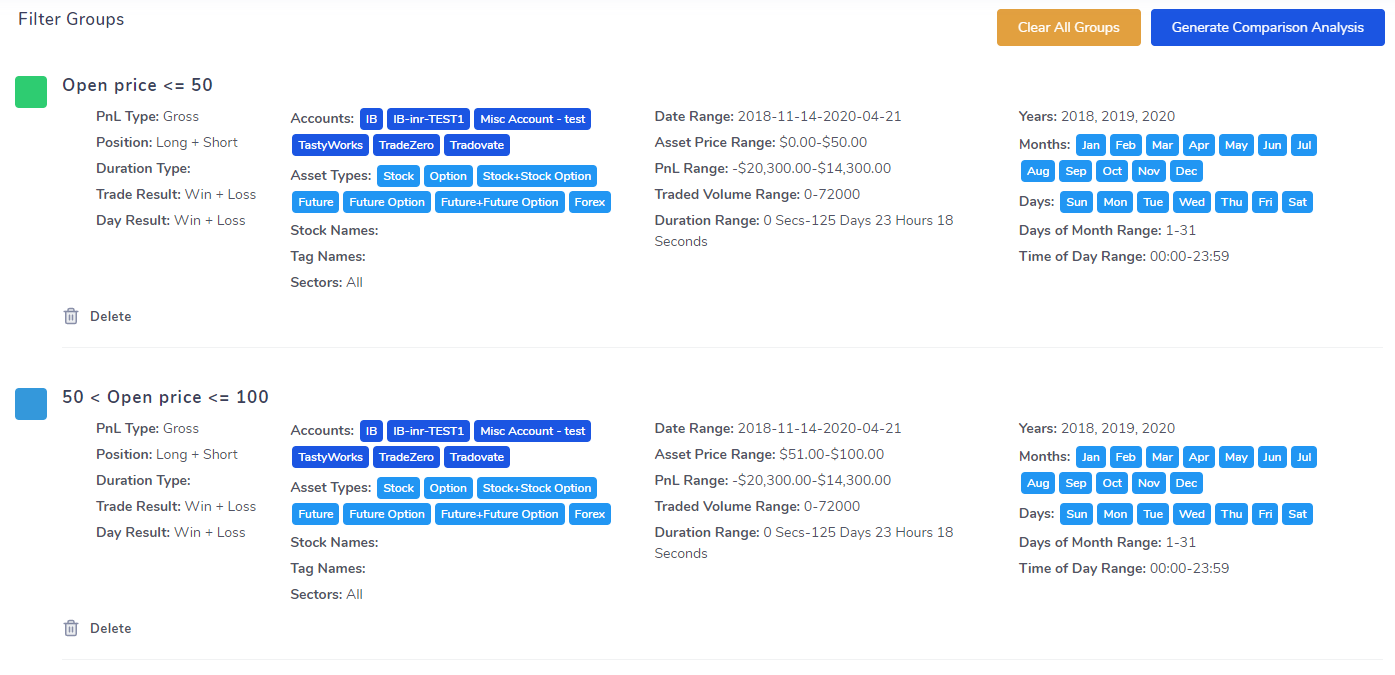
At the moment, you can only delete the groups. We are still actively taking in feature requests for this trades compare feature as it's a very unique feature with a lot of potential in it. Do let us know your comments and feedback by emailing us at [email protected].
All you have to do to generate trade is click on "Generate Comparison Analysis" up top. Note that, but default only the PnL, Win-rate, and volume-based charts are shown. This is so that the data generation process is quick. If you want, you can include additional tabs in the filters page under "Settings common to all filter groups" section. Beware the data generation process might take a bit longer if you select a lot of tabs.
How do the charts look? How to interpret the results? Here's an example:
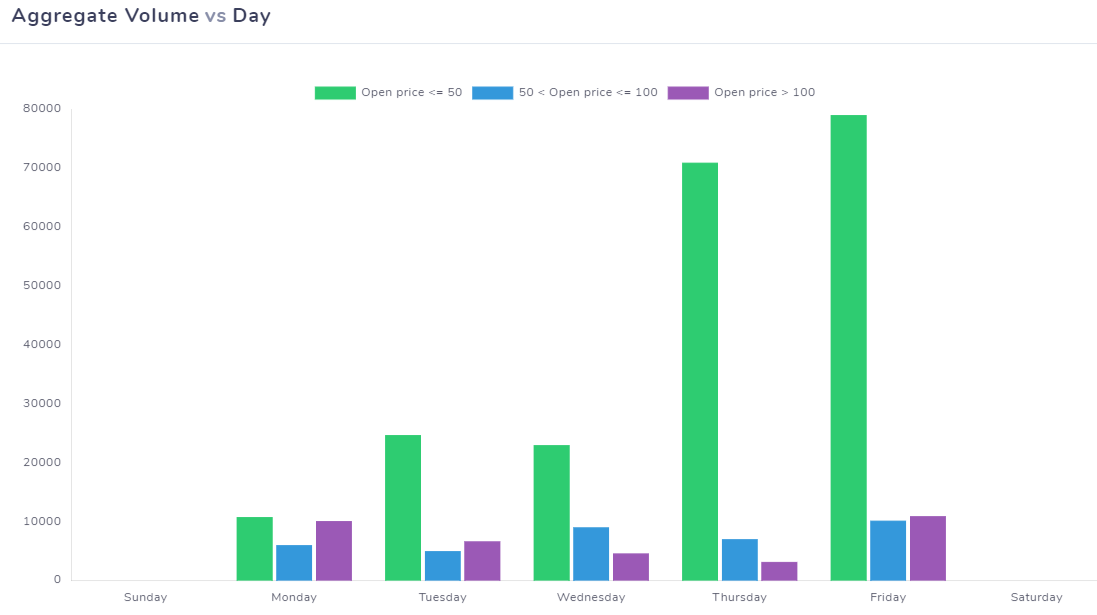 In this example, the charts show the total volume traded for each day of the week for 3 different filter groups - all stacked in one single plot. It's very easy to observe that trading with assets priced below $50 has a huge jump towards the end of the week - this could be due to a lot of reasons. To explore more, we would have to look at the PnL and win-rate charts.
A process like this helps you find narrow areas in your own trading which you are good or bad at. You can create even more filter groups to asses your trading setups to see what has had the most effect. The possibilities or the combinations of filters you can create are endless. For example, is it the price that matters the most to your performance? or has volume traded had the most effect on your trading? what about low priced stocks on certain days of the week? maybe trading in the summer does not suit you? how do you going to find answers to all these questions? That's where this compare tool shines.
July 2020 Update: Added a table to compare all statistics of all compare groups on one page! Here's how it looks like:
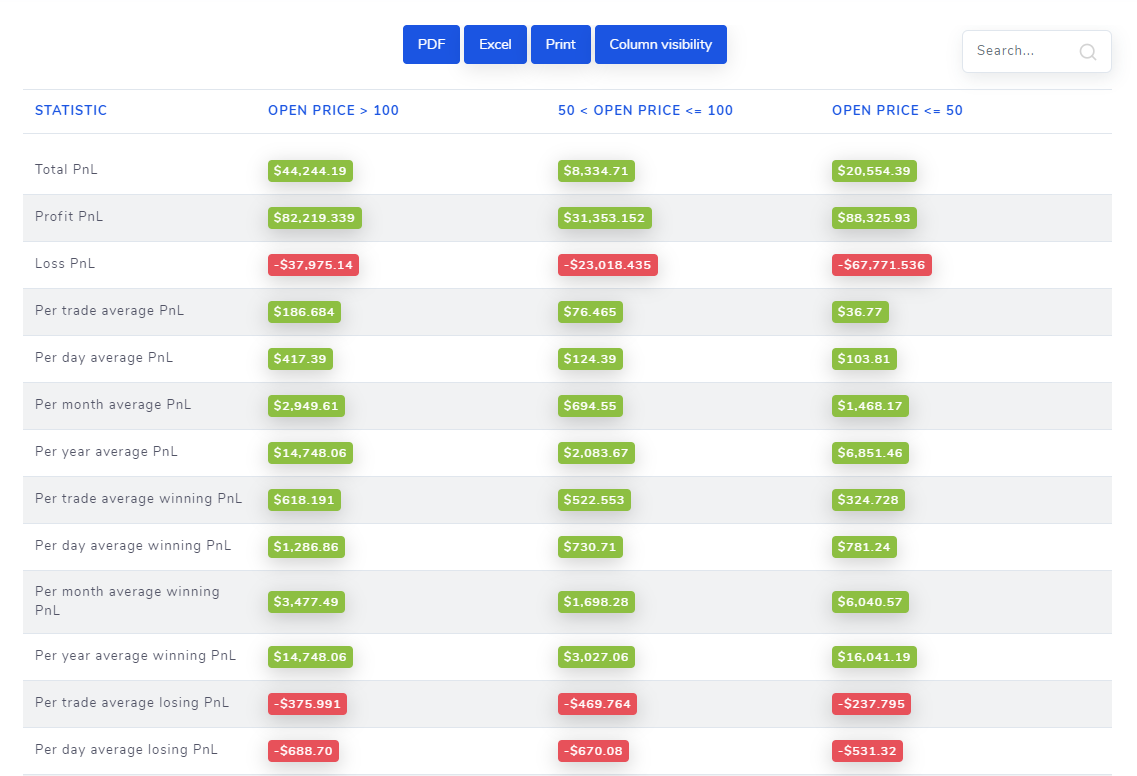
As always, we are constantly improving our features and adding more analysis tools to create a complete platform capable of generating actionable insights and observations that can pave the way to consistent profitability for any trader. Please send us your comments, feedback, questions, or feature requests to [email protected] or fill up and send the contact form here.