We just introduced tags grouping for trade tags and this opens the doors for A LOT of qualitative analytics which we are going to explore in this blog post.
The two new tabs we have added are "Tag groups" (visualization) and "Tag group summary" (tabular). Both are available under the "Trading analysis charts" section.
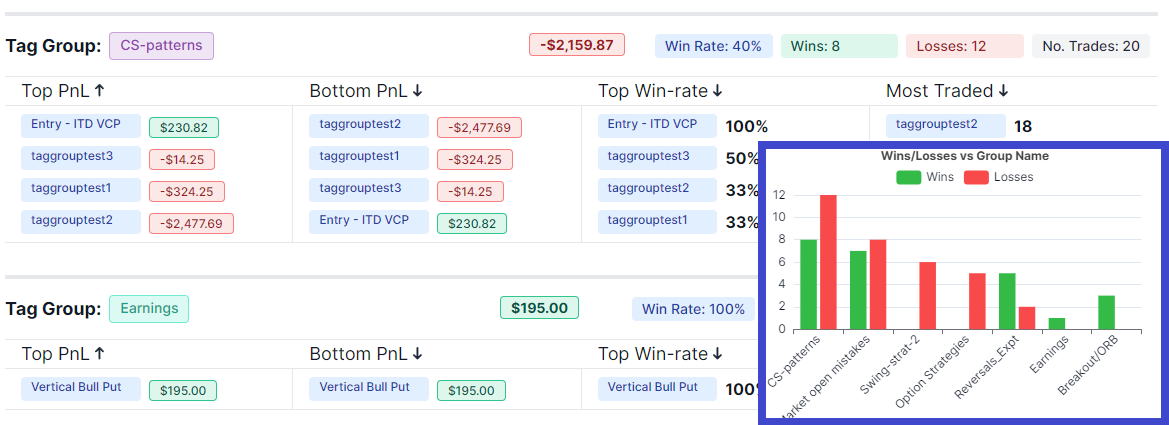
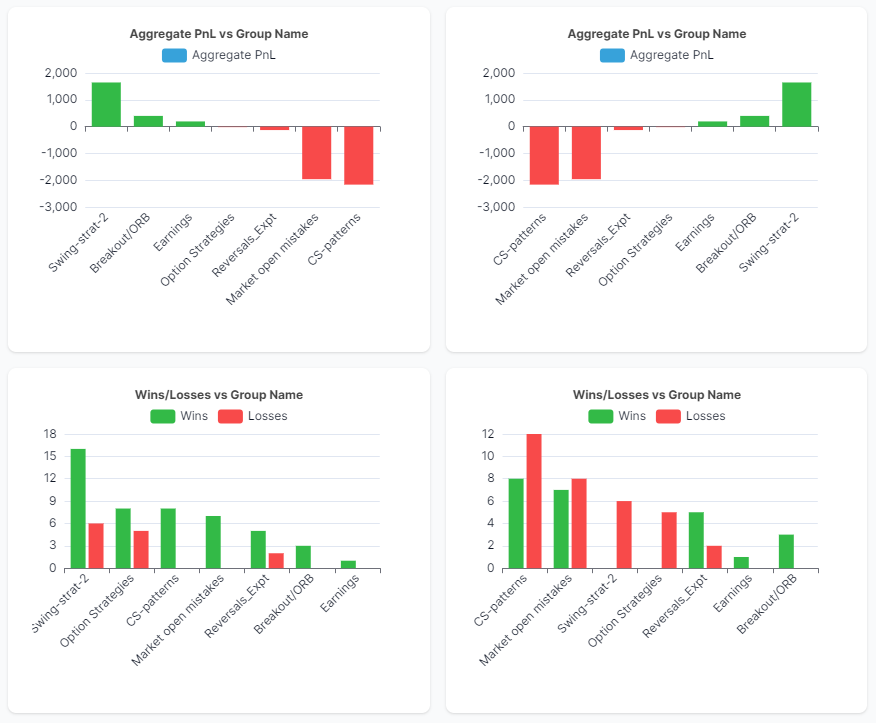
The tag groups section shows you statistics such as top/bottom PnL, win-rate, no.of trades grouped by tag groups. Think of this as one layer up when compared to just comparing these stats concerning trade tags. You may not realize this, but if you are trading multiple strategies or if you are prone to making multiple mistakes, this visualization is pretty much your answer and can act as an accurate guide in zeroing down on where you should focus on.
Eliminating a strategy completely because you are having negative PnL is a shallow analysis. Instead, try to add tags that describe market conditions, how you are feeling when taking the trade, or about the trade step/price action, and categorize these tags into tag groups.
This will give you further insights on where exactly you can improve your trading. These charts, as with all TradesViz charts are fully explorable - meaning, you can click on it, add it as a global filter to run a complete tag group report or explore the trades that make up a particular data point.
Next is the tag groups summary. As you start using the tag groups, you will notice that your focus gradually shifts towards the tag groups and not so much on the individual tags themselves. However, when focusing on the bigger picture, you should not lose sight of the fine-grained details.
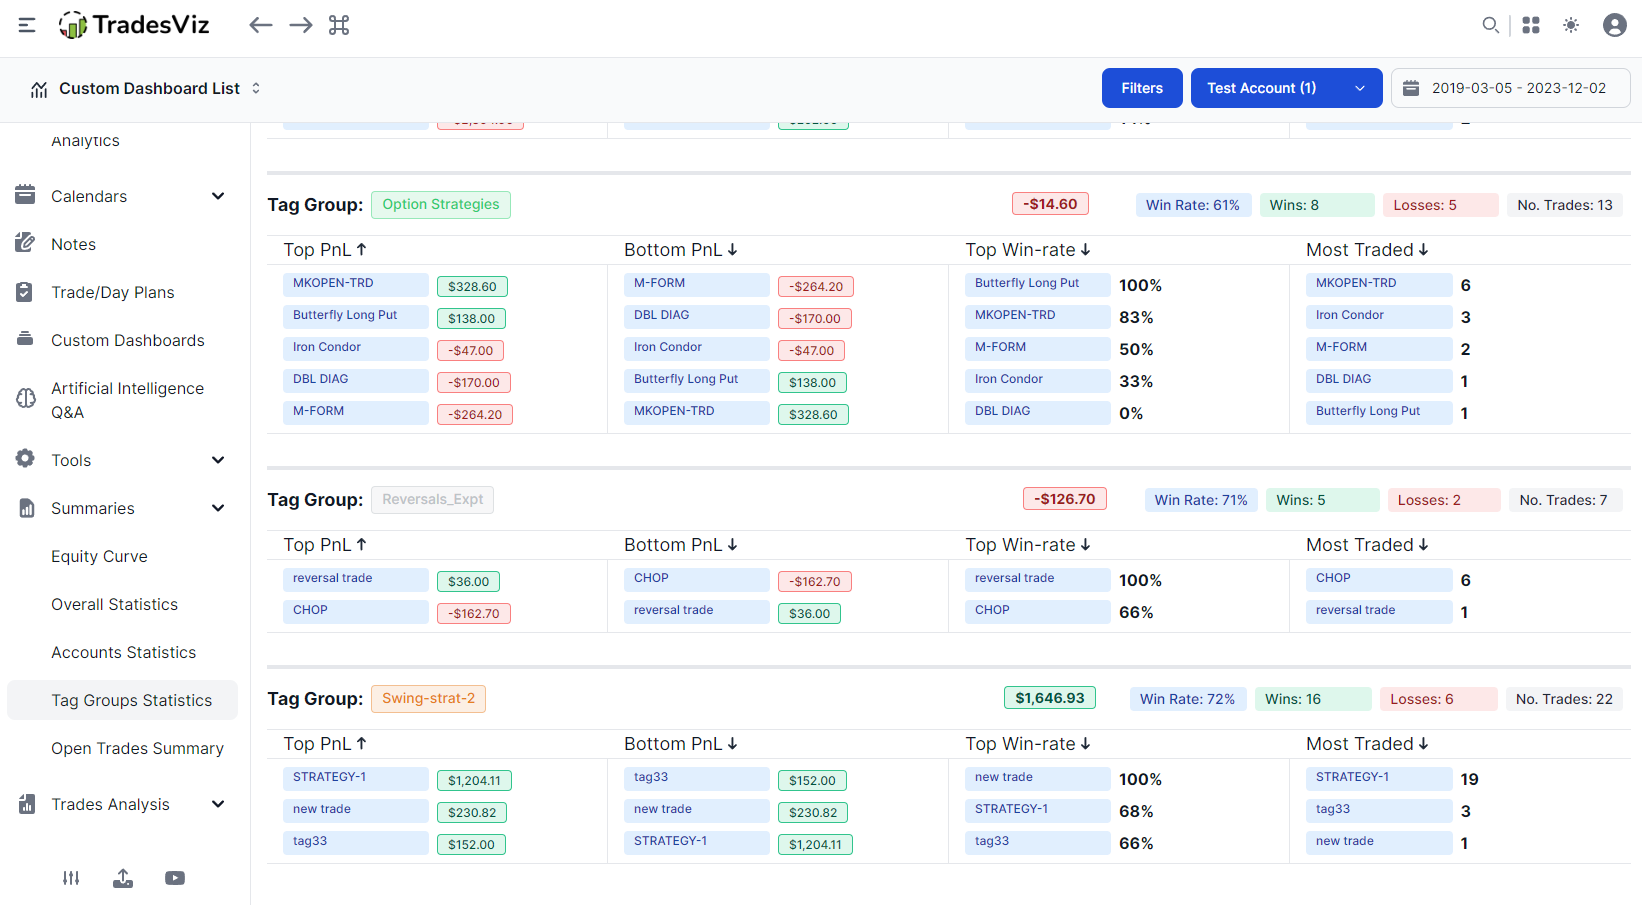
Say, you are trading a particular strategy on different asset types or during different market conditions and you have tagged your trades accordingly. If you are losing money on this strategy, where exactly is it happening? Which market condition? or which asset type? or which price action type? etc.,
This tab answers those questions. Each section in this tab is a tag group's summary. At the top, you will see the group's name and the overall group's statistics. In the main body, you will see top/bottom pnl, top win-rate, and most traded tags in sorted order.
We are effectively doing 2 types of analysis at once here: finding our which overall tag group is most beneficial or that which requires most attention from you and within that group, what exactly is helping you or running your performance.
Remember that you can run reports on tag groups whenever you want by using the tag groups filter available in the filters section:
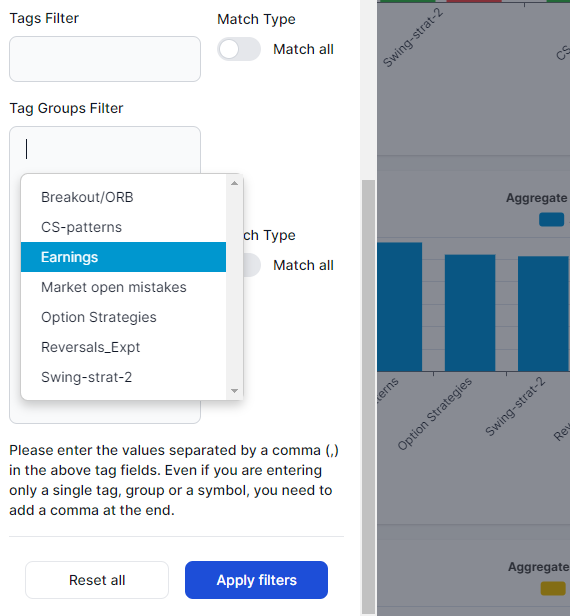
Every part of the tag groups is designed and integrated into the TradesViz system in such a way that it never complicates your analysis or does not take up any extra time at all. If you are already familiar with filtering features of the tags system in TradesViz, you can do pretty much everything with tag groups also.
July 2024 Update:
Please check our updated all-in-one tags guide here: https://www.tradesviz.com/blog/tags-complete-guide
You can now use tag groups not only in the charts, but also in AI query, pivot grid, normal grids, and more!
As always, our goal is to make analysis seamless and useful for everyone. We have thus far focused a LOT on quantitative analysis and there is nothing out there there that can compete with TradesViz on that front. We also want to do the same for qualitative analysis also - starting with the group tags feature.
A lot of similar features and useful analytics will continually be added to TradesViz. None of this would be possible without your feedback! Please let us know what you think at [email protected].