While most journals focus on just PnL, win-rate, etc., we want to provide our users with a complete report of trading - including commissions and fees which are unavoidable in the business of trading.
Once again, this is a feature that comes from our users as a feature request. Do you have any ideas you want to see implemented on TradesViz? Talk to us!
These new charts are available under the Trades analysis charts section.
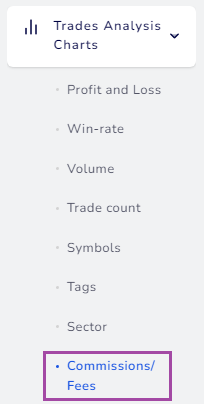
The charts available are:
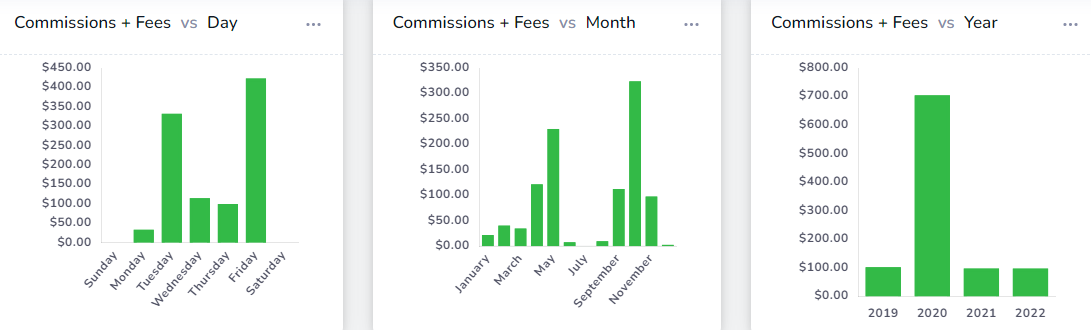
- Comms/Fees vs Day
- Comms/Fees vs Month
- Comms/Fees vs Year
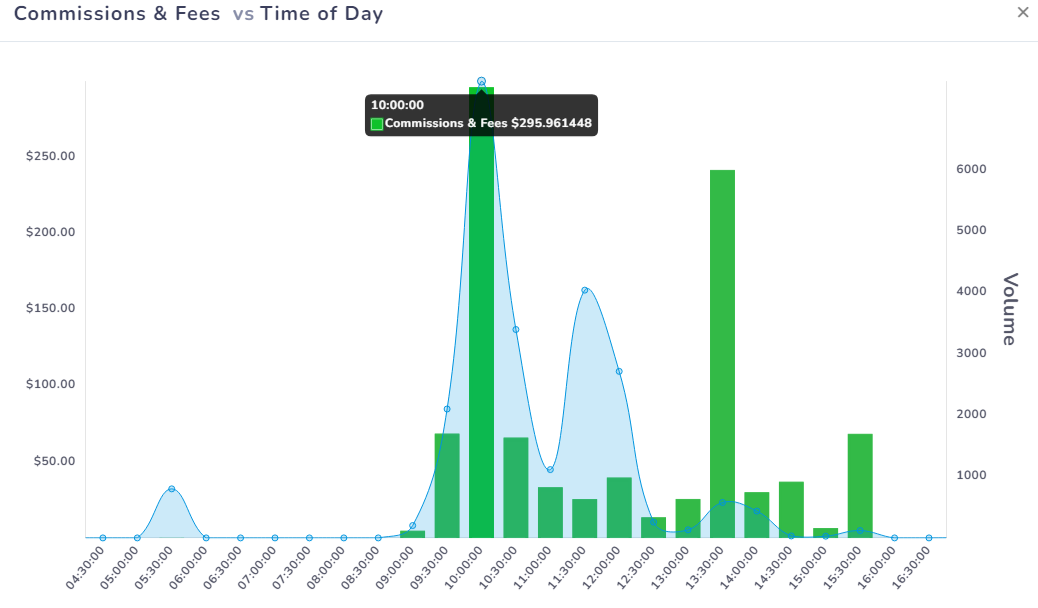
- Comms/Fees vs Time of day
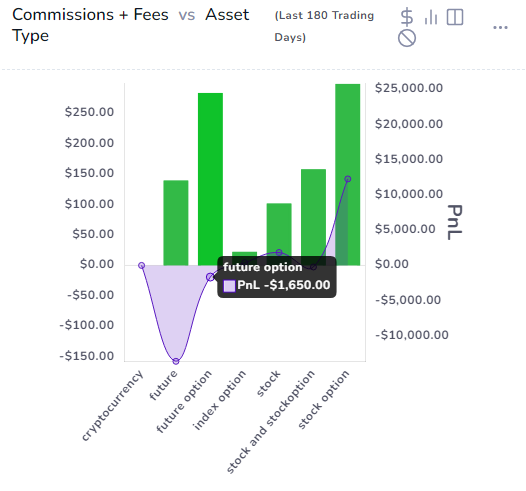
- Comms/Fees vs Asset type
You can choose to view:
- Commissions only
- Fees only
- Commissions + Fees
By using the metric dropdown at the top nav bar. In addition to this, you will also be able to view PnL, Volume, and no, of trades as an overlay on each of these charts making it extremely customizable in terms of learning exactly where and how you are losing commissions/fees.
These charts are also available as widgets for the custom dashboards and also in the compare section.
We hope these visualizations help traders realize the cost of running a business - i.e trading and on how to minimize/optimize these costs.
If you have any questions, please contact us at [email protected].