Visualizations
19 min read
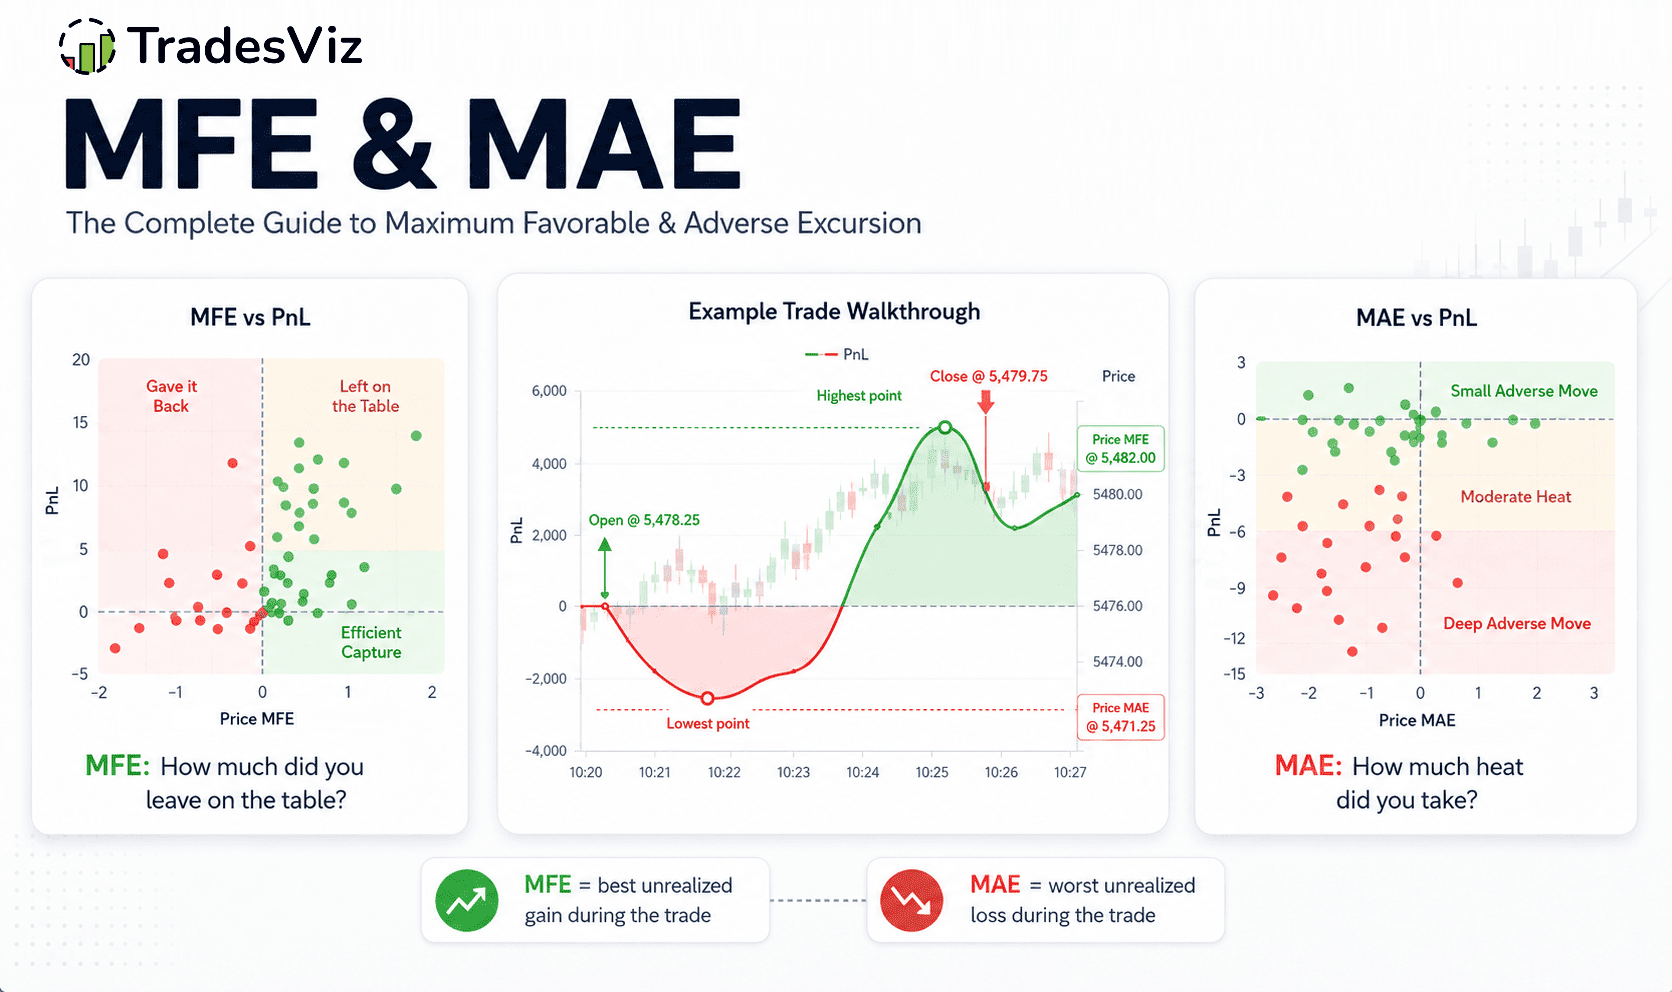
MFE & MAE: The Complete Guide to Maximum Favorable & Adverse Excursion
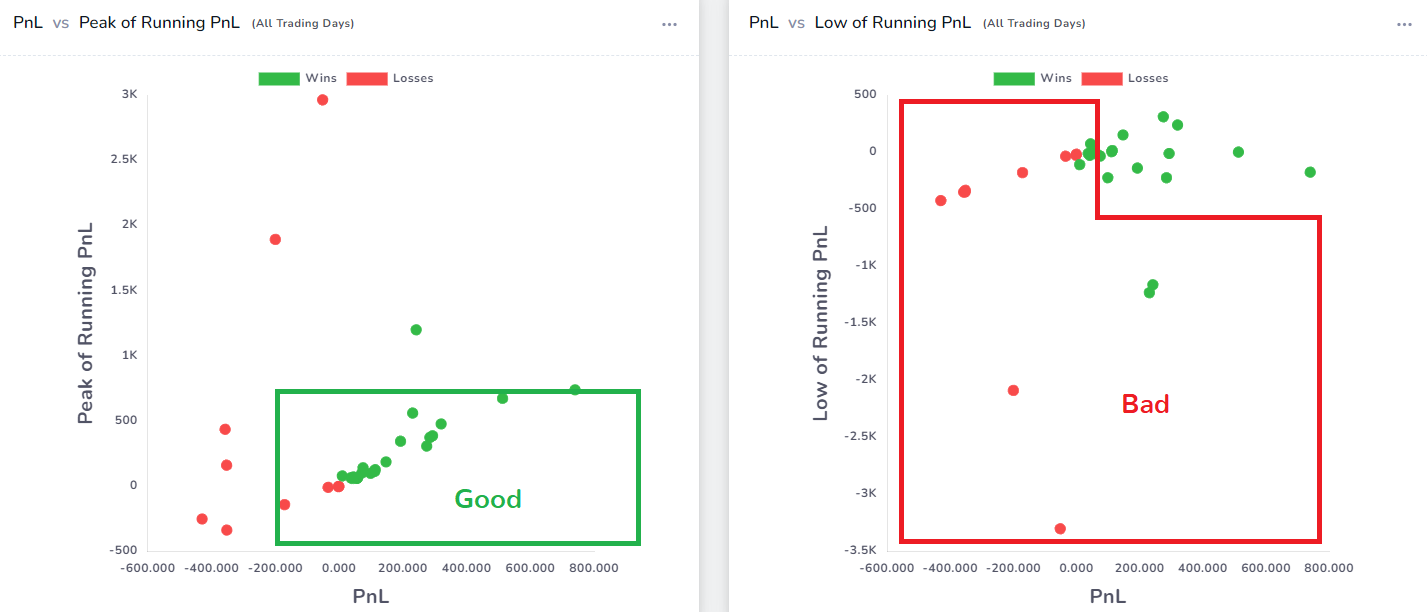
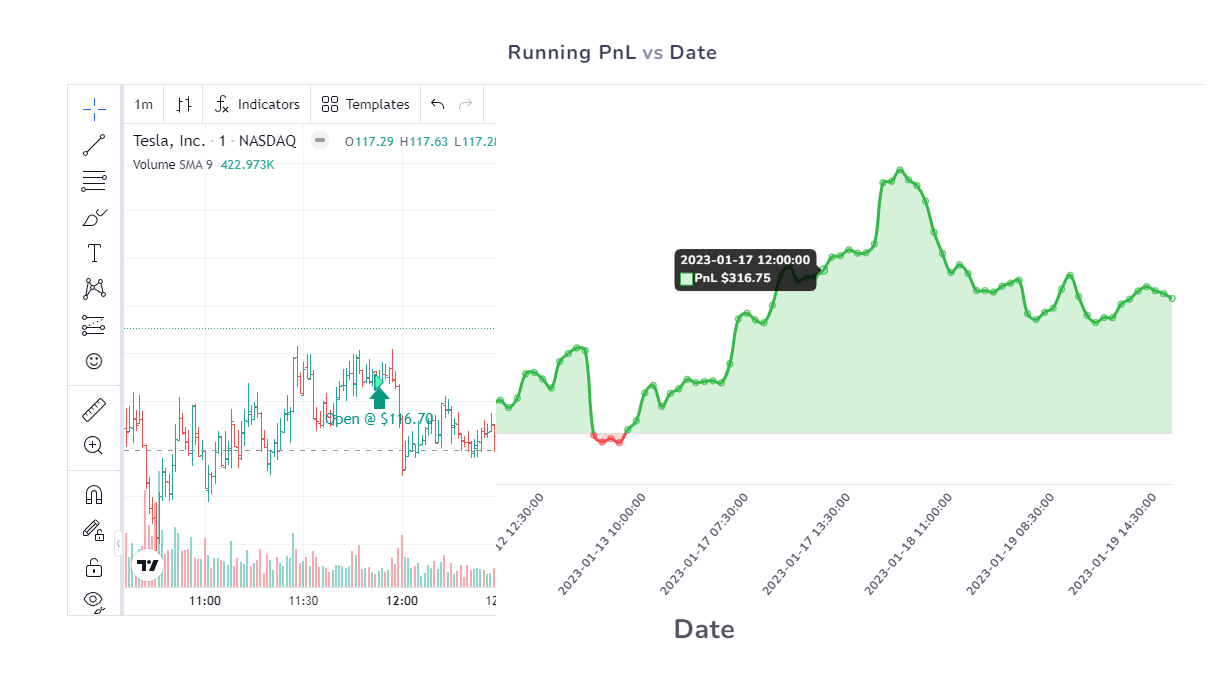
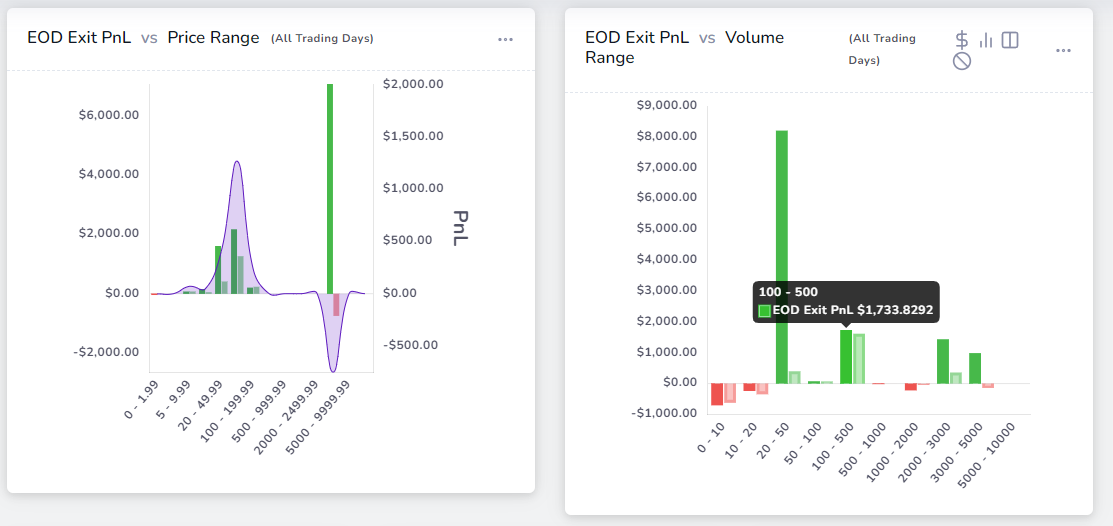
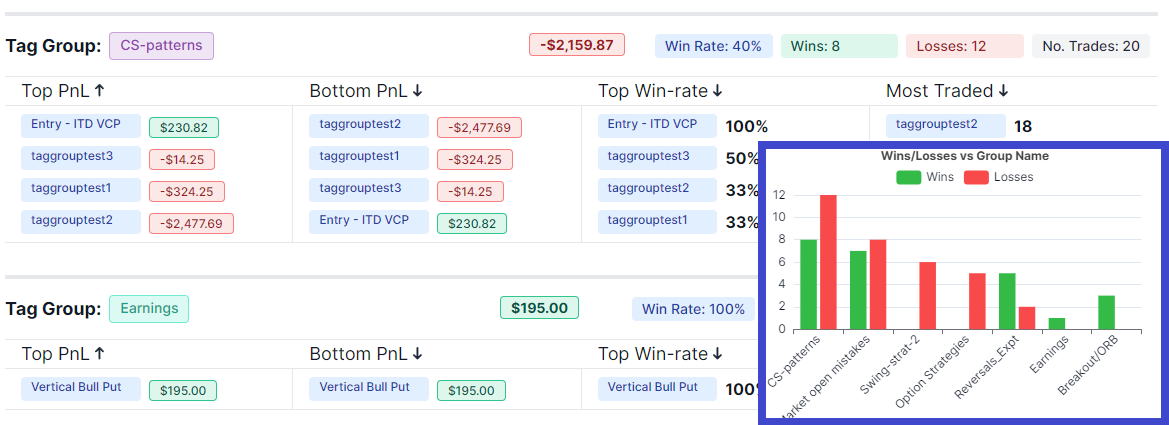
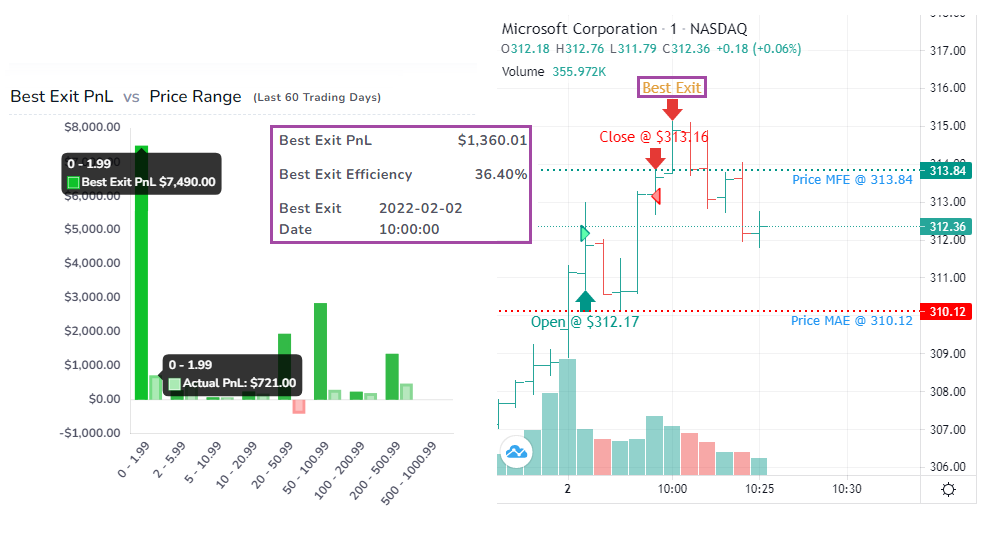
What MFE and MAE actually mean, how TradesViz calculates them (price vs theoretical vs running PnL), and how to read all 8 charts to fix your exits and stops. A new addition to TradesViz charts: MFE/MAE vs trade properties charts. You can now analyze and find the best profit and stop targets for all of your trades. Like every other TradesViz chart, these charts are also FULLY EXPLORABLE!