For this post, we are going to introduce 2 new features that were common feature requests from our users!
- Continous intraday/intratrade charts
- Fixed date selection timeframes
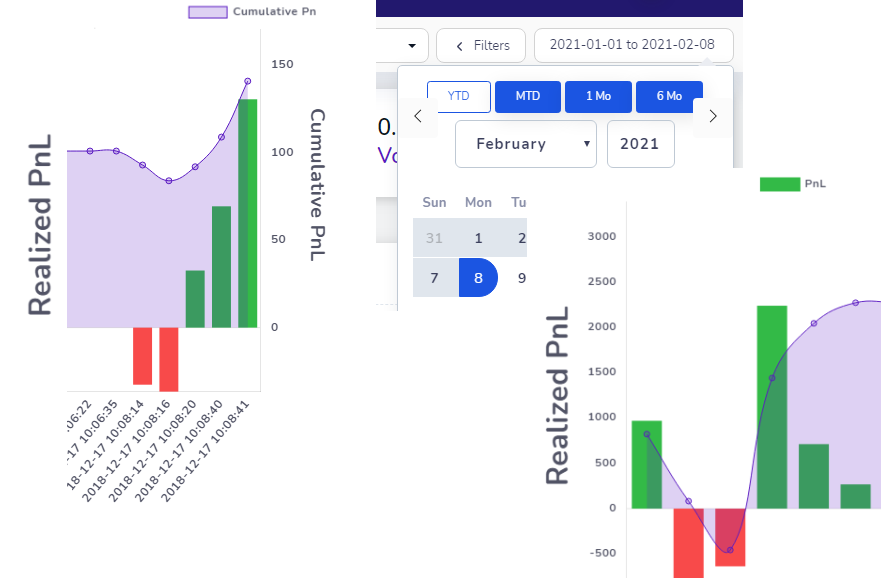
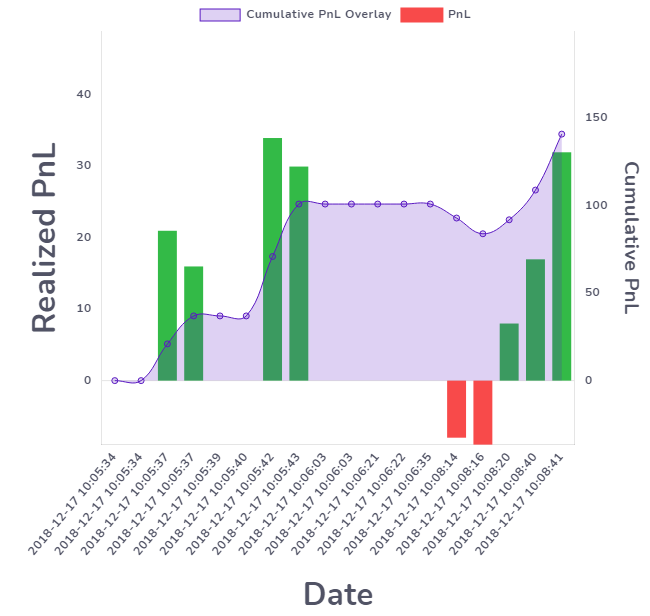
First, we will explore the continuous pnl charts. These charts show you the realized pnl (after completion of a closing trade) for each type of data you are exploring. For example, the chart below shows each execution's realized pnl as you trade and also the total cumulative PnL as you complete each closing execution.
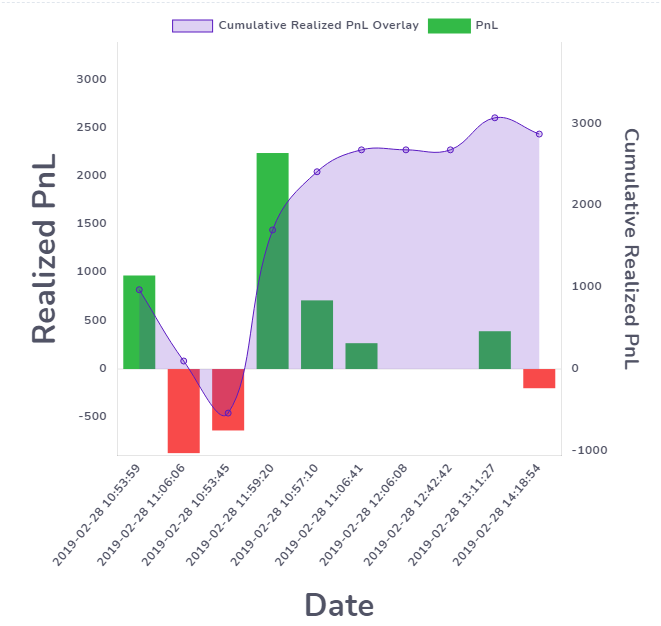
In the example below, we show the same concept applied for an entire trading day where several trades were closed. Note that in these charts, pnl is marked according to closing and not opening (which is how all the other charts in TradesViz operate)
What's the point of these charts? it allows you to make decisions on when you should stop trading and when you can increase/decrease size. Especially, if you are a trader who regularly scales in and out of trades, this chart will tell you what type of scaling is most beneficial to you - whether you should stop after the first 3 buys or stop after you reach a particular pnl amount, etc.,
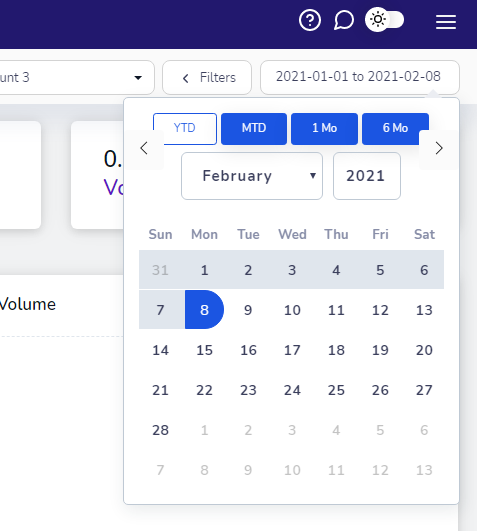
Finally, we added a simple change to the calendar widget which makes selecting date range easier. Instead of manually selecting each date, if all you are interested in is in your YTD performance, just click on the YTD button and you're set!
That's it for our newest features report! We have also fixed a lot of bugs with date selection, trades processing, massively improved a lot of import modules for broker/platform-based auto-imports. We also perform regular maintenance to keep our servers in optimal conditions to ensure maximum performance!
Let us know if you have any other feature requests and please don't hesitate to contact us at [email protected] if you have any queries!