This is another "what if" analysis of how your performance would have been if you were in that trade till the end of the day. This is unlike the "best exit" analysis that we launched earlier this year.
So, what is the difference?
EOD exit is very simple: If your last execution was done at the end of the day right before market close, what would have been your pnl?
Whereas, the best exit was: If your last execution was pushed further (i.e you hold it a little longer) until you reach a point where you are taking more risk than the amount you took when you were actually in the trade. This is a bit unrealistic in the sense we are trying to pretty much time the top or bottom with risk parameters. This analysis is to give traders an idea of how well they would have done IF their risk management was good enough.
However, EOD analysis is very simple to both learn from and apply directly to your trading. Sometimes, depending on market conditions, it may simply be favorable for you to stay in your positions still before market close and simply close your positions a few minutes before the closing bell.
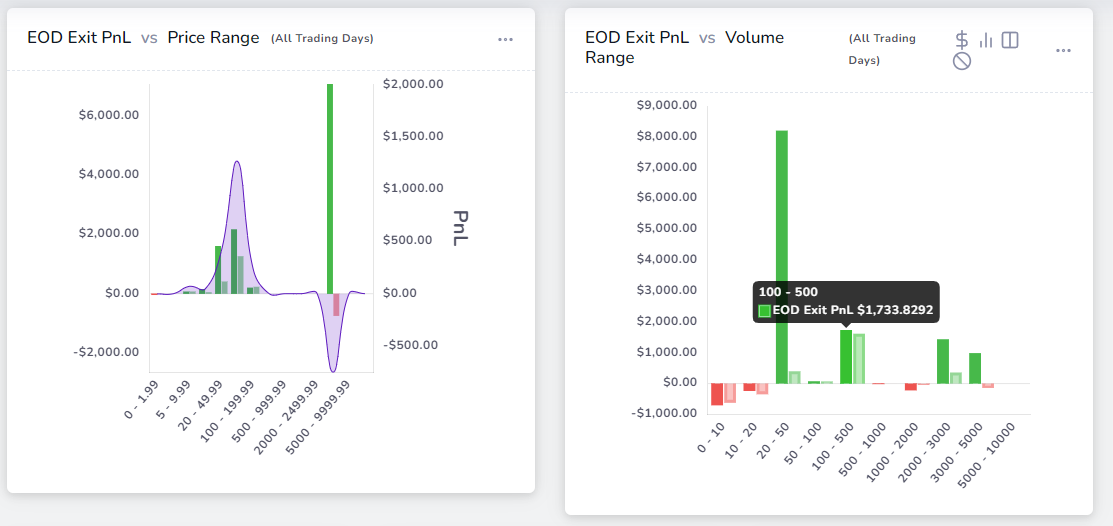
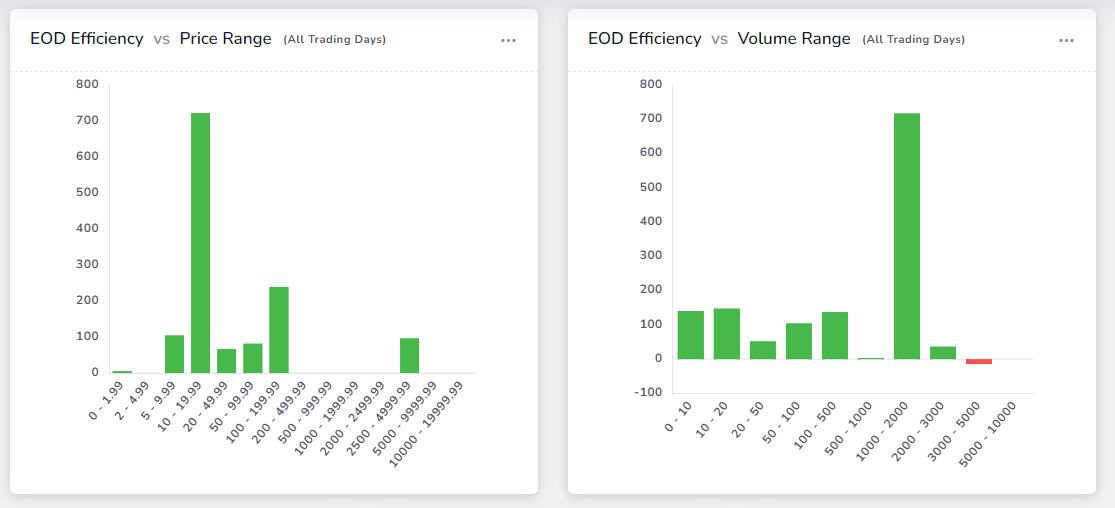
Here's the EOD analysis for a set of trades:
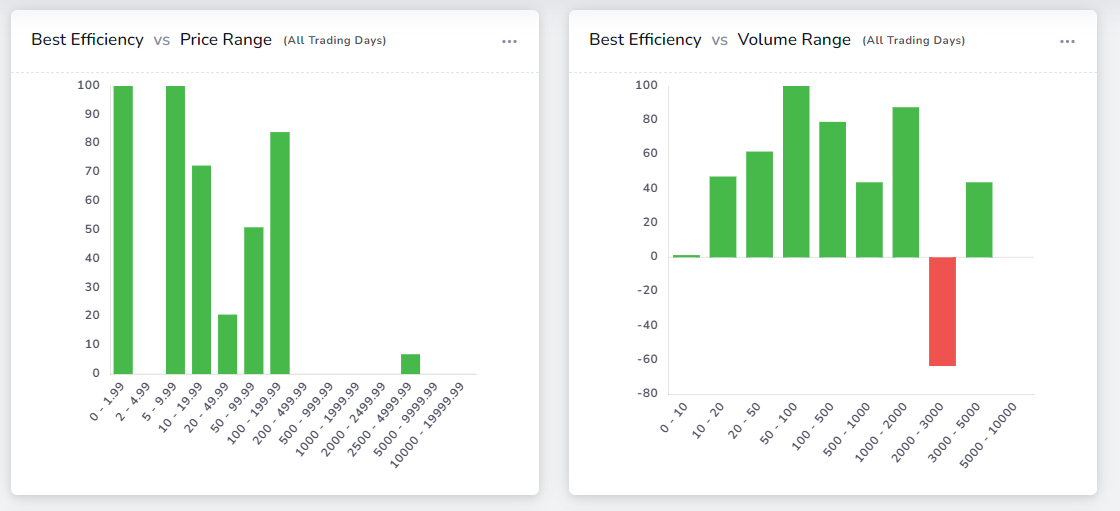
Here is the "best exit" analysis for the same set of trades:
Few major takeaways:
- Lower priced trades are risker to hold till EOD
- It is better to hold till EOD if you have a large position
- We are leaving a lot of money on the table for the $20-$200 range - in both the analysis
This is a very small sample set of real trades and their analysis. This works for stocks, futures, CFDs, forex, and crypto.
This also tests how well your strategy directly compares against a very simple hold till EOD strategy. A good takeaway is to see when to switch between your strategy and the hold till EOD strategy as this is a very easy-to-execute strategy and exit at the market close is even available as a function in some platforms/brokers.
Here are more comparisons:
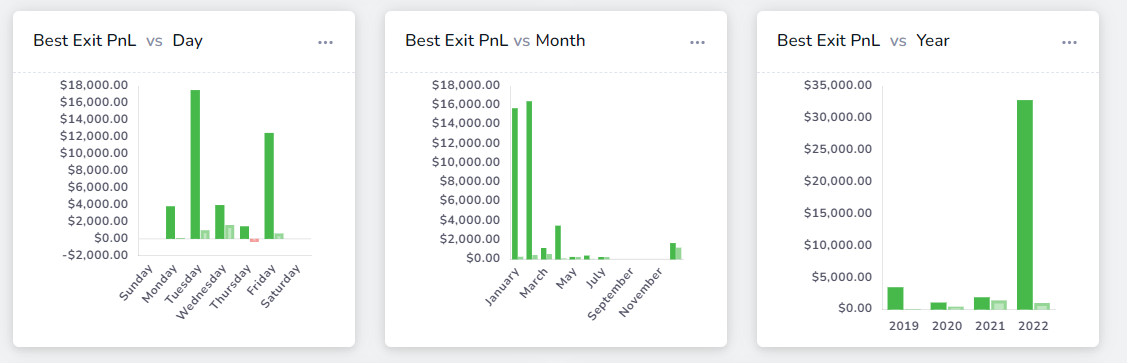
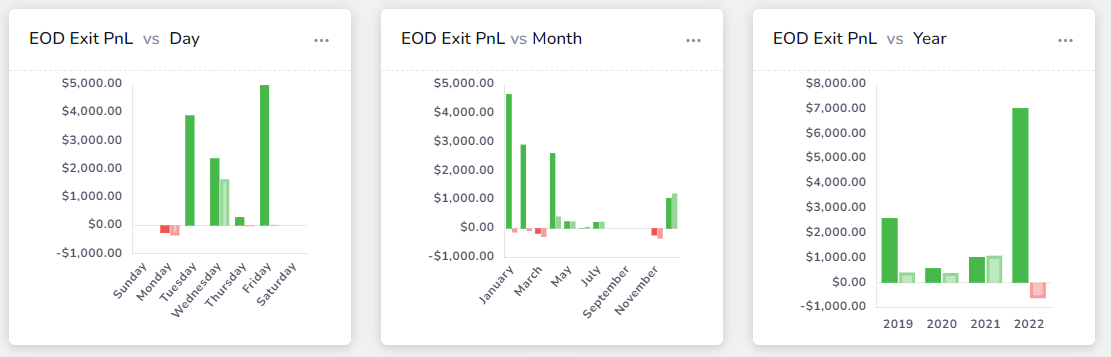
Take a look at the differences in the day of the week between both analysis - this alone can help you optimize your trading strategy to easily retain more of your profits.
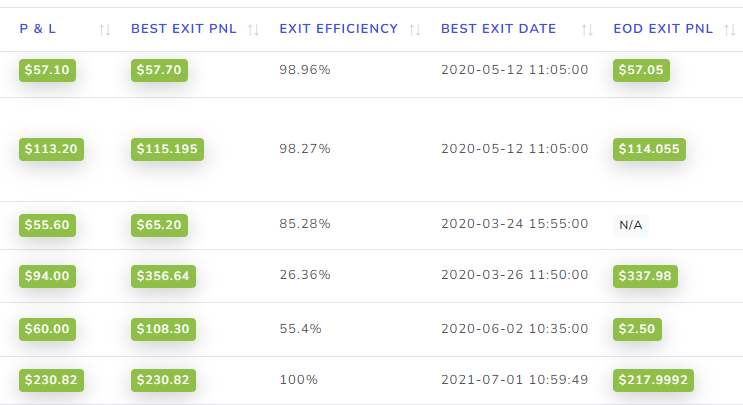
Finally, these charts are also is also available as standalone widgets in the custom dashboard list. You can also check this in the trades table by rearranging the columns and/or toggling between the horizontal scroll mode to view all 3 stats: your original pnl, the best exit pnl, and the EOD pnl at once:
As always, we want to bring the most actionable insights to traders to find ways to improve trading performance. We hope this helps traders - even beginners to find a simple optimized strategy to tackle difficult markets.
Update July 2023 - EOD Exit for Options
You can now generate the EOD exit for options (single leg trades only) by manually clicking on the Re-calculate button when on trade explore page. This is the first time an online trading journal has EOD exit stats for options!
This was a feature request from frequent users of Exit analysis so if you have any feature requests or feedback for us, please send us an email at [email protected]