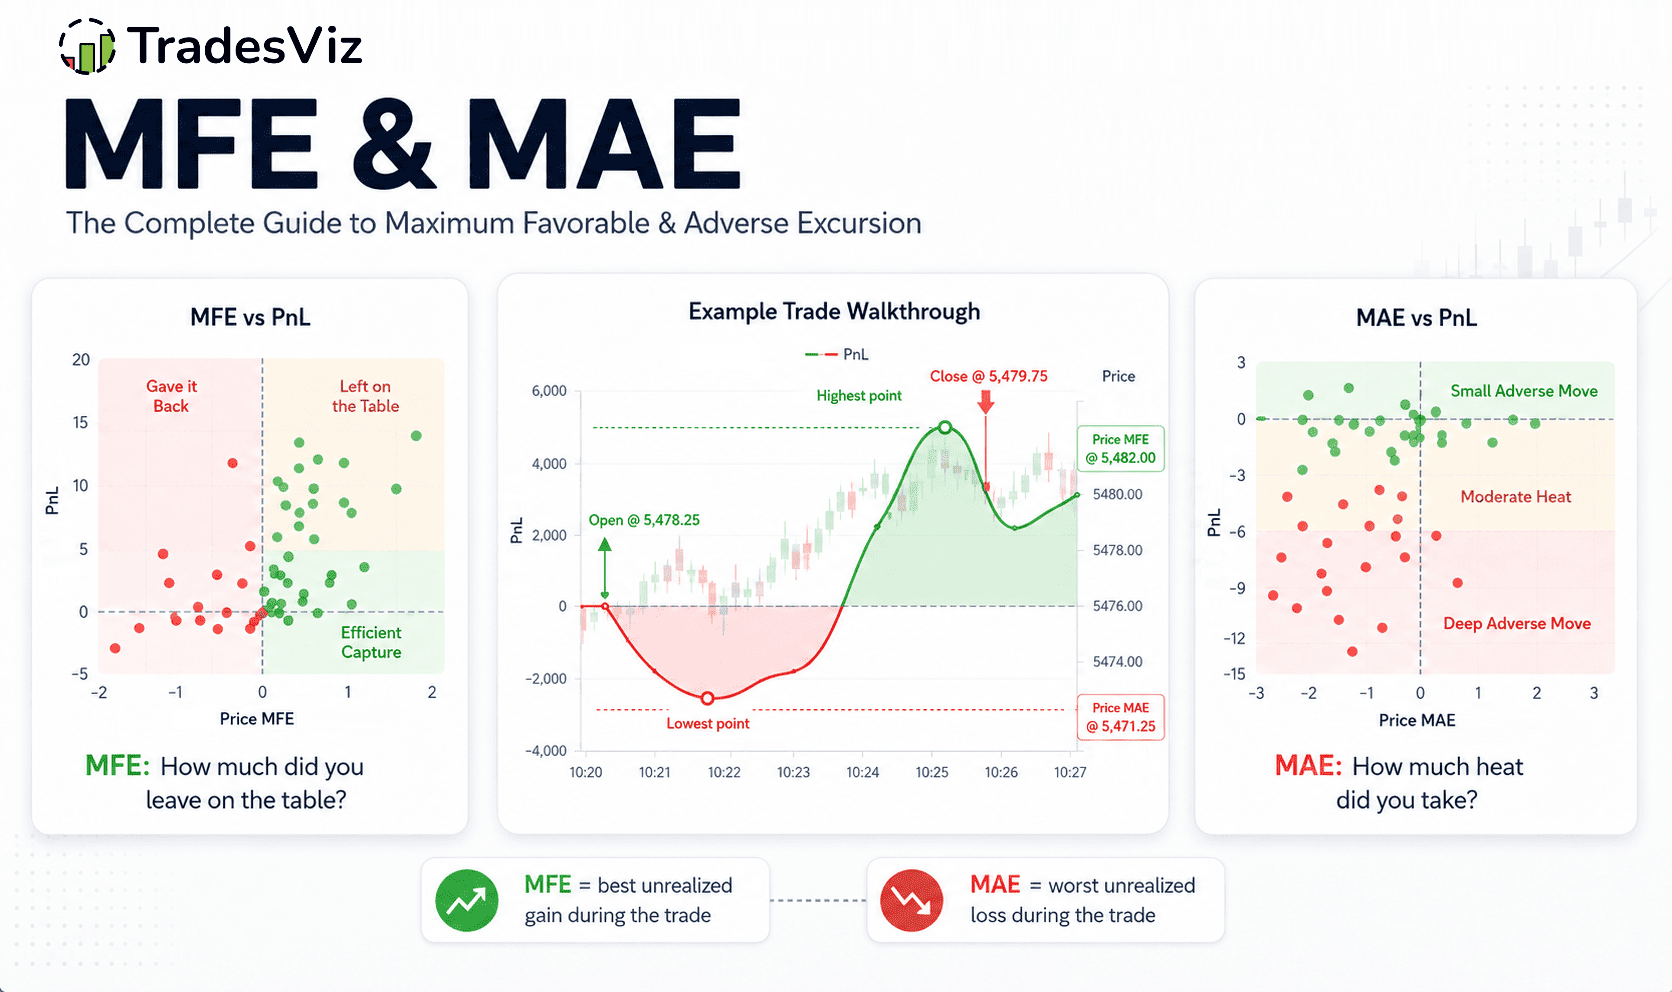
Updated for 2026: MFE/MAE is no longer a nice-to-have metric. If you are serious about trade review, funded account risk, stop placement, or exit quality, this is one of the first advanced stats you should understand.
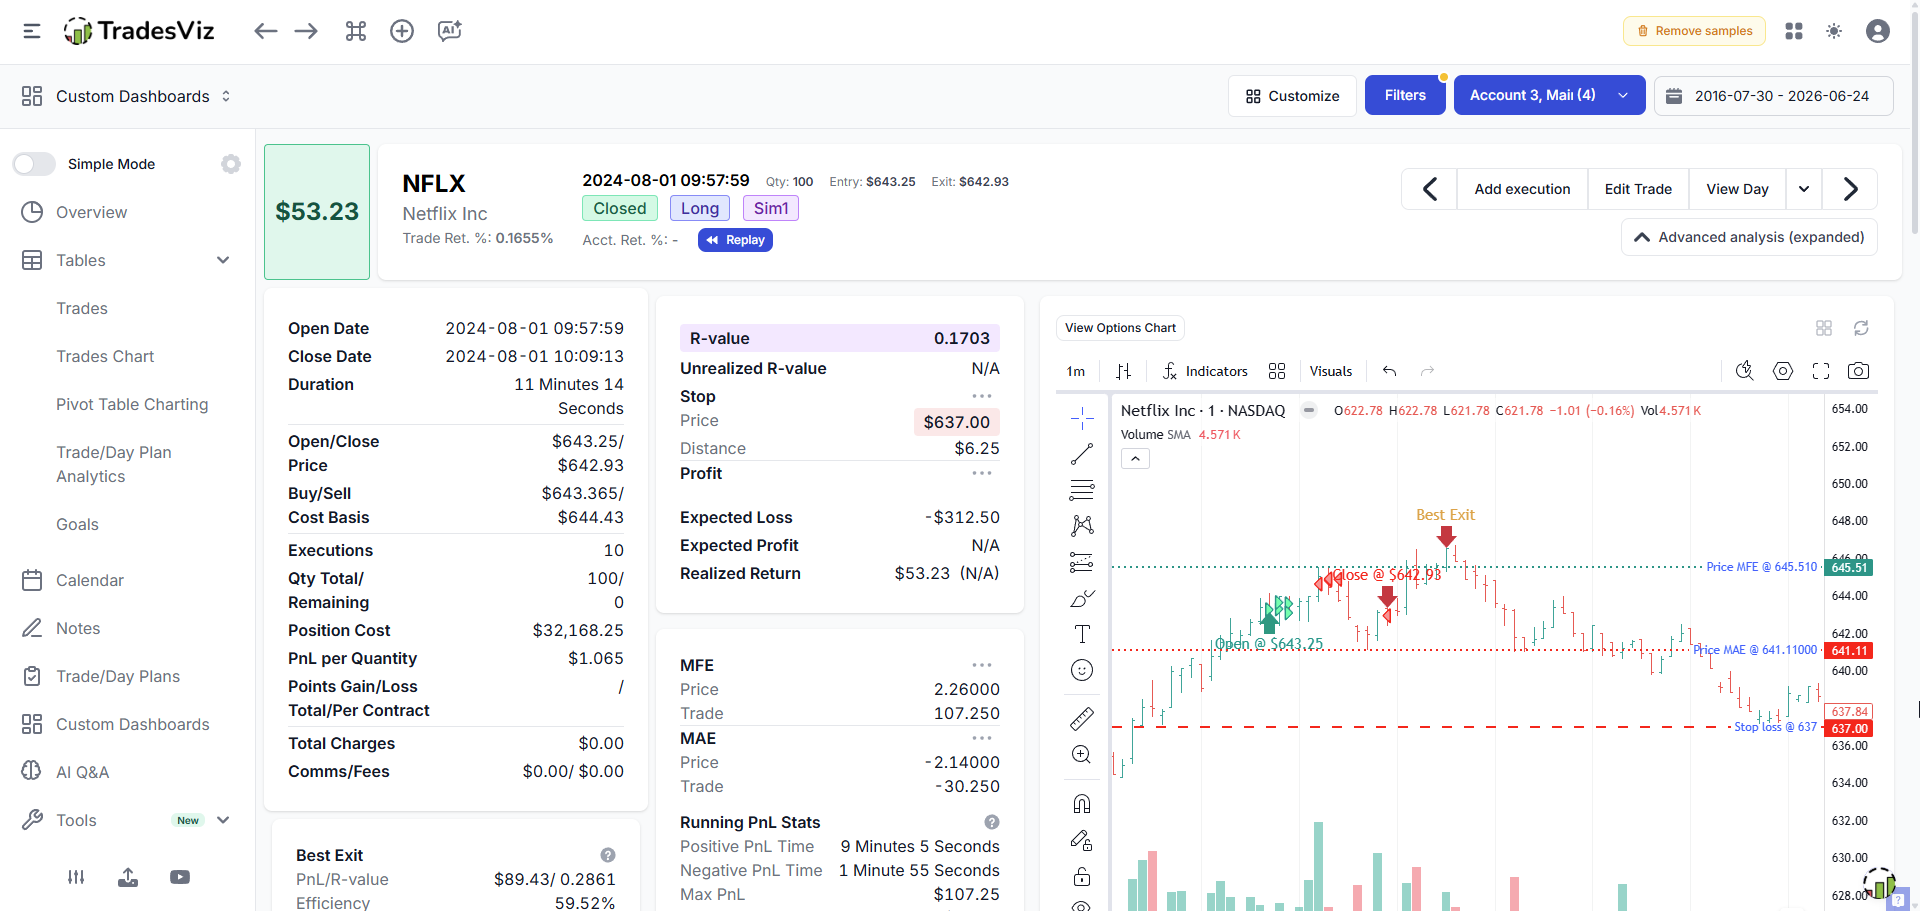
Every trade you take has two important points you usually do not exit at: the best point while you were in the trade, and the worst point while you were in the trade. The gap between those points and your actual exit is where a lot of trading performance quietly leaks away.
That gap has two names: MFE and MAE. Used properly, they answer questions that win rate and total PnL cannot answer by themselves:
- Am I cutting winners too early and leaving too much profit on the table?
- Are my stops too tight, taking me out before the trade has a real chance to work?
- Am I taking too much heat for the amount I finally make?
- Does my behavior change when I increase size, trade at a certain time, or hold longer?
There is a lot of generic advice around this topic: "let winners run", "cut losers short", "use wider stops", and so on. This sounds good, but it is not analysis. You need to look at what actually happened in your own trades. That is what MFE/MAE charts are for.
What are MFE and MAE?
The important word is during. MFE and MAE are not your entry, not your exit, and not your final result. They are the best and worst points reached while you were still in the position.
This means a trade can have a large MFE and still end as a loser. It also means a trade can be profitable while having an ugly MAE. In the first case, you gave back the move. In the second case, you probably took more risk than the final result makes obvious.
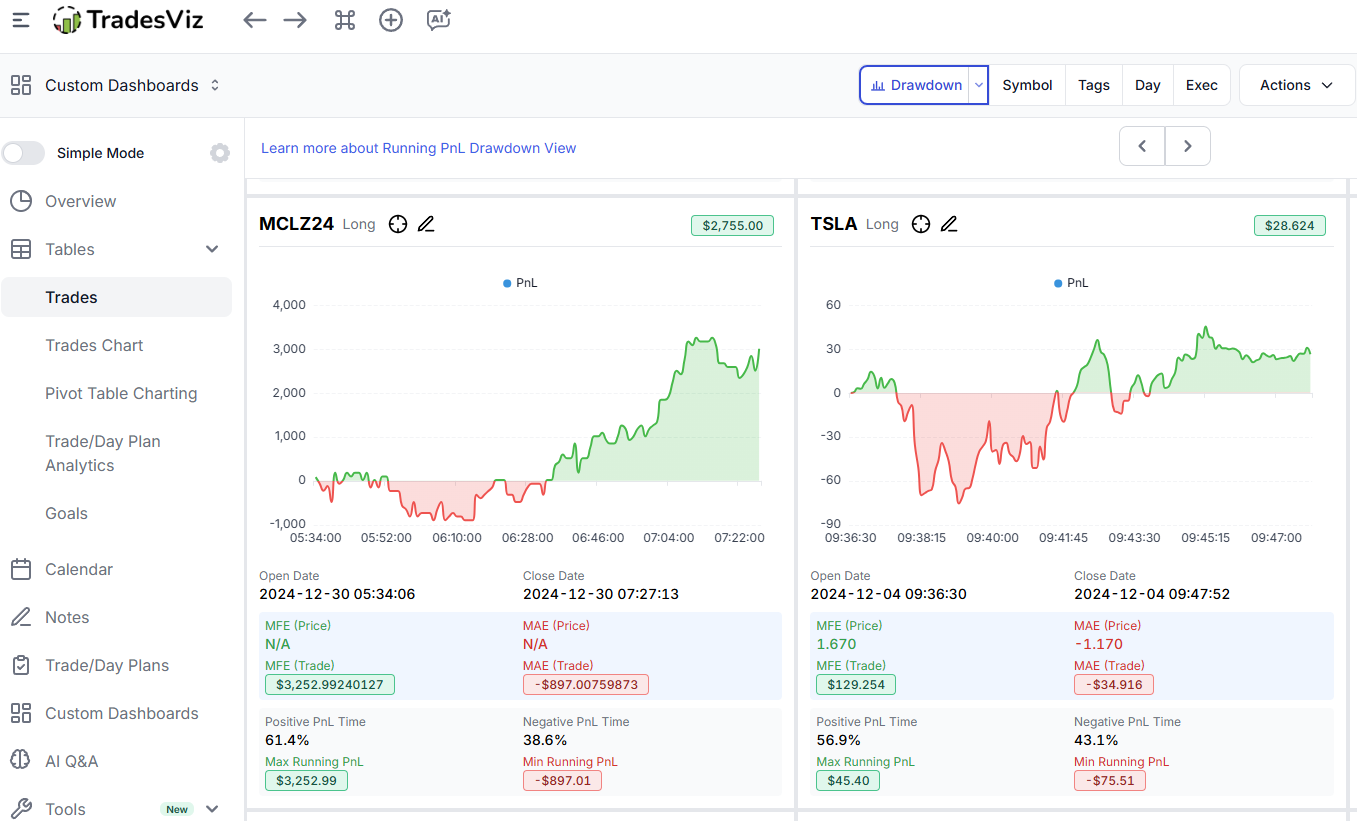
If you remember only one thing from this post, remember this: MFE measures the best the trade got, MAE measures the worst, and your exit sits somewhere between those two points. Your job is to study that gap with enough context to make better decisions.
Why MFE/MAE matters
MFE/MAE is useful because it separates trade opportunity from trade result. PnL tells you what you booked. MFE/MAE tells you what happened before you booked it.
- Large MFE but small realized profit: you had a good move and did not keep enough of it.
- Large MFE but negative PnL: you were up and still turned the trade into a loss. This is one of the most expensive patterns to ignore.
- Large MAE with small profit: you took a lot of drawdown to earn very little. That may work a few times, but it is not healthy risk management.
- Small MAE on trades that later worked: your stop may be inside normal market noise.
But MFE/MAE should not be read in isolation. A low MFE capture may be fine for a high-frequency strategy that intentionally takes small slices. A large MAE may be acceptable only if the reward-to-risk and win rate support it. This is why we keep saying in many TradesViz posts: do not worship one stat. Combine MFE/MAE with R-value and profit factor, exit analysis, and your own strategy tags.
Price, theoretical, and running-PnL MFE/MAE
This is where many traders get confused, and frankly, this is where most journals do a poor job explaining the metric. TradesViz exposes the different views because they answer different questions.
1. Price MFE/MAE - the raw price move
Price MFE/MAE is the raw movement from your entry to the best or worst price reached while the trade was open. It ignores position size and focuses only on price.
For a long trade:
- Price MFE = highest price during the trade - entry price
- Price MAE = lowest price during the trade - entry price
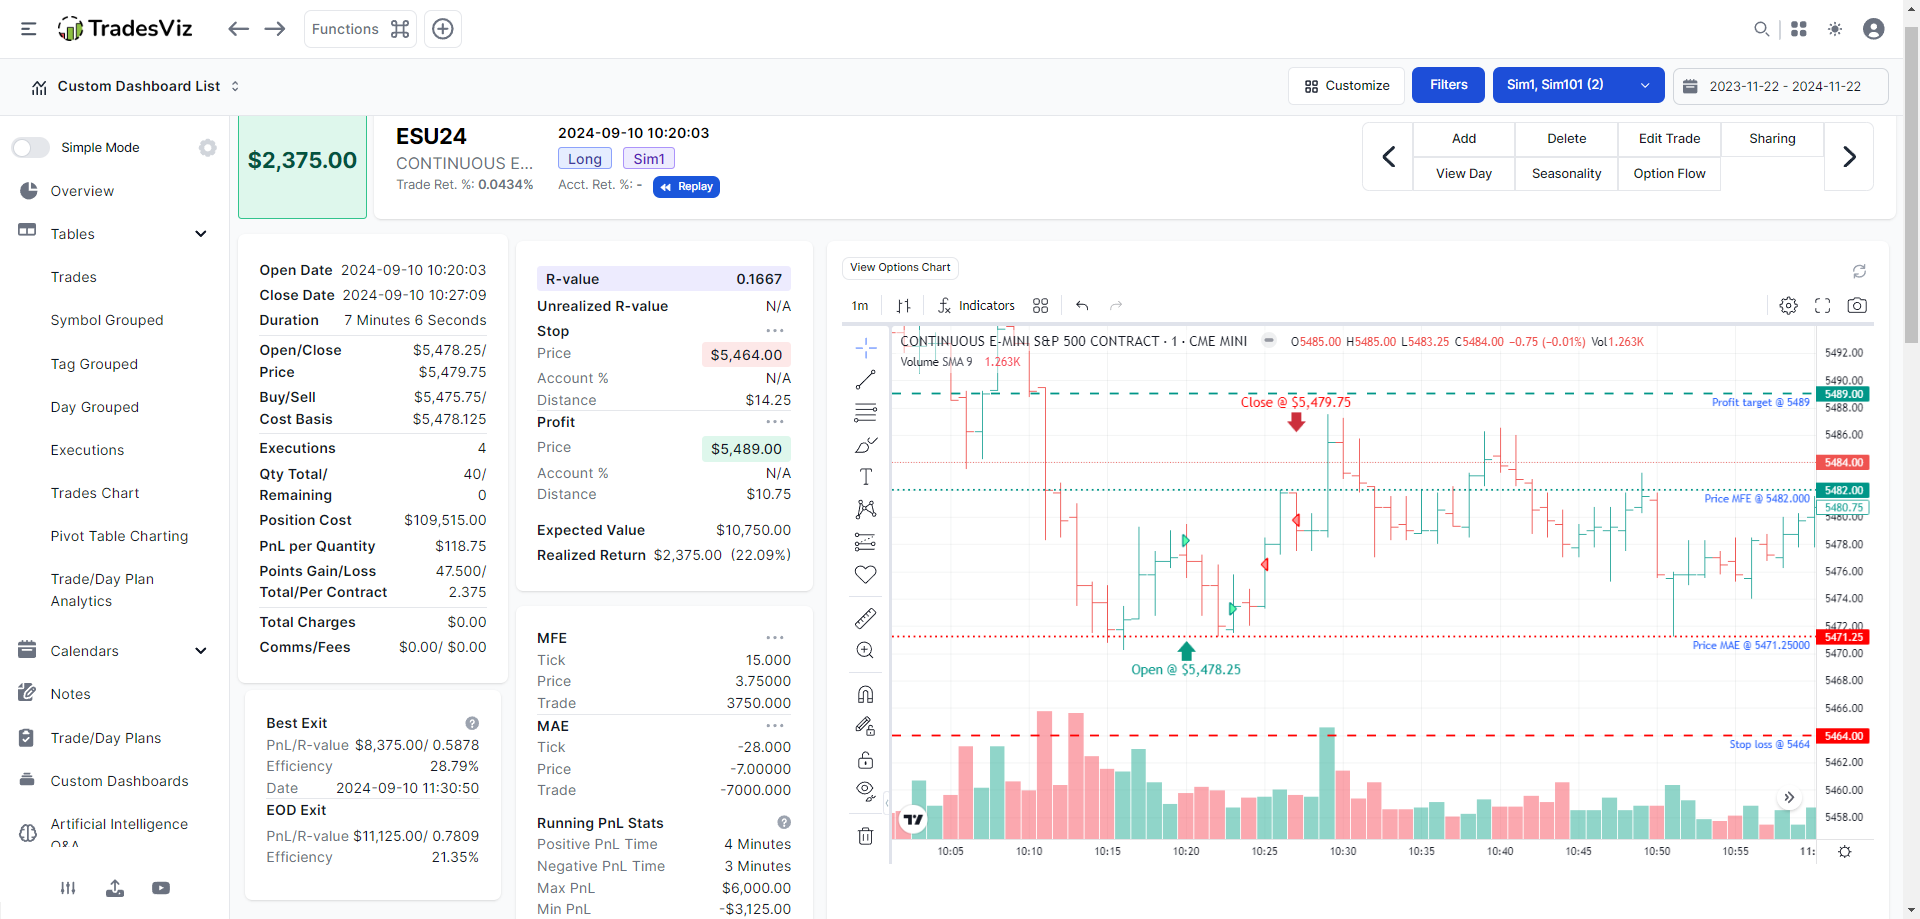
Example: an ES trade opened at 5478.25. During the trade, price reached 5482.00 and dropped to 5471.25.
- Price MFE = 5482.00 - 5478.25 = 3.75 points
- Price MAE = 5471.25 - 5478.25 = -7.00 points
That is the pure price story: the trade moved 3.75 points in your favor and 7 points against you. This is useful because it lets you compare behavior without position size distorting the picture.
2. Theoretical trade MFE/MAE - the strict full-position view
Price movement is not the whole story. If you trade 1 contract and someone else trades 20 contracts, the same 3.75 point move does not mean the same account risk.
Theoretical trade MFE/MAE asks: what was the maximum possible PnL swing if the full position size is applied to the price extreme?
Using the ES example above with 20 contracts and $50 per point:
- Theoretical trade MFE = 3.75 points * 20 contracts * $50 = $3,750
- Theoretical trade MAE = -7.00 points * 20 contracts * $50 = -$7,000
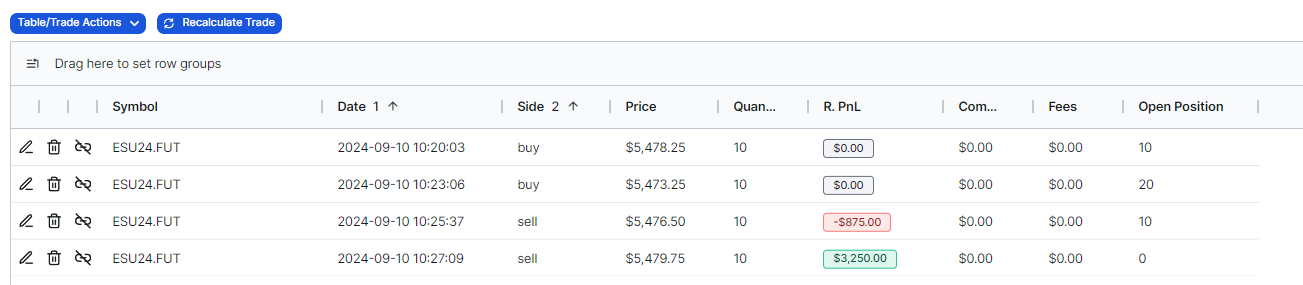
| Price | Trade PnL | Ticks | |
| MFE | 3.75 | $3,750 | 15 |
| MAE | -7.00 | -$7,000 | -28 |
This is strict by design. It tells you the no-excuses, full-position answer to: how bad could this have been? This is the view you get when the setting "Use running PnL for Trade MFE/MAE calculation" is unchecked.
3. Running-PnL MFE/MAE - what your account actually experienced
If you scale in and out, your position size changes during the trade. In that case, theoretical full-size MFE/MAE and what your account actually experienced can be very different.
Running-PnL MFE/MAE uses the highest and lowest points of your open PnL during the trade:
- Running MFE = peak of the running-PnL curve
- Running MAE = trough of the running-PnL curve
TradesViz samples running PnL every few seconds to a minute depending on trade duration. That curve is visible on the trade explore page, and the peak/trough become the running MFE/MAE values when the running-PnL setting is enabled.
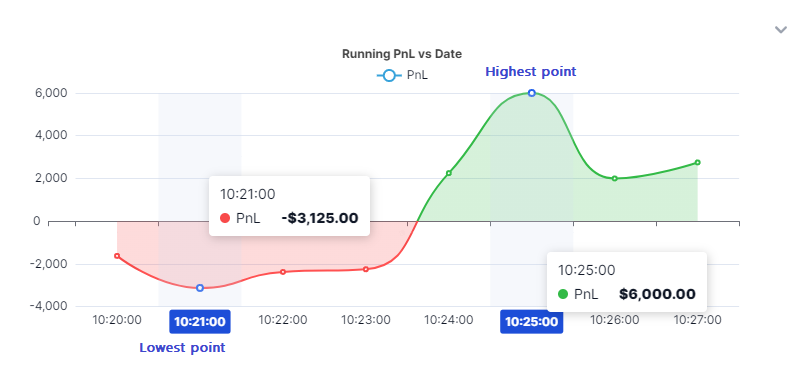
This running view is especially important for scalpers, funded accounts, and prop firm traders because it is closer to the actual account experience. If your running MAE was -$1,000 and you closed the trade for $100, that trade may not be as good as the green PnL suggests.
Why theoretical and running values often do not match
They do not have to match. Theoretical assumes your entire position size at the price extreme. Running PnL uses the position size you actually had at each moment.
If you scaled in after the best part of the move already happened, your theoretical MFE may look large while your running MFE is much smaller. Neither number is "wrong". They are answering different questions:
- Theoretical MFE/MAE: full-size risk/opportunity at price extremes.
- Running MFE/MAE: actual peak/trough open PnL experienced by the account.
The zero-out setting
There is another setting worth understanding: "Use alt. calculation for MFE/MAE values in cases where prices never go against entry direction?"
This setting controls how TradesViz handles cases where the trade never really went to the "wrong" side. For example, if a long trade never goes below entry, the worst open PnL during the trade can still be positive. That positive value is technically the minimum running PnL during the trade, but some traders prefer MAE to show as zero when price never went against entry.
When this setting is enabled, TradesViz clamps that edge case to zero: MFE is zeroed if the trade never had favorable open PnL, and MAE is zeroed if the trade never had adverse open PnL. When it is disabled, TradesViz preserves the actual best/worst running PnL values, even if the "worst" value is still positive or the "best" value is still negative.
Changing either MFE/MAE setting does not automatically recalculate existing trades. Recalculate a single trade from the trade explore page, or use Group apply in the trades table to recalculate selected trades in bulk.
Which MFE/MAE number should you use?
This is the clarification that prevents most confusion. In TradesViz, Tick, Price, and Trade MFE/MAE are not interchangeable. They answer different questions.
| Metric | What it means | What it does NOT mean | Use it when... |
| Price / Point MFE/MAE | The raw price or point distance from entry to the best/worst price reached during the trade. | It is not dollars. It does not include quantity. | You want to compare the move itself without position size affecting the stat. |
| Tick MFE/MAE | The same raw move expressed in ticks. | It is not dollars. It should not be multiplied by final quantity after the fact. | You trade futures or tick-based products and want to know how many ticks the trade moved. |
| Price / Point % MFE/MAE | The raw favorable/adverse price move as a percentage. | It is not the account return and not the realized trade return. | You want normalized price movement across symbols with different prices. |
| Trade MFE/MAE | The PnL value of the favorable/adverse excursion. | In running-PnL mode, it is not max ticks multiplied by your eventual total scaled quantity. | You want to answer: "How much money was I up or down before I exited?" |
Why we do not multiply max ticks by final quantity
Because that would be a fake number for scaled trades.
Suppose you buy 1 contract, the trade reaches its best tick value, then price dips, and only after that you add 10 more contracts. If we multiplied the best tick move by all 11 contracts, we would be reporting a profit that never existed. You did not hold 11 contracts at the MFE point. You held 1.
That is exactly why running-PnL Trade MFE/MAE exists. It uses the quantity you actually held at each point in time and reads the true peak/trough of your open PnL curve. It answers the question traders actually care about: what was the maximum real open profit or drawdown I had during this trade?
Where to find MFE/MAE charts in TradesViz
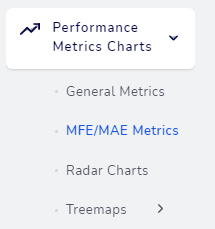
You can find MFE/MAE charts under Performance metrics charts in the dashboard. Individual trade MFE/MAE values are also shown on the trade explore page and can be used in your trades table, pivot grid, filters, and custom dashboard workflows.
These stats rely on market data and are not real-time. Trades imported today may show N/A until the late EOD or early morning calculation finishes. If an older trade still shows N/A after data should be available, recalculate it before assuming anything is broken.
The MFE/MAE charts and how to read them
TradesViz gives you the main MFE/MAE comparison charts under Performance metrics charts:
- MFE vs PnL
- MAE vs PnL
- MFE vs Volume
- MAE vs Volume
- MFE vs Open time
- MAE vs Open time
- MFE vs Close time
- MAE vs Close time
Most journals stop at MFE/MAE vs PnL. We include volume and open/close time because, from our experience talking with traders and building analytics since 2019, the non-obvious leaks often show up in size and timing.
MFE/MAE vs PnL - are your exits efficient?
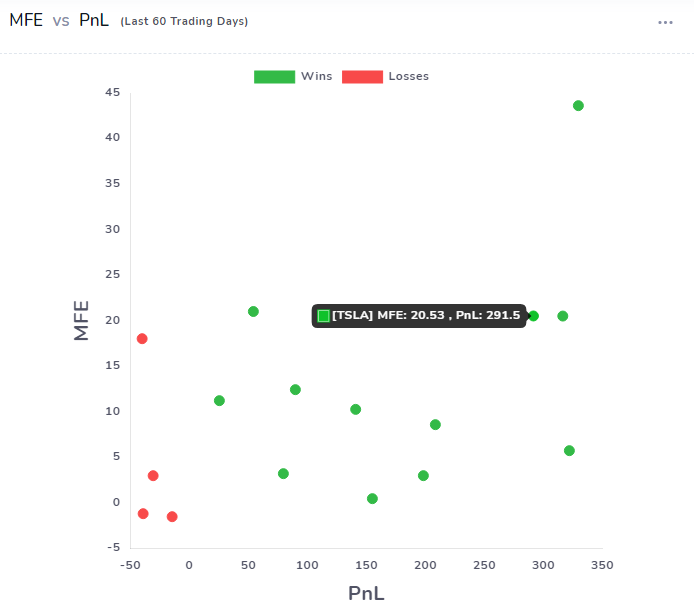
This is the first pair to study. MFE vs PnL shows how much of the available favorable move you actually kept. MAE vs PnL shows how much heat you took to get your result. The fastest way to read either one is to split the chart into regions and see where your dots fall.
In both charts, PnL is on the X axis and the excursion (MFE or MAE) is on the Y axis. Two reference lines do most of the work: the vertical line at PnL = 0 (losses on the left, wins on the right) and the horizontal line at the excursion's zero.
MFE vs PnL: did you keep the move?
The two zero lines carve an MFE vs PnL chart into three zones you care about:
- GOOD (bottom-right): winning trades whose MFE is close to what you booked. You caught the move and kept most of it.
- WATCH (top-right): winning trades sitting high above the PnL axis. You won, but the trade was up far more than you took - money left on the table.
- BAD (top-left): losing trades that still had a real favorable excursion. You were green, then gave the whole thing back and closed red. This is the most expensive habit on the chart.
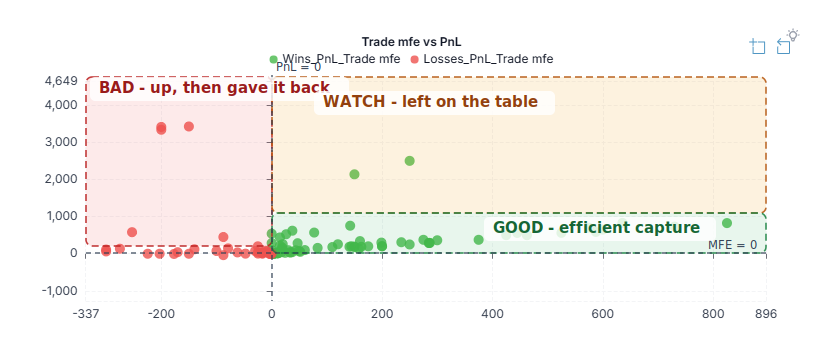
Trade MFE vs PnL (dollars). The zones map straight to account impact: the cluster near GOOD is efficient capture, dots stacked in WATCH are profit left on the table, and the two dots in BAD were up ~$3,000 before closing at a loss.
The chart above is in dollars (Trade MFE). The same read in raw price points (Price MFE) is below - useful when you want to compare behavior across symbols or position sizes without dollar size distorting the picture:
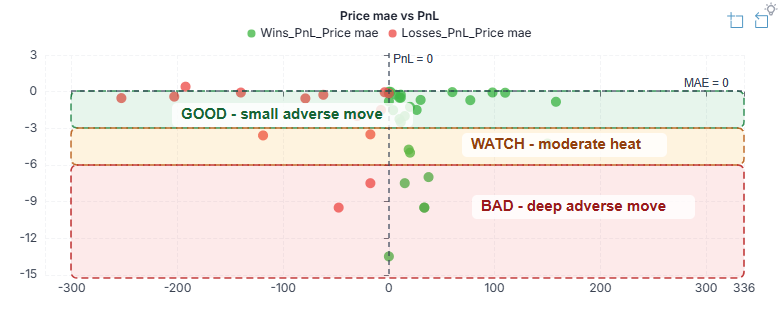
Price MFE vs PnL (points). Here the high dots in WATCH are trades where price ran 16-19 points your way and only part of it was booked.
A cluster hugging the GOOD zone means efficient exits. A column of dots stacked up in WATCH means you consistently bail before the move is done - widen targets or add a trailing stop, but verify it first with best exit and exit-efficiency charts. Anything in the BAD zone is a trade-management problem worth clicking into one trade at a time.
MAE vs PnL: how much heat did you take?
MAE vs PnL is the risk mirror. MAE is negative (it runs downward), so the deeper a dot sits, the more drawdown that trade put you through while it was open. Read it as horizontal bands - smaller heat is always better, no matter where the trade finished:
- GOOD (top band, near MAE = 0): the trade barely went against you. Clean, well-controlled risk.
- WATCH (middle band): moderate drawdown. Acceptable only if your reward-to-risk and win rate support it.
- BAD (bottom band): heavy heat. These trades took a large drawdown before resolving. A green dot down here is a winner you got lucky on - the process was risky, and the eventual loss will not be a surprise.
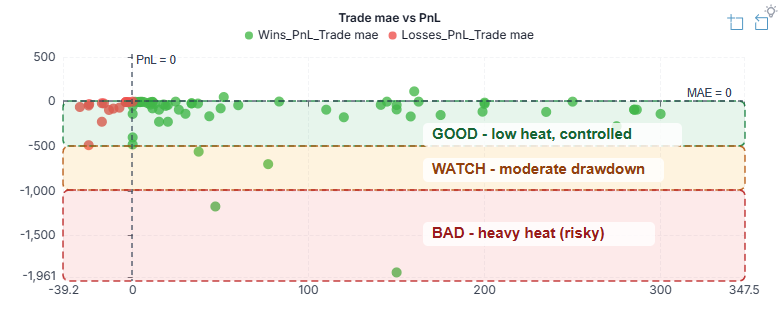
Trade MAE vs PnL (dollars). Most trades sit in GOOD with heat well controlled; the green dot deep in BAD was down ~$1,961 before it closed for a +$141 profit.
The dollar view (Trade MAE) is above; the raw-points view (Price MAE) is below:
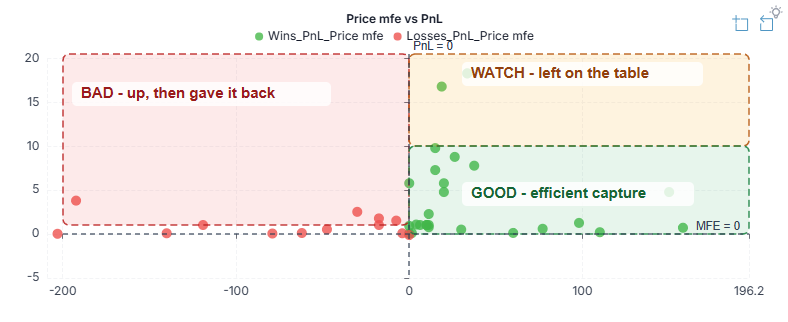
Price MAE vs PnL (points). The green dots in BAD are winners that ran 9-15 points against you before turning - the same lesson, measured in price instead of dollars.
The pattern to hunt for is green dots sitting deep in the BAD band: wins that cost far more drawdown than the result justifies. Those are exactly the trades that blow up an account on the day the bounce doesn't come. If your losers cluster just past your stop instead, the stop may be too tight - test a wider one with the Targets Simulator before changing anything live.
A note on the zone boundaries. The cutoffs drawn here (roughly -$500 and -$1,000 of heat, and an MFE level above a typical winner) are starting points, not rules. A scalper and a swing trader should not use the same thresholds. Set them to your own strategy, account, and risk profile. The point is not the exact lines - it is to see which region your dots cluster in, and then fix the cluster.
MFE/MAE vs Volume - does size change your behavior?
Volume comparisons answer a question that many traders do not want to ask: do I trade differently when I size up?
A common pattern is clean execution on small size and poor discipline on large size. Maybe the largest trades have the biggest MFE gap because you get nervous and exit badly. Or maybe MAE climbs with size, which means your biggest positions are also the ones absorbing the most drawdown. That is not a small detail. That is a risk-management issue.
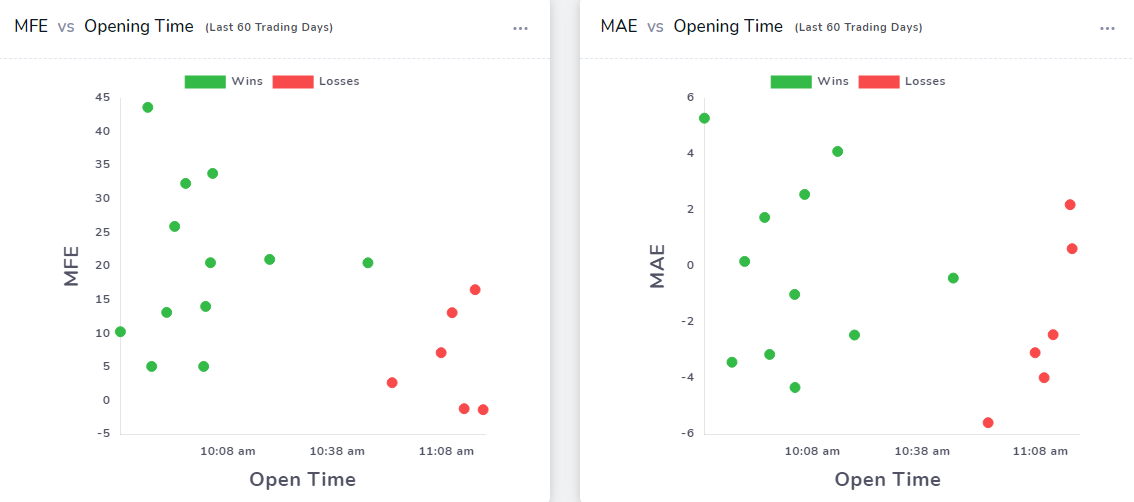
MFE/MAE vs open and close time - when does your edge exist?
Timing charts help you see whether favorable or adverse movement depends on when you enter or exit. Maybe trades opened in the first hour show strong MFE and low MAE. Maybe midday trades are mostly noise. Maybe MAE spikes on trades held into the close.
Do not treat this as prediction. Treat it as a historical profile of your own behavior and strategy. Then combine it with MFE/MAE duration analysis, exit analysis, and EOD exit analysis to test whether the timing pattern is actually useful.
Every MFE/MAE chart is explorable. Click a point to open the exact trade behind it. This is very useful for outliers because one strange dot can represent a mistake, a news event, a scaling issue, or sometimes a setup worth studying more.
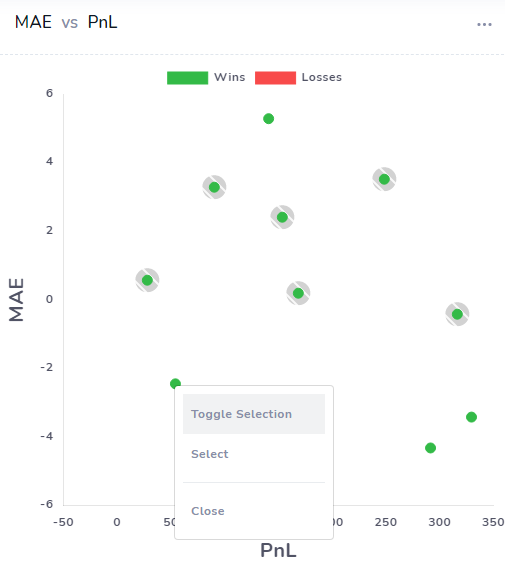
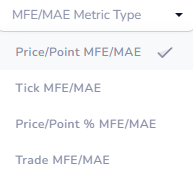
You can also change the chart measurement using the chart settings. MFE/MAE can be viewed as price/points, ticks, price/point percentage, or trade MFE/MAE, and PnL can be viewed in currency or per-trade return percentage.
Five patterns to look for
Definitions are easy. The value is in what you do next. These are the patterns we would start with.
1. Big MFE, small realized profit
You are not keeping enough of the available move. Before blindly widening targets, verify it with best exit and exit-efficiency charts. Sometimes holding longer helps. Sometimes it only adds more give-back. Let your own data decide.
2. Small MAE on trades that became winners after you exited
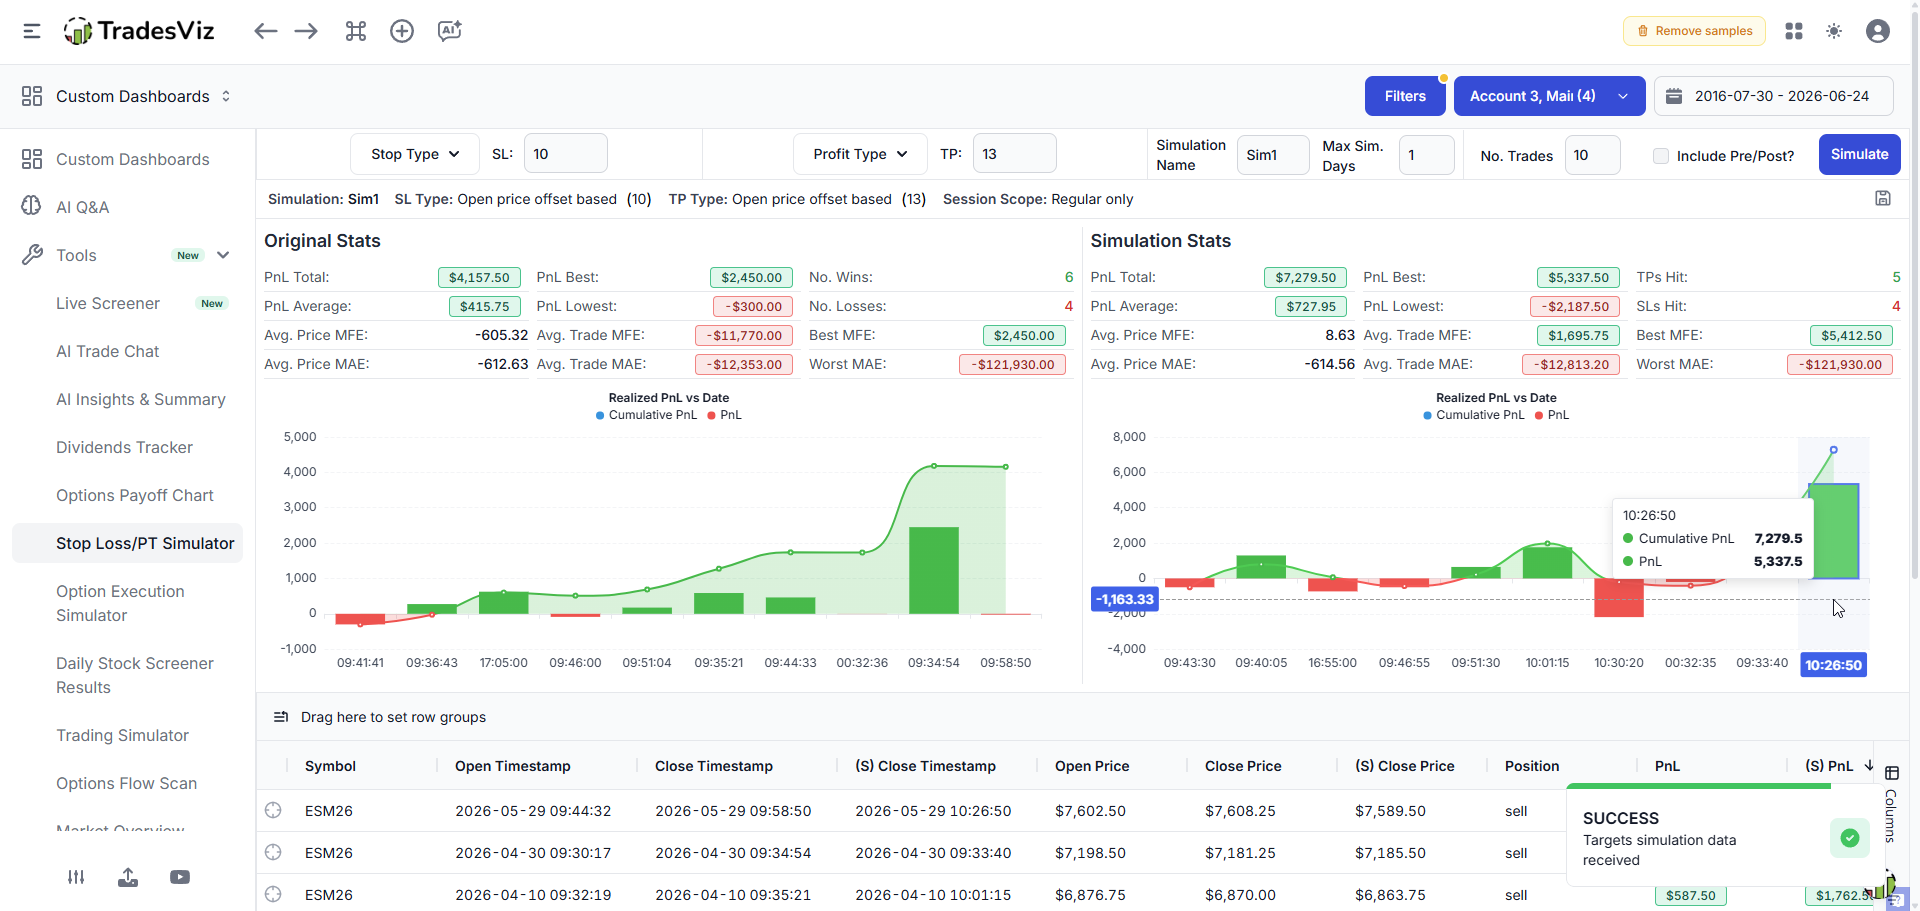
Your stop may be too tight. If many losers have MAE clustered just beyond your stop, the stop may be inside normal noise. Use the Targets Simulator to test a slightly wider stop before changing the live plan.
3. Large MAE on winning trades
These trades feel fine because they closed green, but the process may be poor. If you routinely sit through deep adverse movement to make a small profit, the eventual loss will not be a surprise. The chart warned you.
4. MFE peaks early, then fades
If individual running-PnL charts or MFE/MAE duration charts show that the best move usually happens early, your edge may have a shelf life. A time stop, trailing stop, or partial target may be worth testing.
5. Two ratios worth tracking
TradesViz gives you the raw MFE/MAE values. You can also think in ratios:
- MFE capture ratio = realized PnL / MFE. This tells you how much of the available favorable move you kept.
- Heat ratio = absolute MAE / realized PnL. This tells you how much drawdown you absorbed per dollar earned.
There is no universal good number. A scalper and a swing trader should not have the same expectation. What matters is whether your ratio improves for your strategy, your account, and your risk profile. You can create this and even more customized ratios using the TradesViz AI query and add it as a AI widget to your custom dashboard.
From insight to action
The workflow is simple, but it requires discipline:
- Find the pattern in your MFE/MAE charts.
- Create one hypothesis, such as "a wider stop would save more than it costs" or "a fixed 2R target captures more of my MFE".
- Test the change with the Targets Simulator, best exit charts, multi-timeframe exit analysis, or a filtered pivot grid.
- Apply it to future trades and measure again next month.
This is the difference between journaling and simply storing trades. The goal is not to collect screenshots. The goal is to change one thing, verify it, and repeat.
Common reasons MFE/MAE is missing or looks unexpected
- Same-day trades: MFE/MAE is not real-time. It usually appears after late EOD or early morning processing.
- Plan access: MFE/MAE charts are available on Pro and Platinum plans. Check the pricing page for the current feature list.
- Settings changed: switching theoretical/running or zero-out settings requires recalculation for existing trades.
- Scaling in/out: theoretical and running-PnL MFE/MAE can differ. This is expected.
- Positive MAE: if the trade never went below entry, the worst PnL can still be positive depending on your zero-out MFE/MAE setting.
They show the part of the trade that normal PnL hides: what happened before the exit. Start with MFE vs PnL. Find the gap. Then look at MAE vs PnL to see what you paid in drawdown for the result.
As always, TradesViz is not judging your trading and this is not trading advice. We provide the charts, stats, and visualizations so that you can judge your own process with real data. If there is one place where traders should stop relying on sayings and start relying on their own history, this is it.
Frequently Asked Questions
What is the difference between MFE and MAE?
MFE is the maximum favorable movement during a trade. MAE is the maximum adverse movement during a trade. Both are measured while the trade is open, not only at entry or exit.
What is the difference between price, theoretical, and running-PnL MFE/MAE?
Price MFE/MAE is the raw price or point movement. Theoretical trade MFE/MAE applies the full position size to that price movement. Running-PnL MFE/MAE uses the peak and trough of the actual open PnL curve, which is especially useful when scaling in or out.
Why are my MFE/MAE fields showing N/A?
Usually because the data has not been calculated yet, the plan does not include the metric, or the trade needs recalculation. Same-day trades often show N/A until late EOD or early morning processing.
Why is my MAE positive?
If price never moved against your entry, the worst PnL during the trade can still be positive. The zero-out account setting controls whether this edge case is preserved or clamped to zero. After changing that setting, recalculate the affected trades.
Which MFE/MAE metric shows the dollar amount I could have exited with?
Use Trade MFE/MAE. In running-PnL mode, Trade MFE is the maximum real open PnL during the trade and Trade MAE is the minimum real open PnL during the trade. Tick MFE/MAE and Price MFE/MAE only show raw movement, not dollars.
Why does TradesViz not multiply Tick MFE by my total quantity?
Because that is wrong for scaled trades. If you held 1 contract at the MFE point and added 10 contracts later, multiplying the MFE ticks by 11 contracts reports money you never actually had. Running-PnL Trade MFE/MAE uses the quantity actually held at each point in time.
What are the MFE/MAE charts in TradesViz?
The main charts are MFE vs PnL, MAE vs PnL, MFE vs Volume, MAE vs Volume, MFE vs Open time, MAE vs Open time, MFE vs Close time, and MAE vs Close time. TradesViz also has duration-focused MFE/MAE charts covered in the MFE/MAE duration guide.
Can I click into individual trades from the charts?
Yes. MFE/MAE charts are explorable. Click a data point to open the exact trade behind it and review the symbol, metric values, chart, executions, notes, and other context.
How does scaling in and out affect MFE/MAE?
Scaling can make theoretical and running-PnL MFE/MAE differ. Theoretical applies full position size to the price extreme. Running-PnL uses the position size you actually had at each point in time.
How can MFE/MAE help with stop-loss placement?
Study the MAE of losing trades and winning trades separately. If losers cluster just past your stop and later work, the stop may be too tight. If winners routinely show deep MAE, you may be accepting too much risk. Test changes with the Targets Simulator before applying them live.