We hope our plethora of statistics and explorable charts have been helping you make data-driven decisions in your trading!
With this new update, we have focused on distribution curves. This has been long overdue, but we finally implemented it due to a recent increase in users requesting this.
First, where is it found in your dashboard? It's right under the "Performance metrics charts" section on the left side of your dashboard.
In this tab, you will find a total of 4 charts. 3 of them are similar and simple to understand and the fourth one requires some extra explanation.
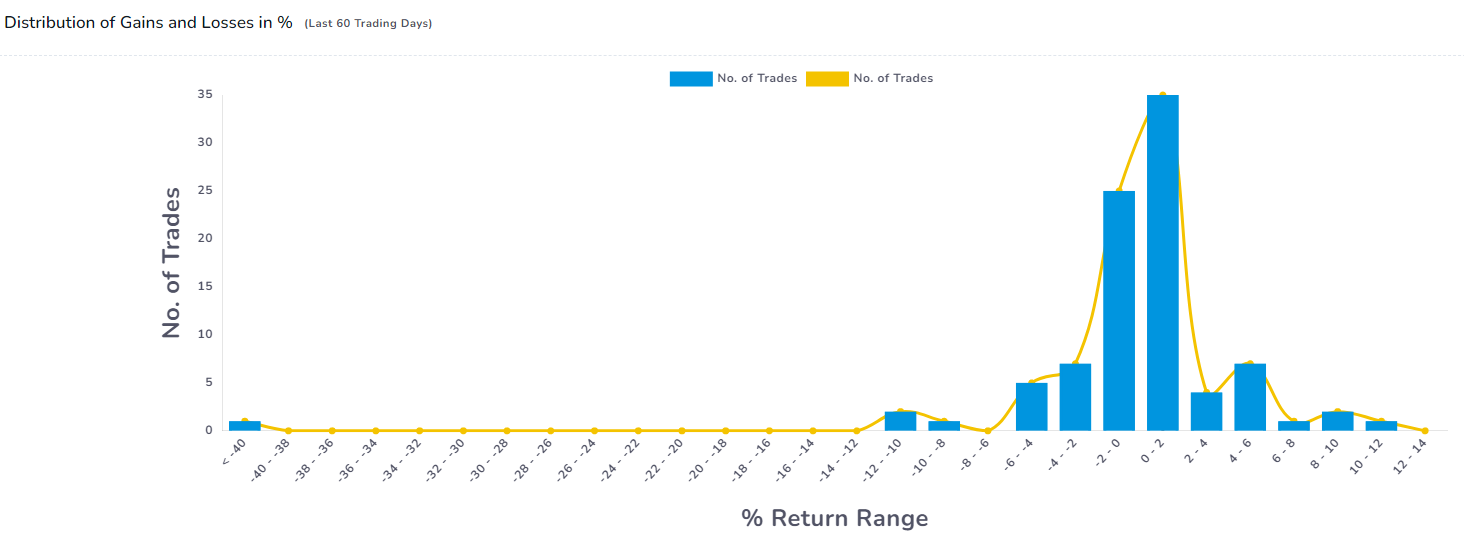
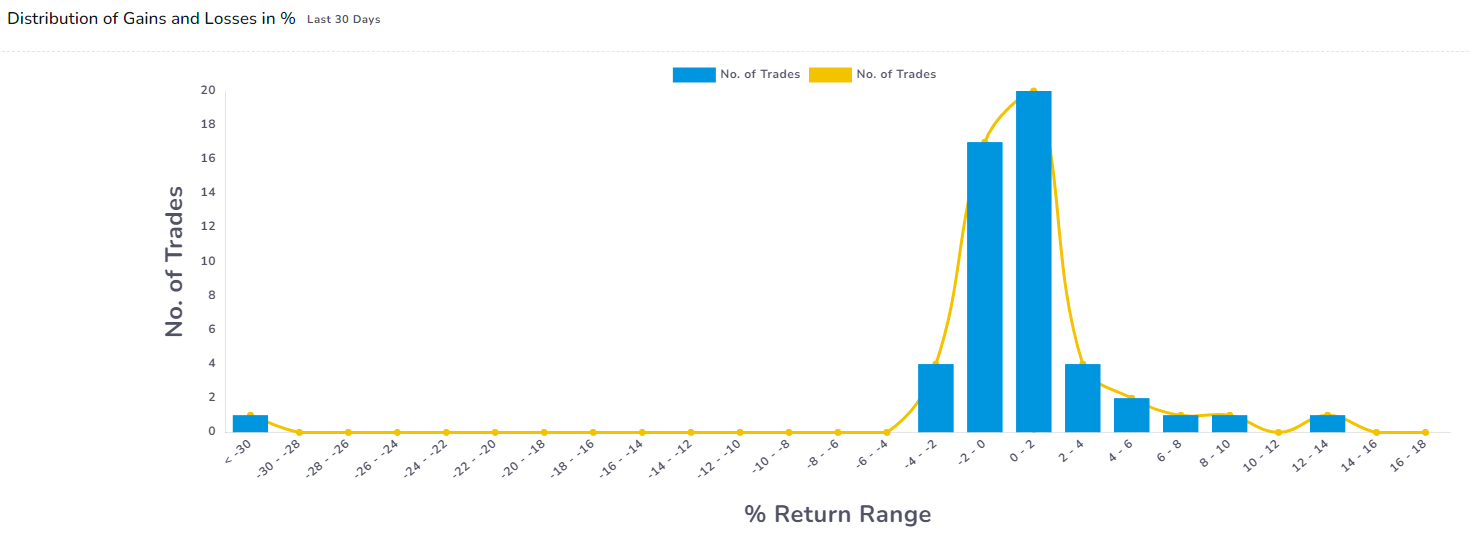
The first chart you will see is the Distribution of gains and losses with respect to return %. That is, on the x-axis (horizontal axis) you will find various return ranges and on the y-axis (vertical axis) you will find the no. of trades you made that correspond to a particular return range.
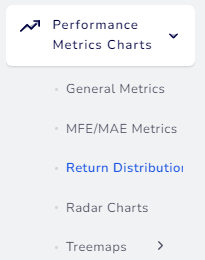
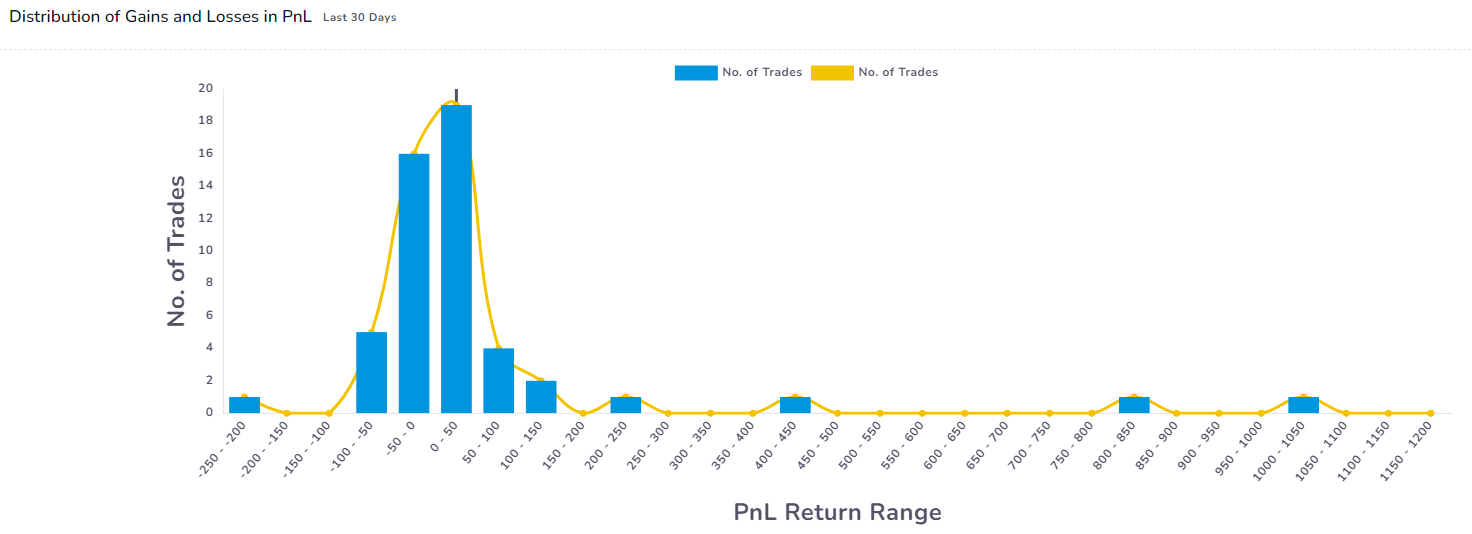
Similarly, you will find that the other two charts are pretty much the same - except that they are plotted against the pnl range and R-value range.
Here's an example of a PnL range distribution chart:
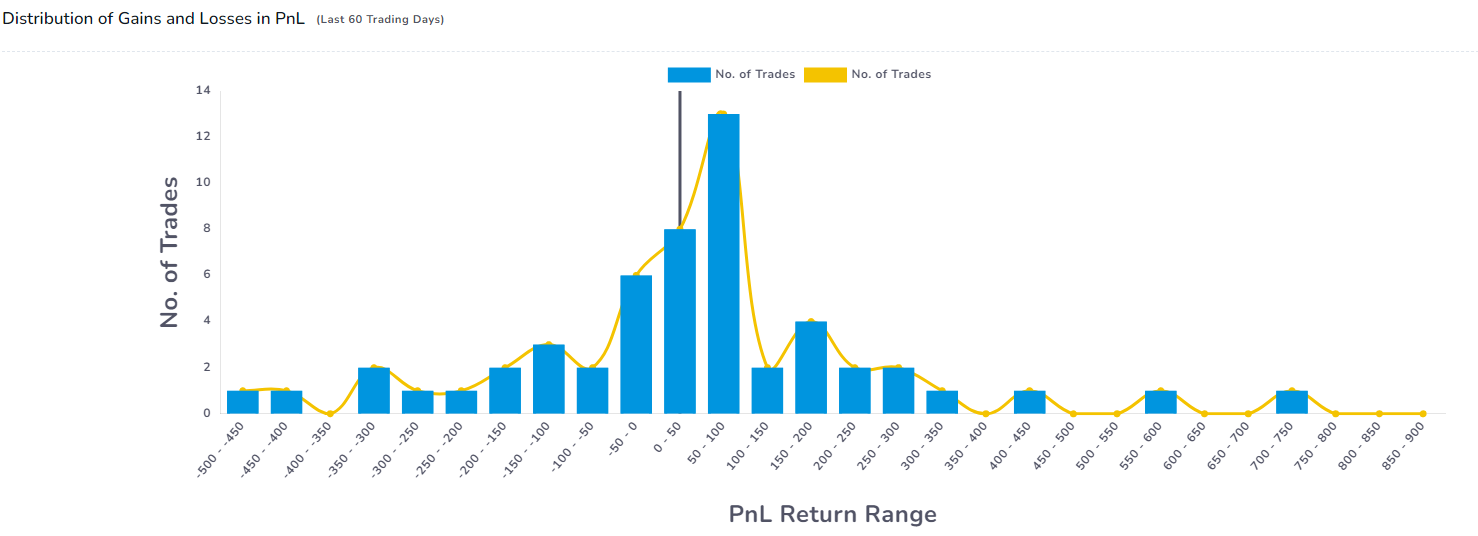
What is the significance of this chart? You will first need to learn about uniform distribution. Ok, now why is this important? A uniform/normal distribution curve is used to model any continuous data in nature and tells us about the underlying properties of the data we are trying to measure.
(Image source: simplypsychology.org)
Some of these concepts are explained really well on https://www.simplypsychology.org/ and we highly recommend you to look into this if you are trying to use your journal also for psychology assessment/analysis.
Now, based on the graph example above (pnl distribution), you may find that the bars are a bit distracting - you can simply click on the legend icon to remove the bars and find a clear picture of the curve.
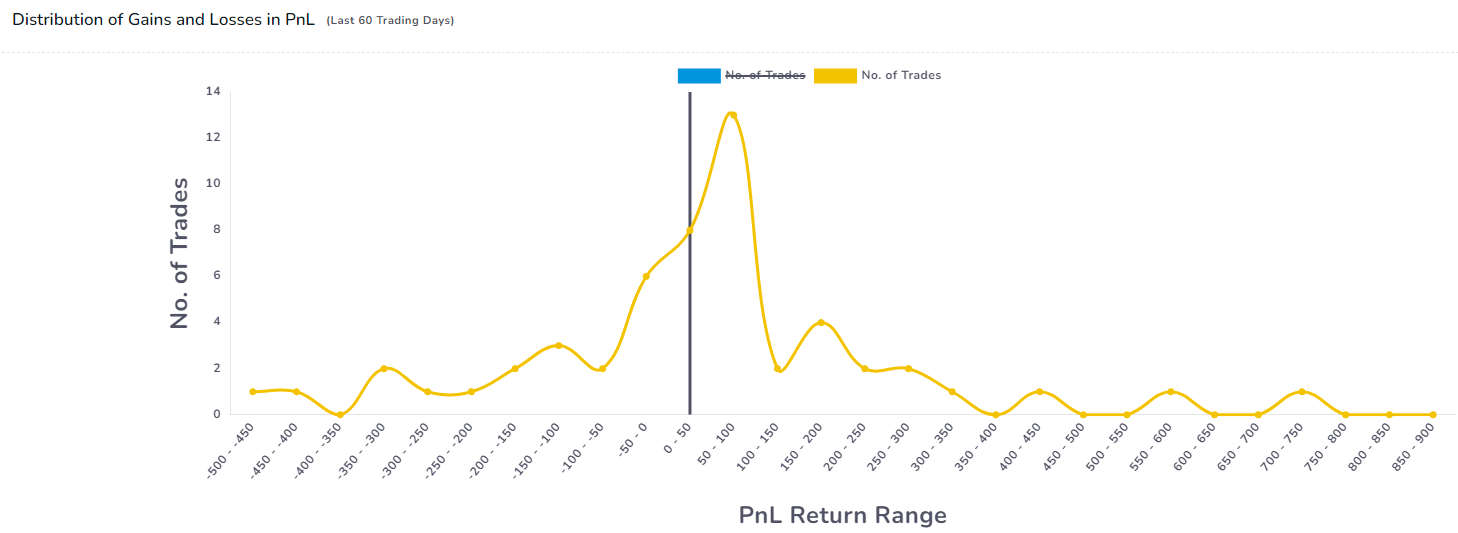
Alright! We can finally start to see some insights from this! What is the first thing you see? It's that the curve's peak is shifted to the right - that is good! Why? because the underlying data that we are measuring against is PnL and positive pnl is on the right side.
Without going too much into tails and the properties of the tails of the distribution, we can say that from this simple graph, this trader seems to be earning more than he's losing - so overall, he's a profitable trader. But, notice that the curve is not exactly uniform on both sides. It covers slightly more area on the left side (negative pnl). From this, we can infer that most of the profit seems to losses seem to come not from large drawdowns, but lots of smaller-sized losses within two standard deviations. You can learn more about the skewness of the graph and its properties in this Investopedia article.
What if your curve does not look like this? You might not see a nice curve like this if you have very few trades. The biggest quest here for you is to make sure your curve is always skewed toward the right side.
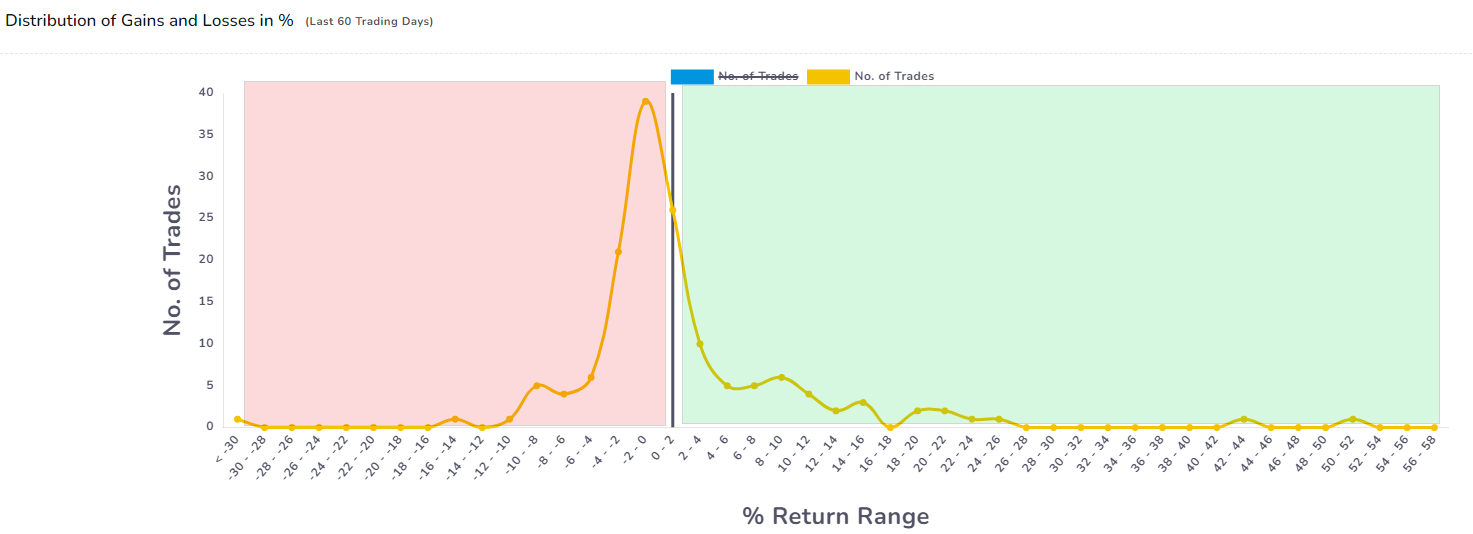
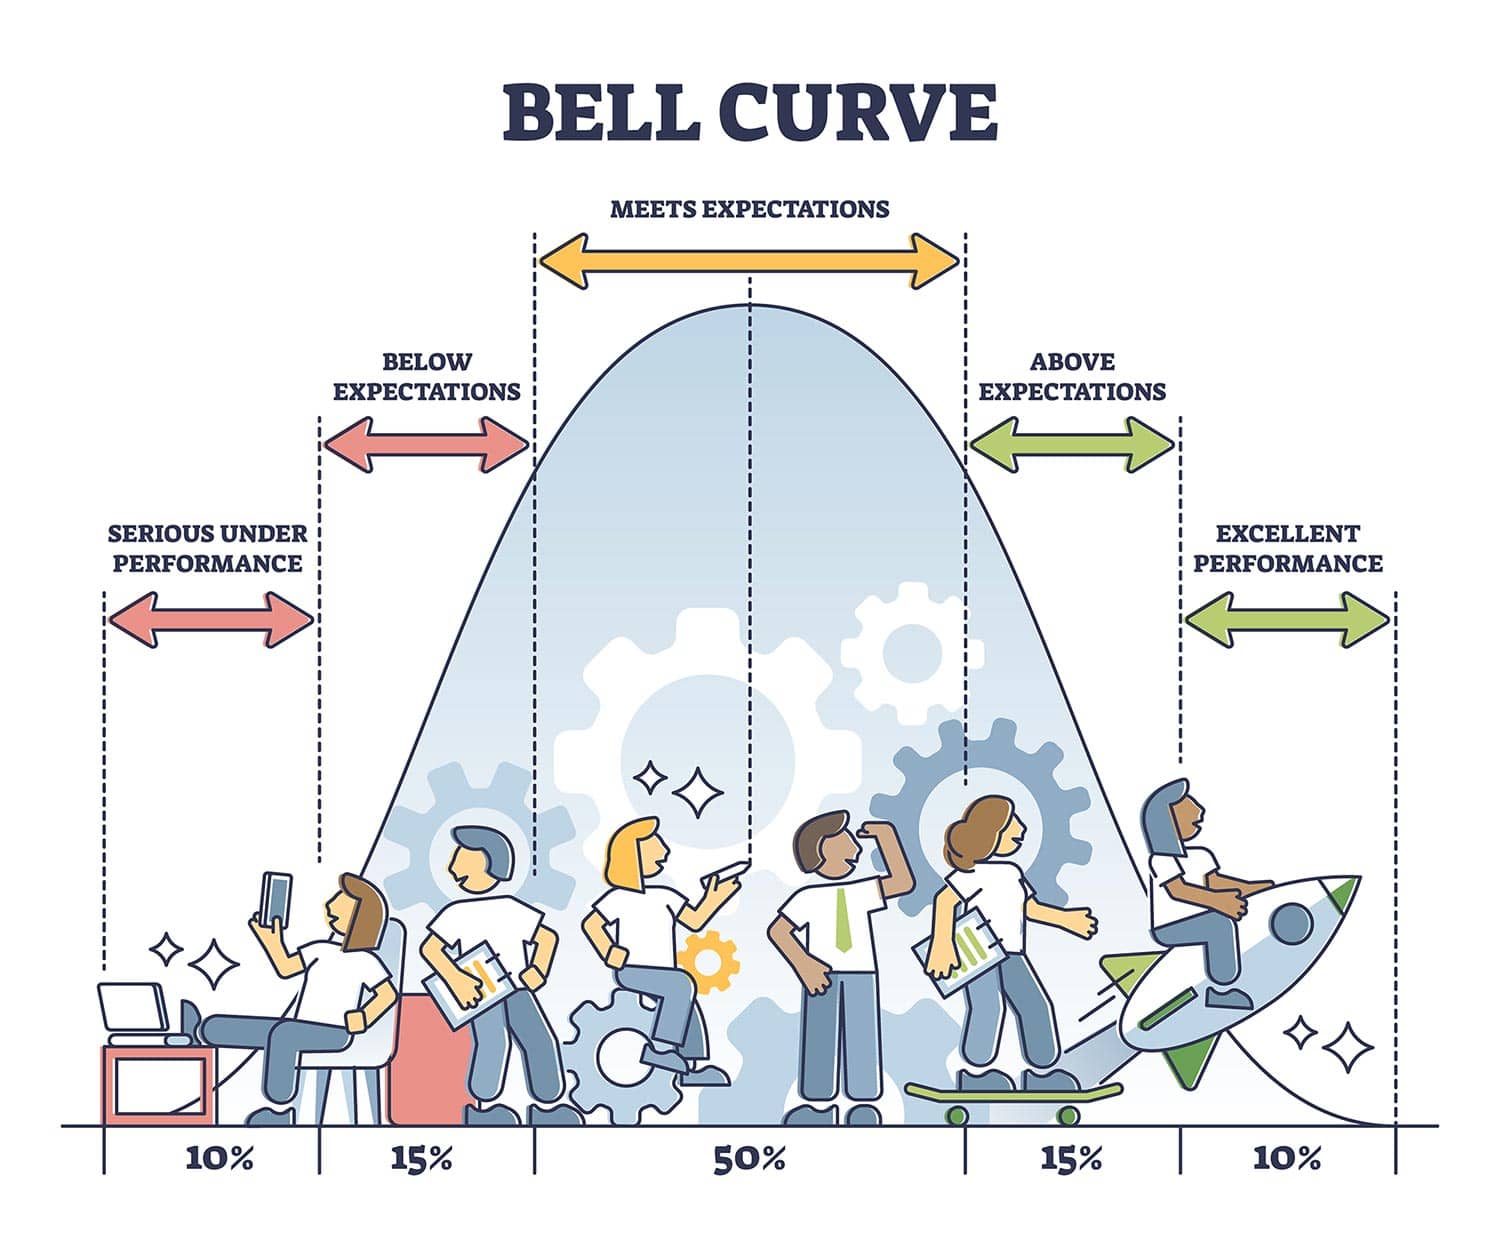
This is an example of a net losing trader. Why? because the curve is clearly skewed into the negative return % range. You want to be ideally in the green zone (>0) as much as possible.
There is also another use of this curve - it is finding outliers using the tails of the curve. But for that, you will need to use 2 graphs together: the PnL and the return % distribution graphs. Given below is an example where just looking at one chart can lead to misleading conclusions or not very useful insights:
Both of the above graphs are from the same trading account for the exact same filters (you can click on the images to zoom them). Even though your graph might look good in one chart, outliers in the other can lead to disastrous results in the long run. Always be careful of them and try to never make such large mistakes! Another lesson is that of risk management. All it takes is a few trades to blow up your account.
That's it for distributions analysis on TradesViz! The only trading journal that provides actionable statistics and also teaches you how to use it! If you have any questions or suggestions, please send us an email: [email protected]!