TradesViz is the first journal to introduce a well-tested, fully-functional AI-powered question-and-answer-based system with privacy in mind. We have explained in-depth how the system works in one of our previous blog posts which we highly suggest reading before reading this blog post.
Since the launch of AI query, we have seen users generate 1000s of unique queries each of which are very custom and specific to their own accounts. The magic of this system is that just like asking your trading mentor questions about your trading, you can ask TradesViz's AI system questions about your trading data and get visualizations and stats.
We have also explored some advanced queries where you combine multiple results, get data from other sources (like EOD data), and create formulas in our advanced query guide.
Based on feedback we have received, some traders have discovered trading insights from asking questions and adjusting queries that led them to find their trading edge in a process-based method. This is crucial because when you are trading, there could be 100 different factors affecting your win-rate, PnL, consistency, etc., If you could start with a simple question like "What's the best time range to trade?" and then expand from that, you will see a path in front of you that you can easily navigate.
Unlike other journals that are superficial and only show simple Pnl charts, we go above and beyond when it comes to showing truly important and actionable insights squeezed from your trading data points. The AI Q&A gives you exponentially higher flexibility and freedom on how you want the insights to be delivered to you.
In this post, we will keep things simple. We too, have learned a lot of new queries and tricks to make the best out of the system and rust us, and we're constantly surprised by how well the AI Q&A performs and just how useful and efficient it is. We want to share all of the interesting queries we've learned and discovered in this blog post.
You can directly copy and paste most of these queries directly into the AI Q&A. Some of them may need you to change the account name.
Interesting Queries and Prompts
1. Querying symbol OHLC data
Did you know that you can combine both your trading data and underlying symbol or even just query the underlying alone?
This query follows the "Multi-step queries" technique that is shown in the advanced AI query guide.
Query:
show close prices of AAPL.US from 2021 to 2022 from eod data
combine both data on date
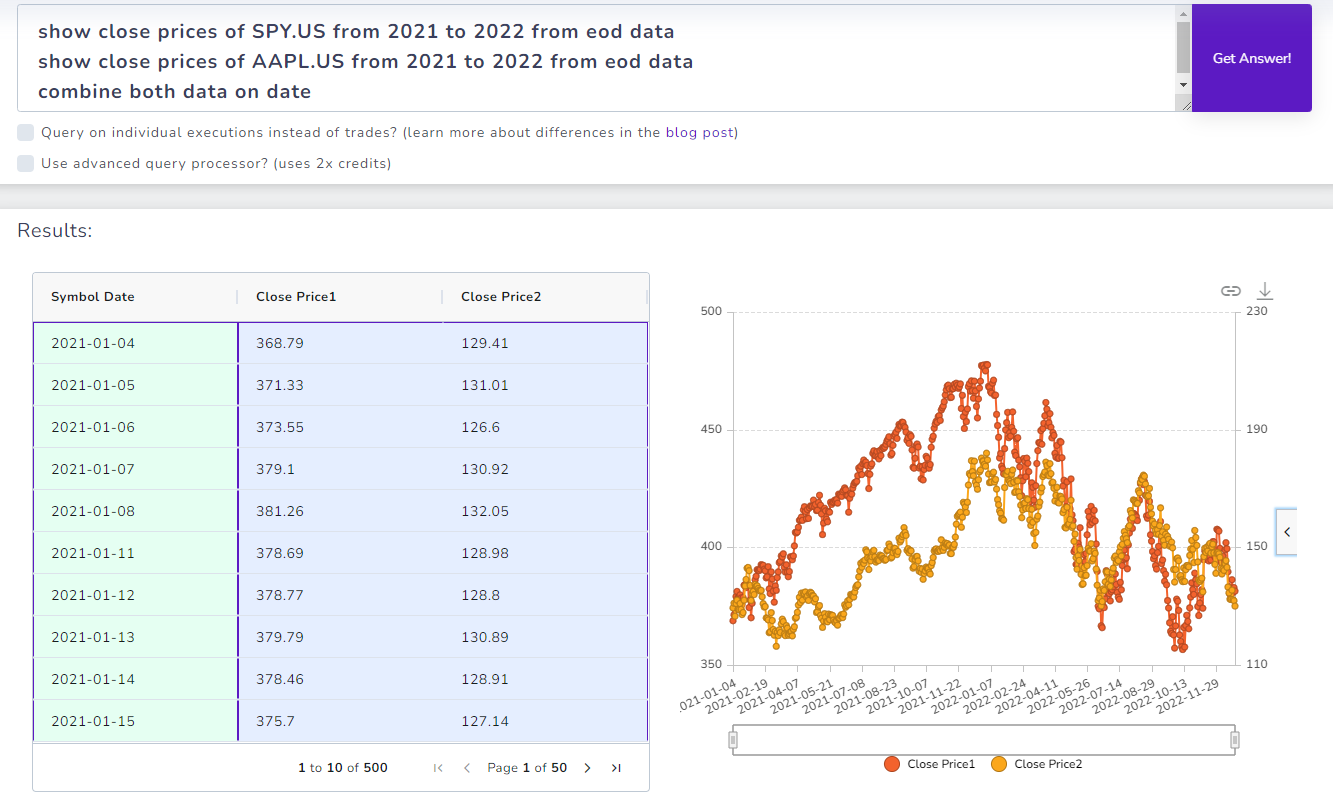
Note that sometimes, you can improve the presentation of the chart by adjusting the chart settings. Click on the small drawer icon on the left side of the chart and change the visualization settings here. For example, for this chart, we have used "Combination type" and selected the ClosePrice2 column as the secondary data in the data section.
2. On what days did you start red/lower and ended in green/higher?
Query:
filter only dates where the first pnl is lesser than total cumulative pnl
Note: This query uses the execution type mode as we need individual execution data.
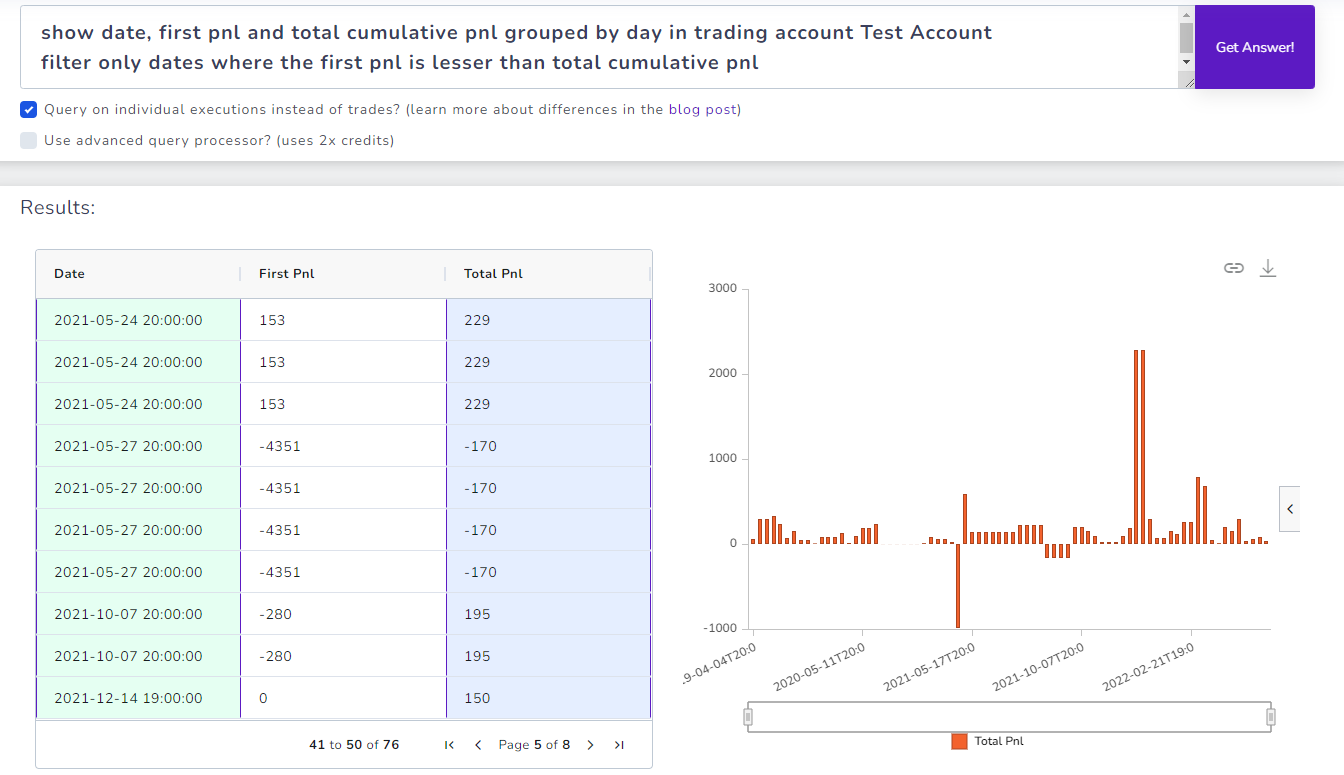
How cool is that! :D
It's impossible to get a graph or a stat like this with conventional tables unless you are willing to download it, write scripts in excel or some data management program.
3. Easy filtering on symbols and tags
Query:
where symbol is AAPL or PACB and tag is CHOP
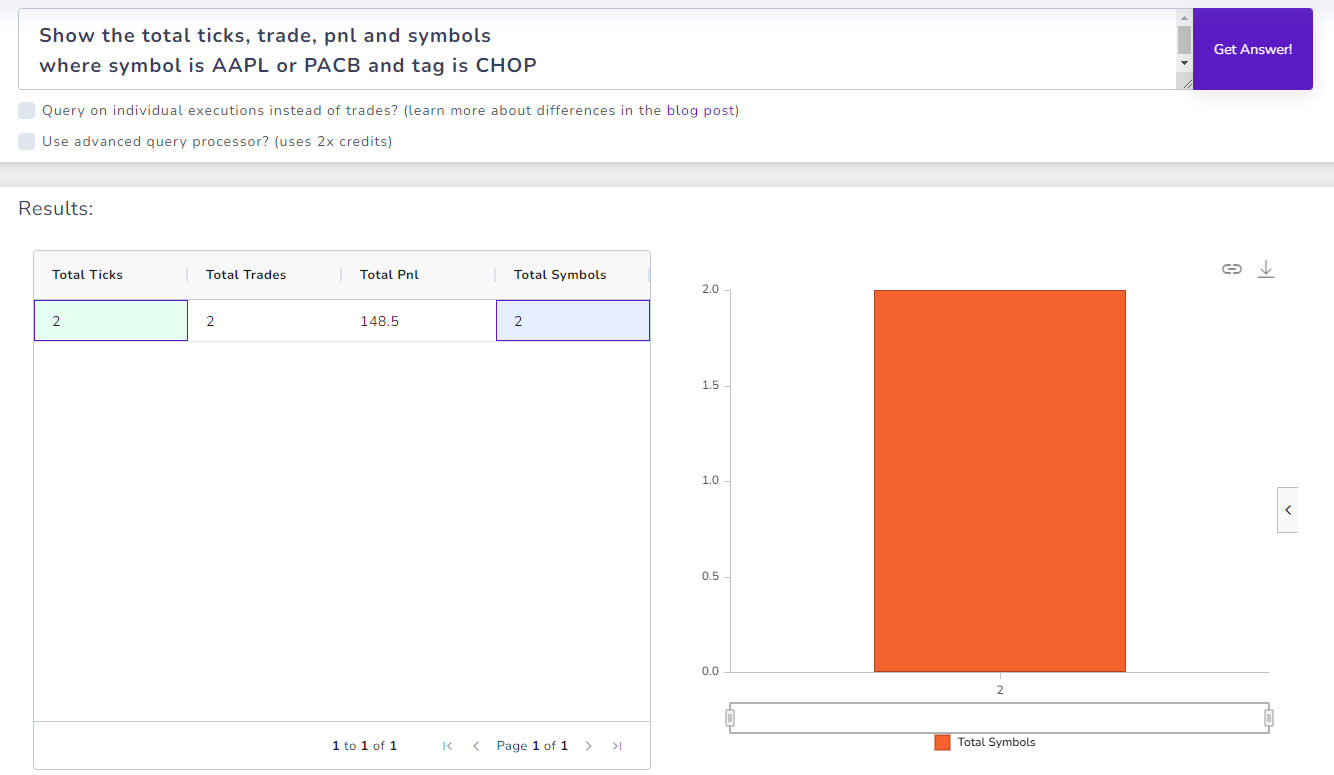
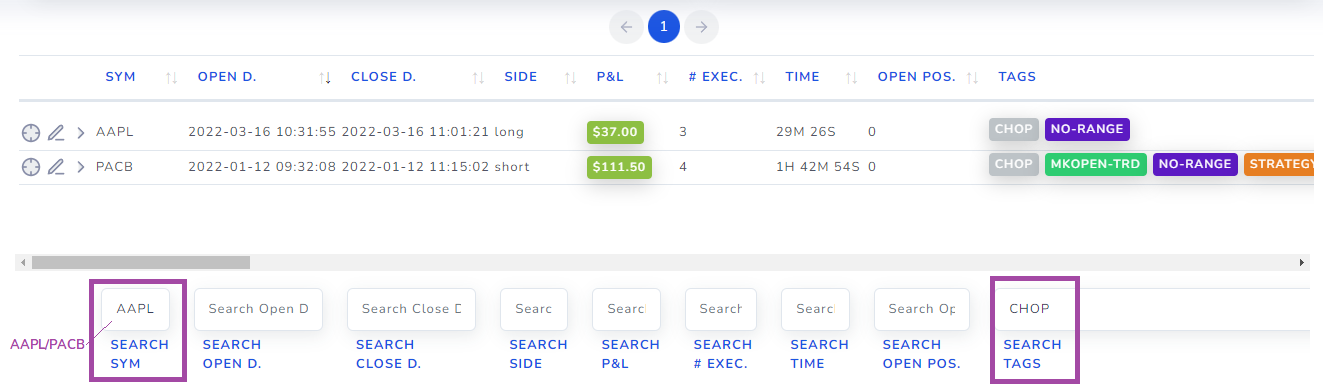
Sometimes, you may find it difficult to use the trades table to do some complex filtering that involves multiple conditions. While we have a dedicated guide for advanced filtering on the trades table, it is more efficient to do it by just asking the AI Q&A system.
Here are the trades table filter conditions for the same query:
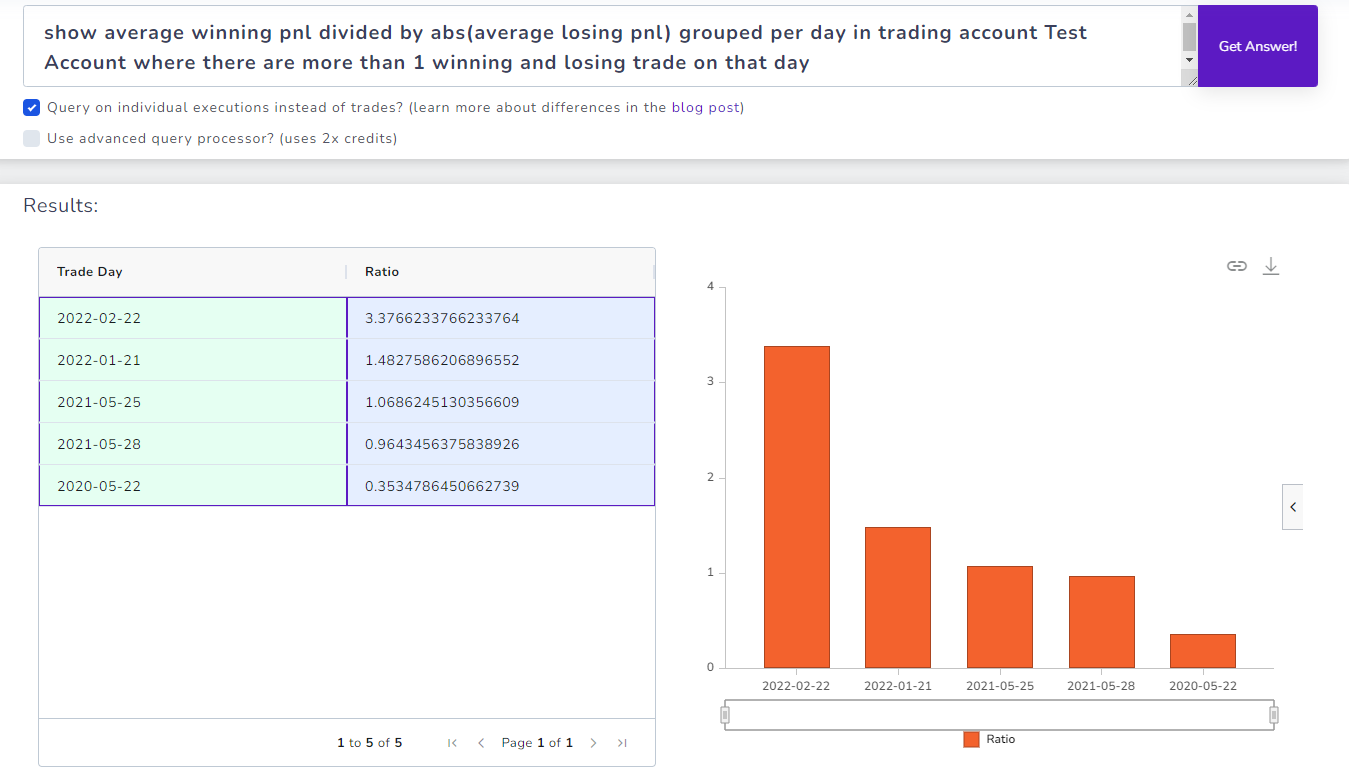
4. Per-day custom metrics calculation
Have you wanted to look at the profit factor or some unique metric *per* trading day? Here's the problem: All the stats you see on TradesViz or any other journal are per *trade* and not *per* execution. Ok, now you ask what's a trade and execution? Here's our standard definition:
Difference between **executions** and **trades** in TradesViz:
Execution: An execution is an atomic unit of a transaction. Example: "Buy 100 shares of AAPL". An execution by itself can only have price, quantity, time etc., and not PnL.
Trade: A trade is a group of one of more executions. In TradesViz, any execution will always have a trade that it belongs to. Example: Buy 100 shares of AAPL, Sell 100 shares of AAPL. A trade will have a lot more attributes such as PnL, MFE/MAE, duration, etc.,
When importing files, you are generally importing orders or individual executions from the broker. In the end, after grouping the executions into trades, you will have a lesser no. of entries - i.e lesser no. of trades than executions because multiple executions will be grouped into 1 trade. This is normal and expected.
In TradesViz you have the ability to view your executions via the Executions table or trades via the Trades table.
Now you will easily realize WHY we have the "execution" mode in the AI query - it's to increase your freedom of analytics not only to trades but also to realize individual executions. This is very important for traders that swing trade and close positions for example, over many days.
Now here's a query that calculates profit factor PER day using the executions mode.
Query:
5. Viewing MAX realized drawdowns per day
OK, this is a complex one. You can view pnl, vol, count, etc., per day, and maybe even some execution trends using the new trend analytics chart. But this is completely different. For every trading day, everyone is going to have ups and downs. That's the realized PnL graph you see at the bottom of the day explore page like this:
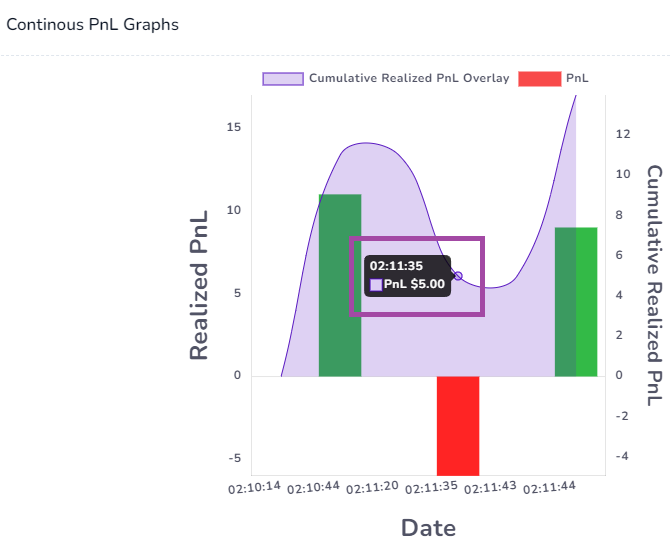
Here's the question: How can we visualize the values at the troughs (max low realized) per day for all days?
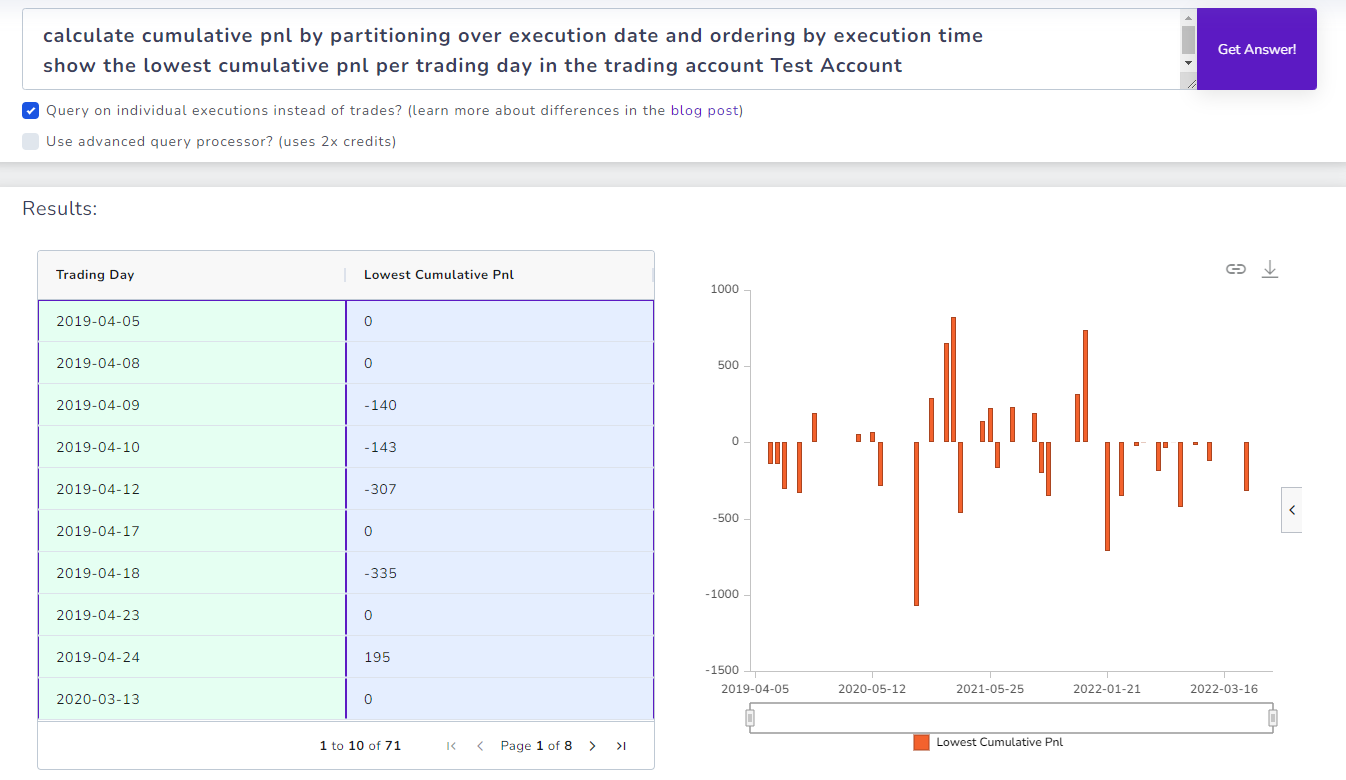
It's impossible to do this via normal tables and charts. Solution? An advanced AI query:
Query:
show the lowest cumulative pnl per trading day in the trading account Test Account
6. Combining multiple conditions that cannot be filtered via table
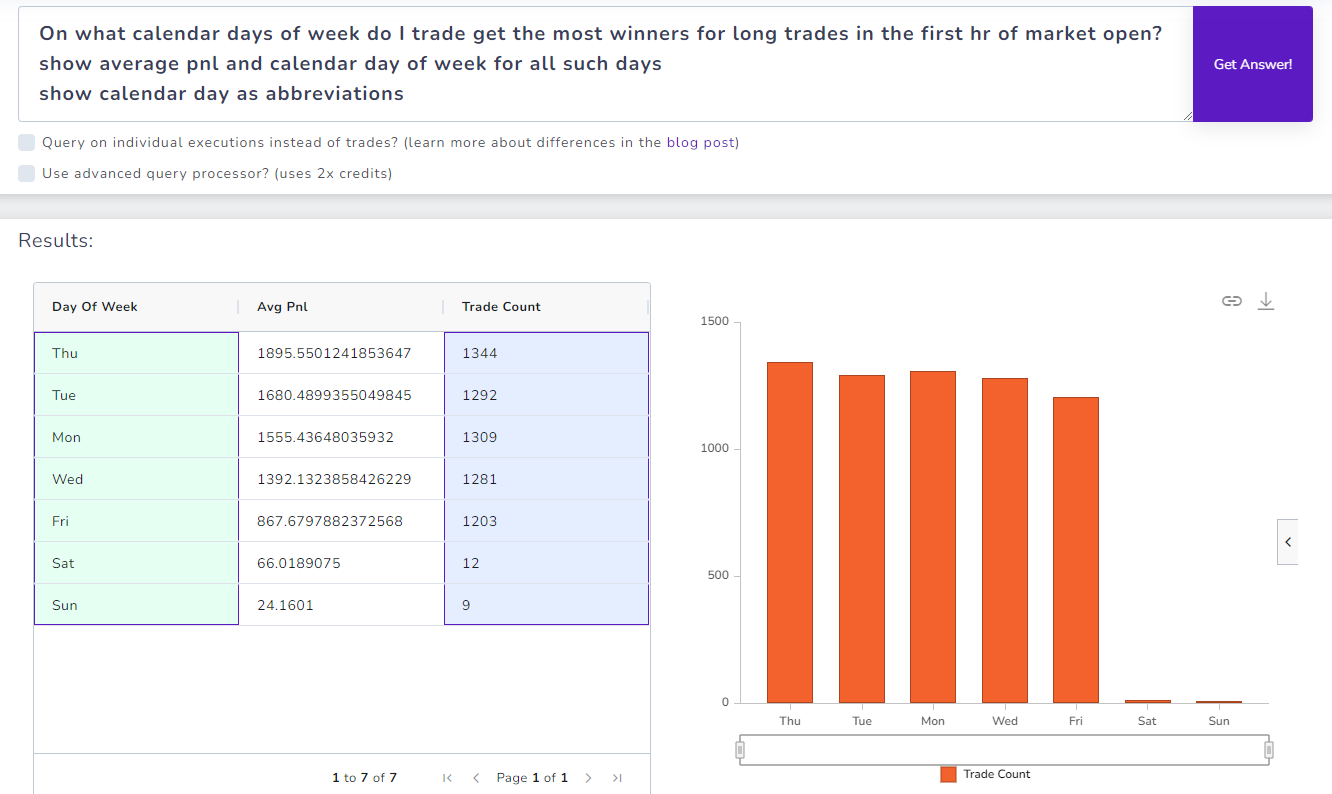
Here's the question: On what days do we get the most winners by going long in the first hour of the market opening?
Phew... That's a lot of conditions.
Oh and... we want the average pnl of all these winners
If you were given an Excel sheet with all your trades, how long would it take for you to find the answer to this?... Or.. heck, even use any other journaling tool. Few hrs? at least 30 mins?
It's 30 secs in TradesViz.
Query:
show average pnl and calendar day of week for all such days
show calendar day as abbreviations
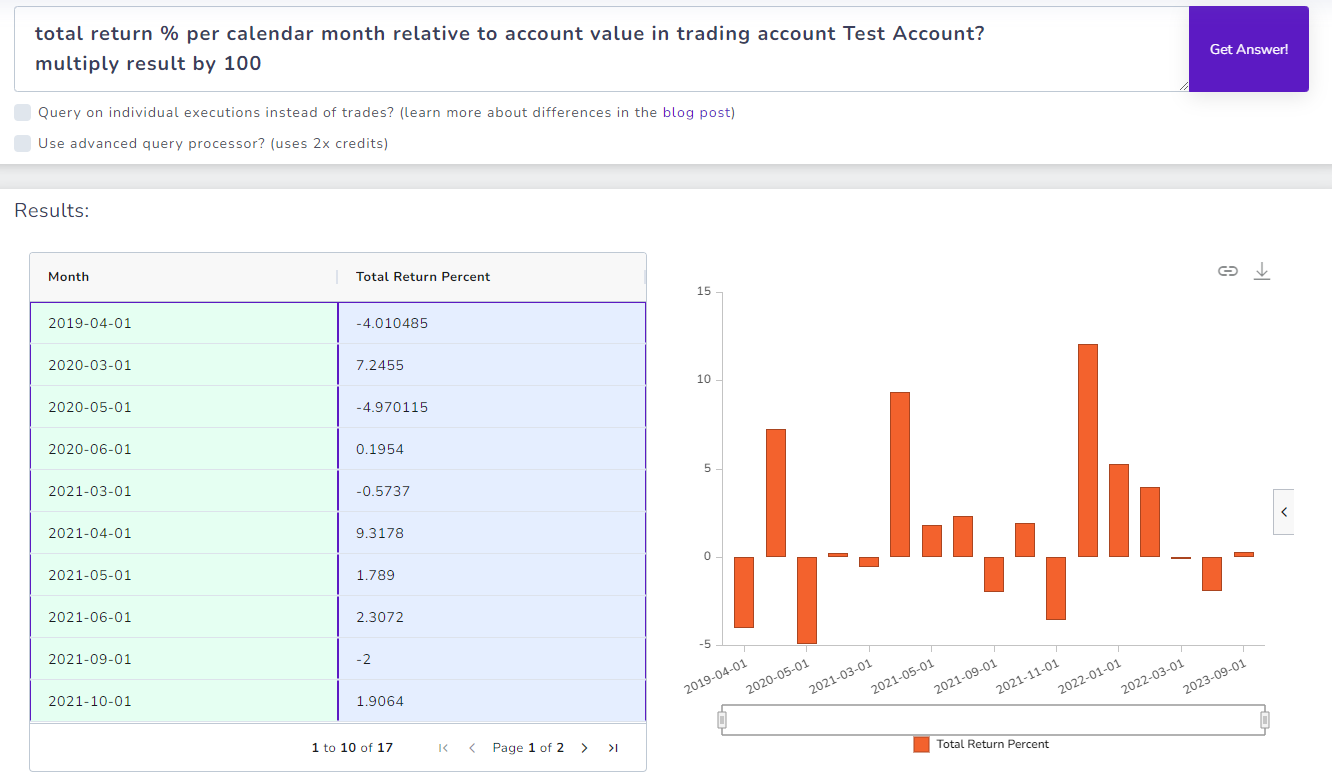
7. Get calendar per month return %
Query:
multiply result by 100
8. Show multiple stats over a day
Query:
show hour of day in US/Eastern timezone
profit factor is winning pnl divided by losing pnl
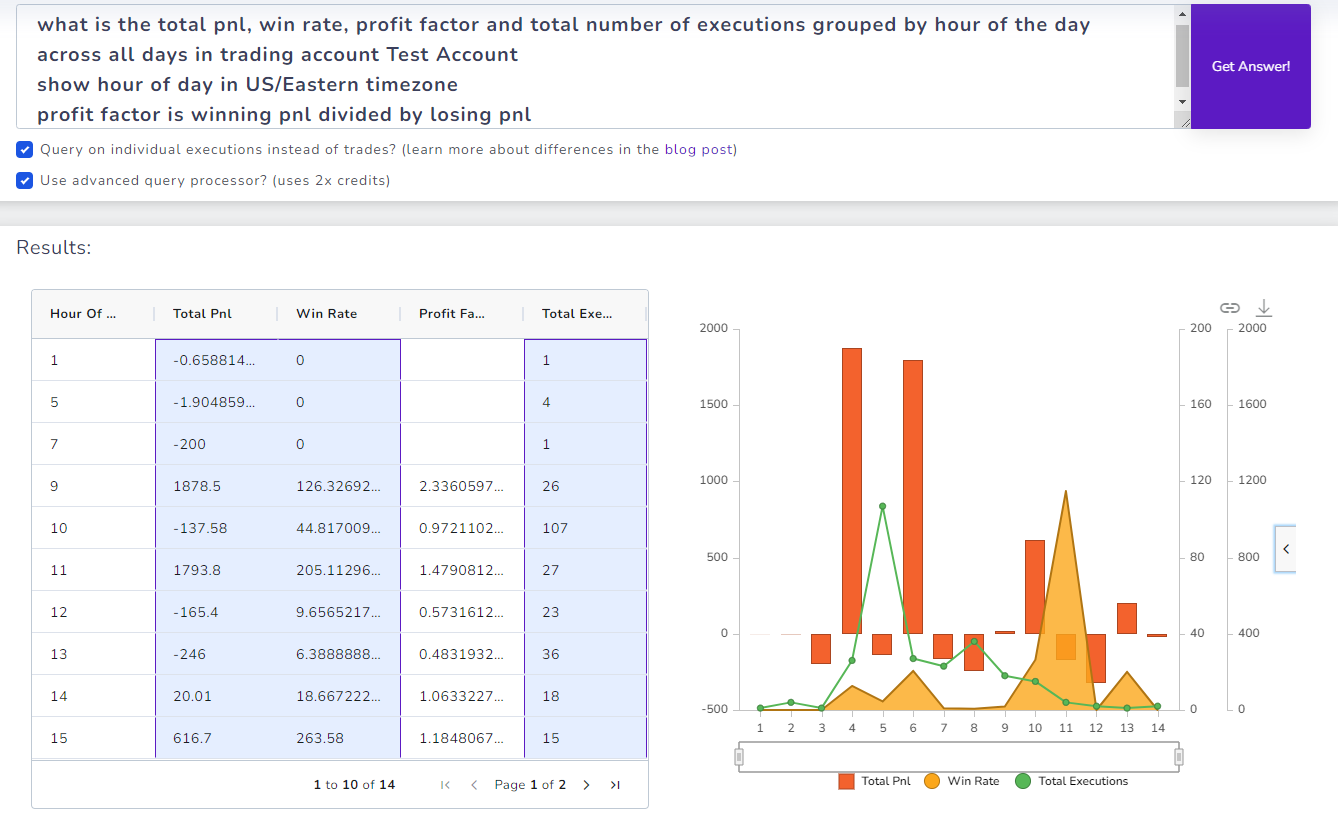
We use the advanced query processor option to make sure we get clearer results without much need for tweaking the query. This is a use case where we are asking it to show a lot of data and calculations. We also specifically tell the system how the profit factor is calculated here - this format can be used as a substitute for any type fo custom calculation you want to run.
Note that we are using the multi-chart type here to visualize all the data at the same time.
We hope this guide in addition to our introduction to AI Query and the Advanced AI Query practices gives you an in-depth guide to how to use the most cutting-edge tech. in trade journaling: AI-powered insight and visualization generation for your trades. As an industry-first feature, we are proud to be at the forefront of the trade journaling revolution. Without the constant feedback and support of our users, none of this would be possible.
We are very excited about the future of AI-powered trading journaling and automation to make every trader's analysis truly actionable. Our goal is to make sure every trade has access to the best possible tools whilst being pocket-friendly and keeping value provided as our number one priority.