In our original blog post about the introduction to AI query in TradesViz, we explored basic queries which show charts that you can use to get summaries of your trading. But what if your needs are complex?
Suggested to watch before reading:
We are seeing more recent users preferring to interface with the AI query tab because it's easy and flexible to get answers to almost any type of question you have about your trading.
If you have used ChatGPT, Bard, or similar chat-based AI tools, this guide will feel like an extension of what you already know i.e. prompting. For everyone who does not have experience with such systems - don't worry, just think of the system as a very simple computer that shows results exactly as you ask it. Note the keyword "exact". We say this because there will not be a complete or 100% guide that covers every possibility of this feature as you see in our other blog posts. Why? Because the possibilities are endless. The insights you can get and the questions you can ask have no bounds or restrictions.
Let's explore some different types of queries below. These will be VERY useful in a feature that is coming soon - Infinite AI possibilities + Custom dashboard = ? ... Stay tuned!
To take full advantage of the AI system, you need to understand how to effectively query the system. Below are 5 unique examples each exploring a different type of query.
1. Grouping data example: Finding pnl grouped by calendar days
Yes, this already exists as a chart in the trades analysis charts. But this serves as an excellent example of how to group the data by particular criteria - in this case, by days of the week. Once you learn how grouping works, you can use it to create almost all of the charts you see in the pnl analytics section.
Query:
show day of week, date and pnl
A simple query. Finding the pnl grouped by calendar day. So, the output should show 7 bars (MON-SUN), right?
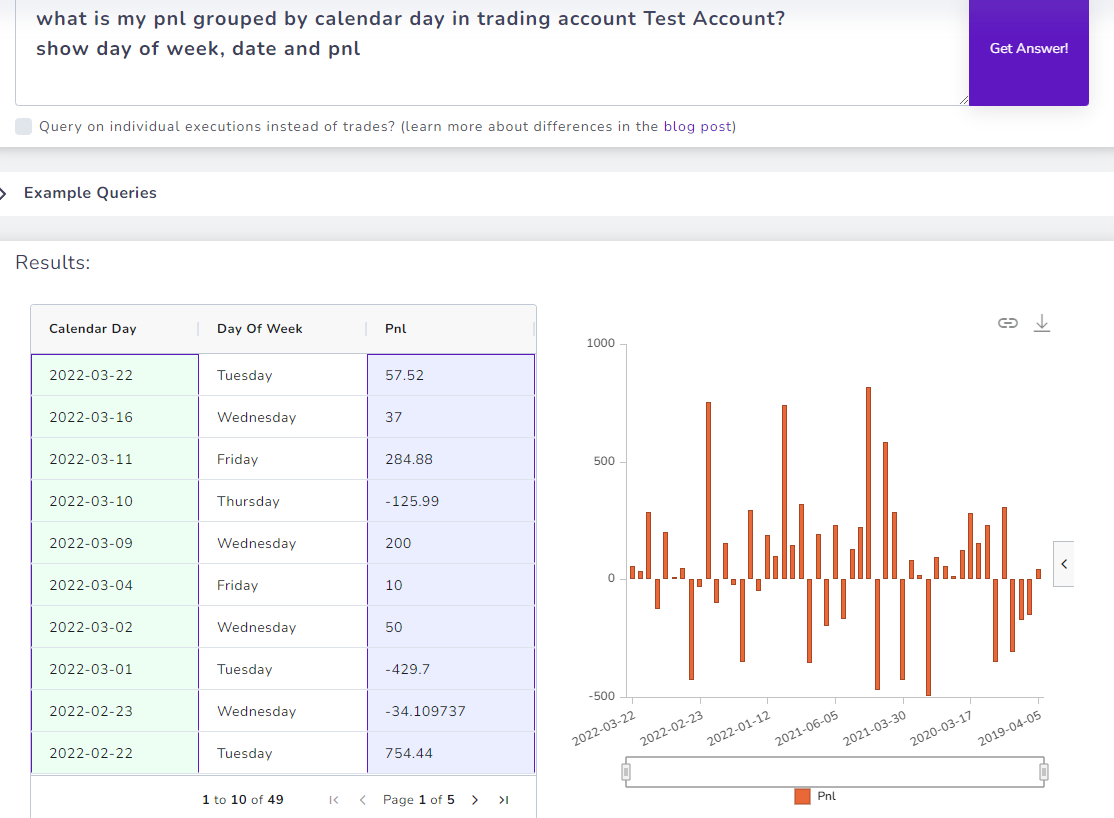
It does not...
Instead, what are we seeing here?...
We are seeing the pnl grouped by *every* single week and the day of the week is just the grouped week's first day.
This is not what we wanted. How can we fix this?
We need to adjust the first line of the query:
Let's try this:
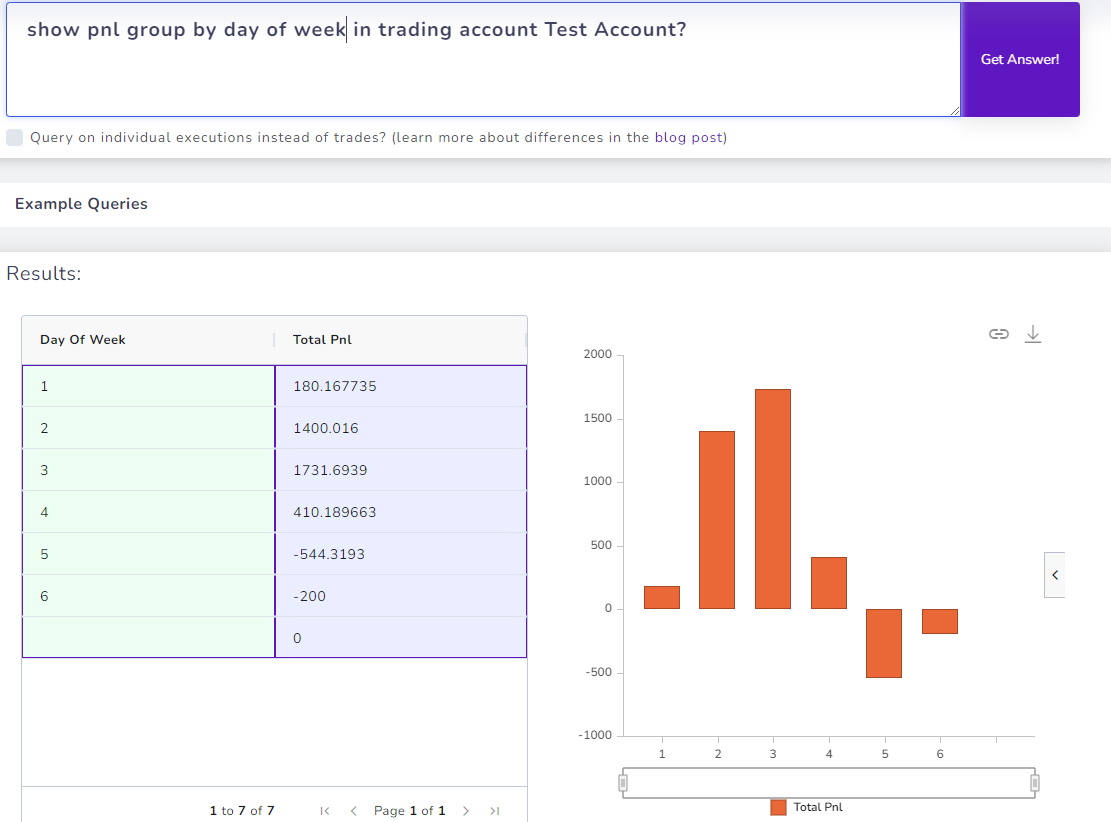
There we go! We got what we wanted!
The purpose of this mini-experiment is to make you understand that even a slight change in how you describe the data matters a lot. Now since the query shows only numbers, we can now add the second line to show the actual calendar day.
show day of week as 3 letter ISO name
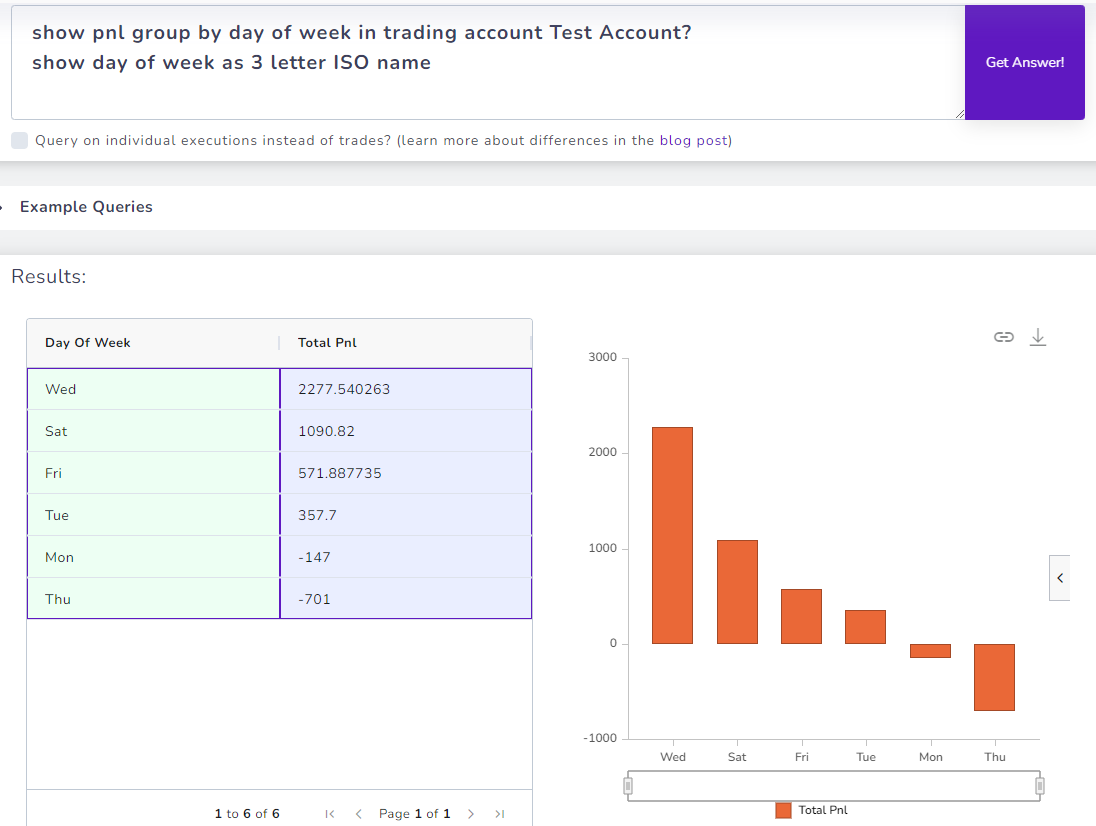
This is the final end result!
2. Multi-step queries: Step-by-step complex query construction using multiple data points
Sometimes, it might not be possible to get a result if you write everything in a single line - it's hard for the AI system to comprehend this.
A workaround is to break the complex query into parts. Here are some examples:
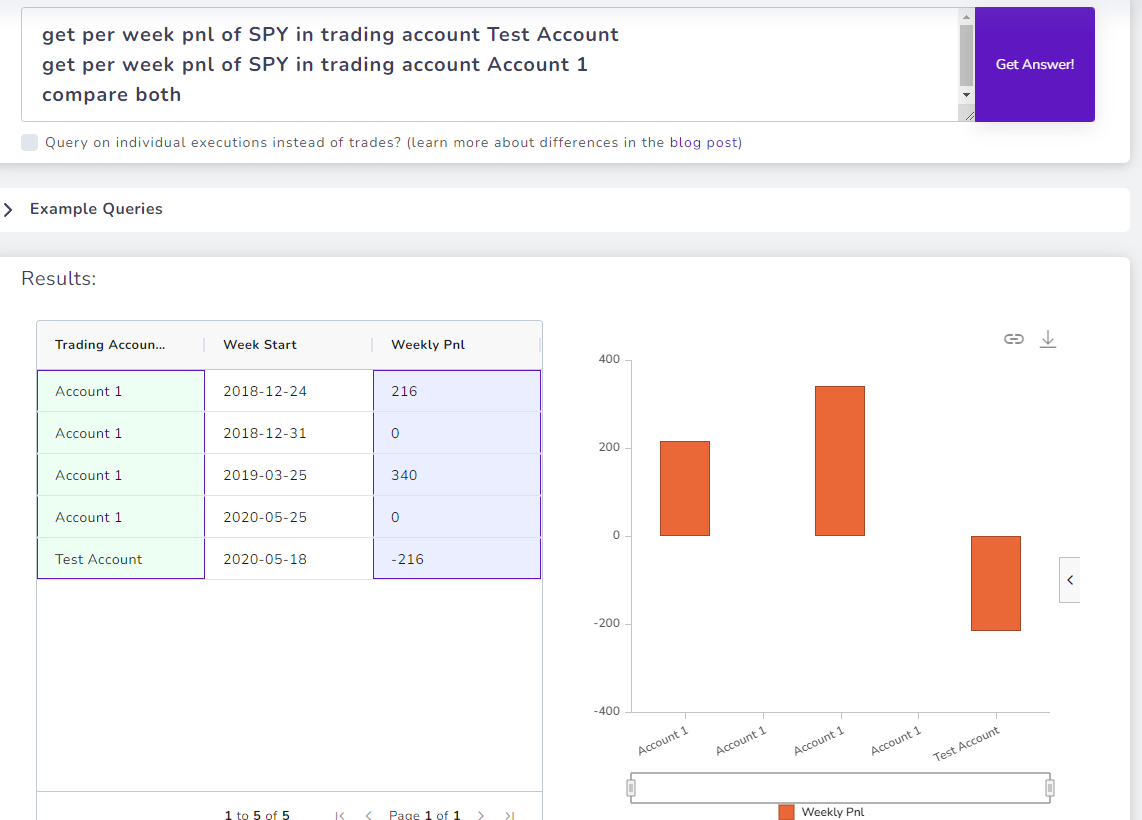
Query 1:
get per week pnl of SPY in trading account Account 1
compare both
Here we are comparing the pnl of a symbol from different accounts. Note that this is just an example - your use case might be very different and you may trade very differently. However, the concepts we explore here apply to all types of trading data in your trading journal.
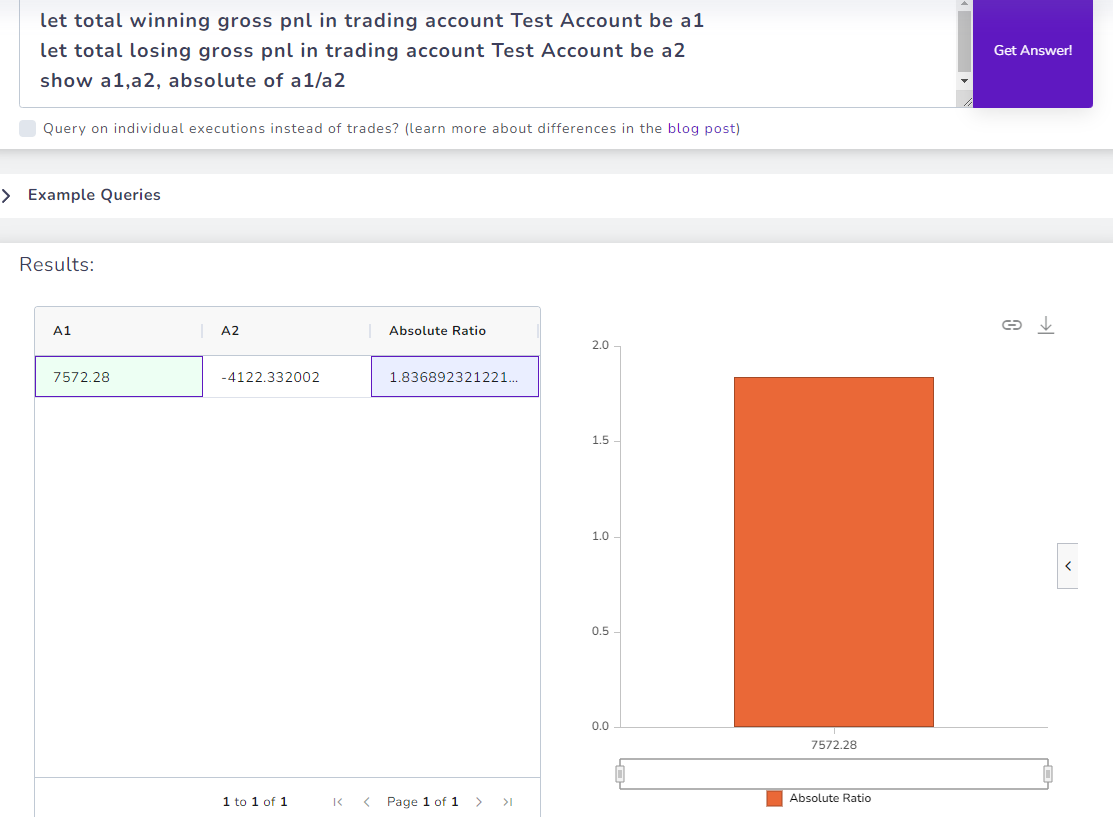
Query 2:
let total losing gross pnl in trading account Test Account be a2
show a1,a2, absolute of a1/a2
Finally, you can create your own custom formulas. Again, in this example, we're using the AI query to create the profit factor of the account. Recall that the profit factor formula is defined as the gross profit divided by the gross loss (source).
Imagine the possibilities of the analytics you can achieve with this type of queries!
If excel was your first thought, then yes, almost everything that you can do on excel, you can do here without all the learning curve. That's why we are calling this our newest most powerful analytics feature.
3. Combining different data sources: Combining stock data + trading data
You can not only combine tags, but the AI system can also understand the structure of our own data sources and intelligently query from them. Below are some examples.
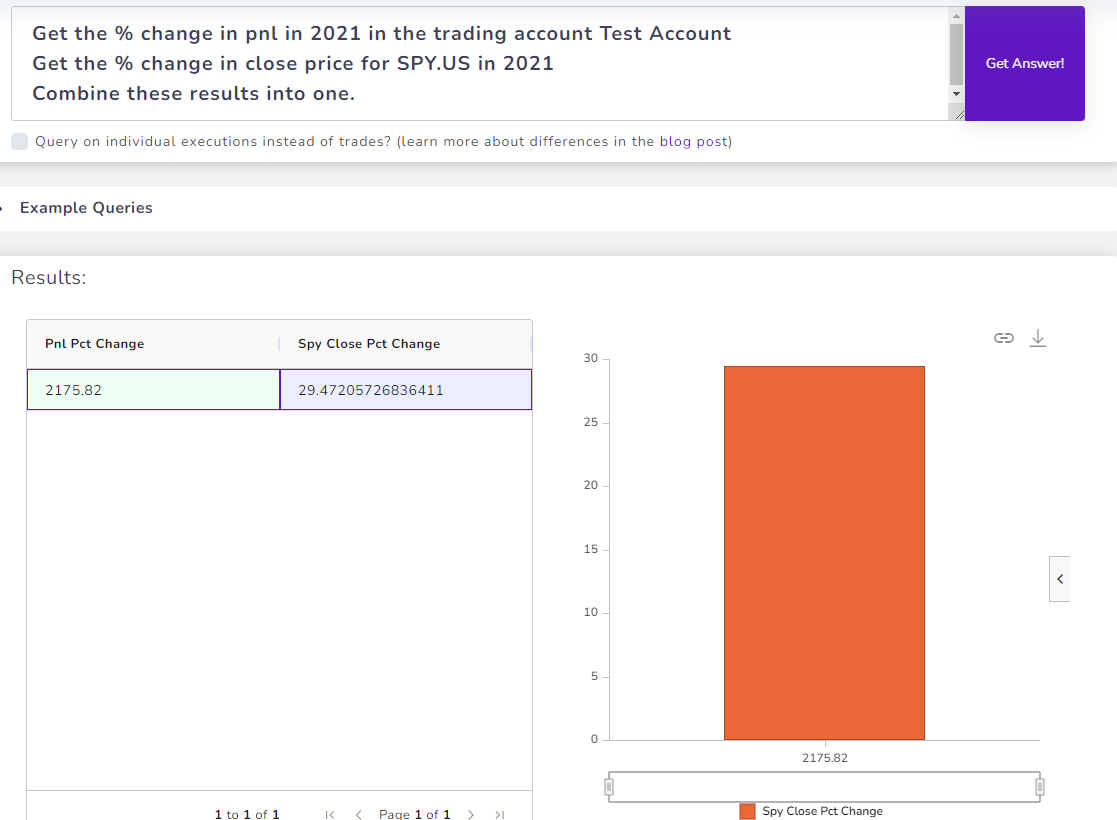
Query 1:
Get the % change in close price for SPY.US in 2021
Combine these results into one.
What does this do? It gets the SPY return in the year 2021 and compares it to your account's return in the same year.
Now you can probably start to think about the various ideas and ways you can query the AI system.
This query's result cannot be achieved via any other chart/features in TradesViz. The only way is: Check the seasonality in one tab, check your returns via money transactions in another, and compare both. But AI query ties together all of this data for you to explore via a single tab.
Notice that this query has multiple parts. This is how you make the system understand that you are getting data from different systems as it would have been a complex query to write in a single coherent line/sentence for the AI system to understand.
5. Cumulative charts
So far we have seen a lot of bar charts and simple non-aggregated line charts. But what about cumulative charts?
Based on what you have learned so far, can you replicate this simple cumulative chart that you see on your overview page?
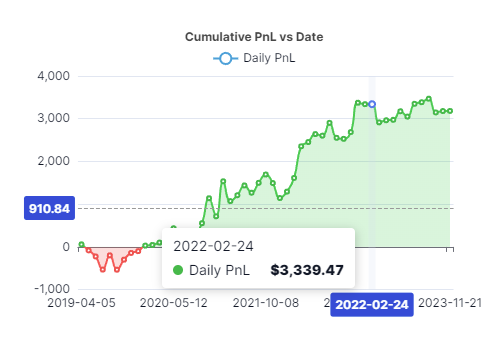
As it turns out, we can use AI query to generate cumulative charts, but it is a little tricky as you now have to use some specific keywords to get the correct results.
Here's the AI query to generate what is in the overview chart:
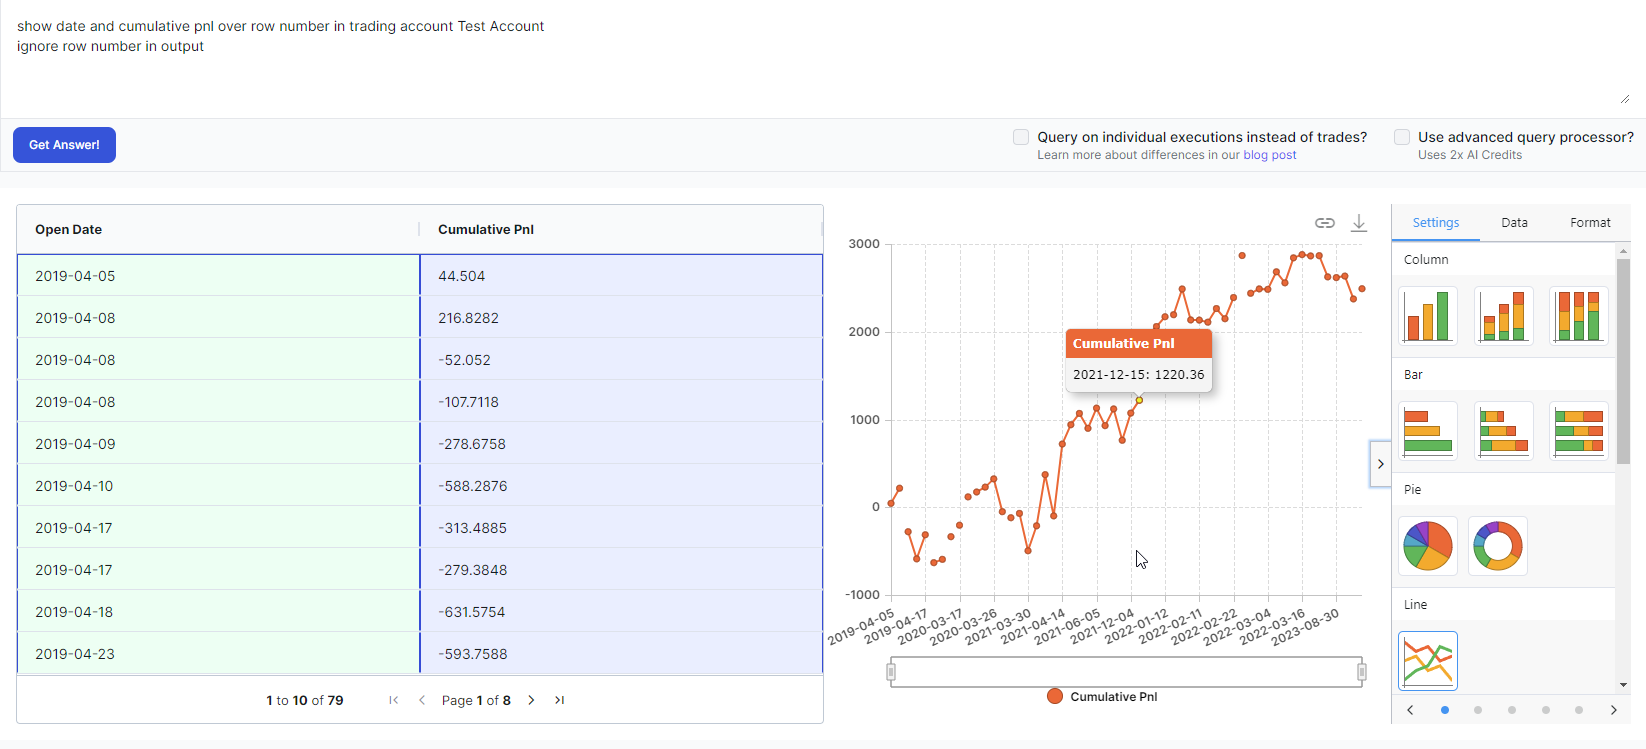
Query:
ignore row number in output
The special part here is the "over row number" here. Yes, if you are a trader, this makes no sense whereas programmers or database engineers will get it. It's a special construct to make sure the returned number is summed in an aggregate fashion instead of grouped per the x-axis label. Note that you have to switch to a line chart mode if you want the data to be visualized better as bar type is not good to visualize aggregated data.
Here's a more complex example:
What if you want to plot the cumulative pnl of certain tags versus another tag?
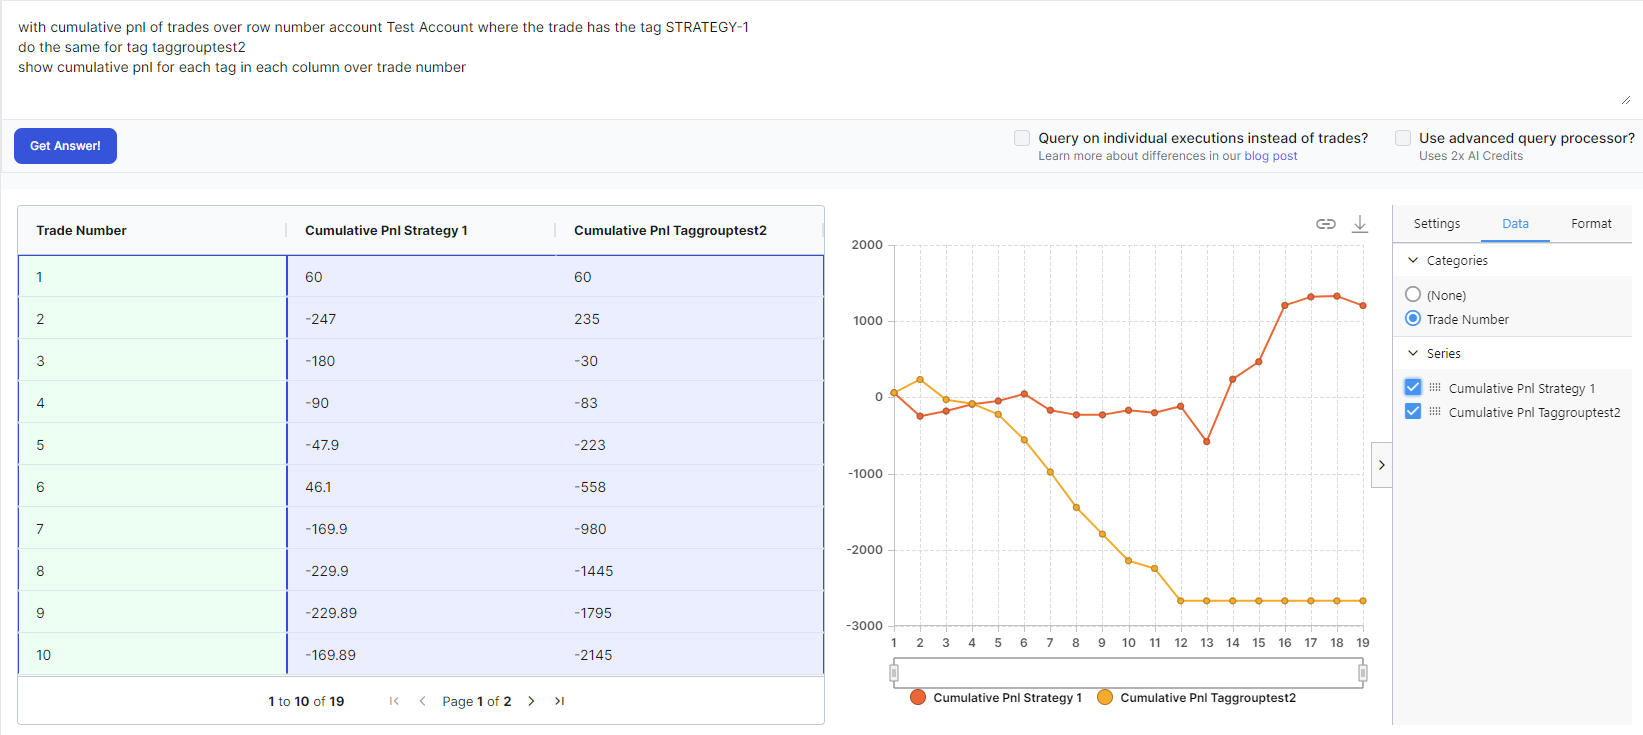
Query:
do the same for tag taggrouptest2
show cumulative pnl for each tag in each column over trade number
Again, you can see that we have used the same keyword of "over row number" in addition to the last query which says we have to display this by for each tag BY trade number and not by date. It is currently not possible to get this chart anywhere on TradesViz (the closest is via the v2 Group compare's chart).
4. Custom "Recent" analytics
You may have a requirement to check the statics of say, the 15 executions or trades only. It's hard to do this on normal charts because all charts except for our recent trend charts (which was actually an idea derived from the AI query) have date as X-axis and the filtering is also done primarily by date. This can be overcome by using the AI query's flexibility. Here are some examples.
Query:
also show date, quantity traded and symbol
This query shows the info of the last 20 trades only.
Why is this useful or how can AI query features help here? Note in the results that you are able to chart the chart however you want.
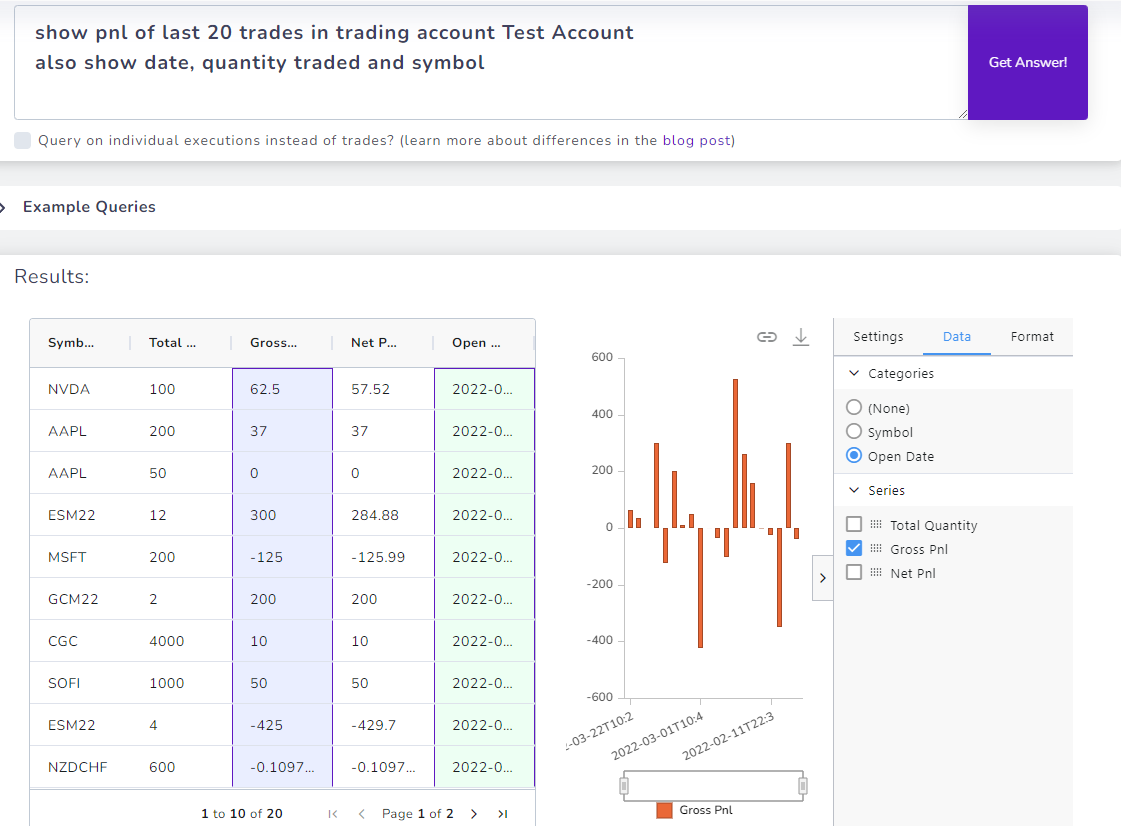
You can also try an aggregate-based query and see how that is charted for just the last few specific trades.
Also notice how we used a multi-step query to tell the system to show additional data (in this example, you could have typed in all the column names in the first line itself, but we wanted to show a demo of how queries can be simplified further to reduce error rate).
We are constantly thinking about how to *usefully* integrate AI into your everyday journaling and analytics. While there may be many tools and platforms in finance that utilize AI to simply query data sources, we want our system to be able to simplify trade journaling for users - this requires us to build very specific systems to understand trading data while keeping privacy in mind.
We are excited about building and using AI in the TradesViz journaling system and we hope you find it useful!
Do you have any other requests? Do you want us to write particular guides exploring specific anlaysis? Let us know at [email protected]. This guide was made based on popular user requests on how to effectively use the AI system and also as a precursor to the upcoming AI widgets feature.