This is Part 2 of the reference guides we have written to help all TradesViz users get to know about the various statistics we have in our dashboard. You can refer to Part 1 of the guide here where we talk about all the charts and where you can find them. In this guide, we will explore what each stat means and the meaning behind the general terminology used in TradesViz.
We will explore each tab and cover all the charts, statistics, and their significance in detail in this post.
Daily Statistics:
- The Total PnL is the total profit and loss for the duration mentioned below the number. You can click on the duration (example: "Last 60 days") to change it to any duration you want. This number is the same as the last (rightmost) point of the Total PnL graph.
- The PnL % change is the change between the first number (leftmost) in the Total PnL graph and the last number (rightmost) in the Total PnL graph.
- Win-rate charts follow the same definitions as mentioned above.
- Total win/loss score is a simply rolling sum where each win = +1 score and each loss = -1 score. It's an interesting chart to keep track of how much your winning/losing streaks are in a visual manner.
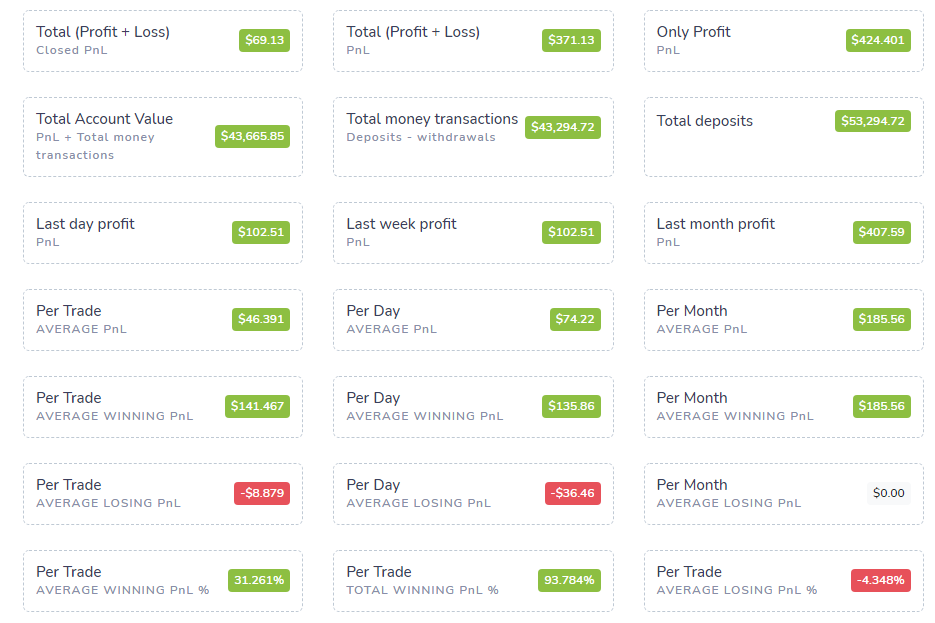
Overall Statistics:
- This tab has a lot of stats and gives you a complete snapshot of your full portfolio.
- The PnL statistics give you all the info related to PnL - sum, min, max - group by calendar such as year, month, week, and also average statistics of the same values. Note that Total PnL values include only PnL from your trades only the Total account value includes PnL + the total money transactions - i.e, the total value of your portfolio.
- Other statistics Scores have popular trading metrics that can help you measure your trading performance.
- Profit factor: The profit factor is defined as the gross profit divided by the gross loss. (Source)
- Gain-to-pain ratio (trade-by-trade version): We define this as the ratio of the sum of all wins and losses to the sum of all losses. There are several variants of this that use percentage or monthly percentage return, but this version can be interpreted in the same way. The higher the number the better you are performing.
- Kelly criterion: While the formula is a bit different from the other metrics we have here (Source), what the number tells you (percentage) is the size of the positions you should be taking. For example, if the Kelly percentage is 0.05, then you should take a 5% position in each of the equities in your portfolio. This system, in essence, lets you know how much you should diversify.
- System Quality Number: This is one of the metrics introduced by Van Tharp. It is the ratio between the average PnL and its standard deviation, multiplied by the square root of the number of trades. The average PnL measures your system’s profitability, while the standard deviation measures consistency. Higher numbers are better.
- Standard deviation (PnL, Profit, Loss): This is a simple standard deviation of the quantities mentioned in the metric. (Definition of standard deviation).
- Trading expectancy: A very important metric that combines your win-rate/loss-rate, average win-size/average loss-size. If the number is positive, it shows that the strategy has a positive expectancy - i.e, the system is making money. The expectancy is the average return for each trade, including wins and losses.
- Max drawdown: The maximum your Total PnL curve has gone down from a peak.
- Max consecutive wins/losses: The most amount of wins/losses you have had (In terms of fully closed trades) continuously.
- Win/loss ratio: Average winner/Average loser
- Adjusted win/loss ratio: (Average winner * % of winners) / (Average loser * % of losers)
- Sharpe Ratio: Measures risk-adjusted return by dividing mean daily P&L by its standard deviation (annualized). Higher = better return per unit of total risk. A Sharpe above 1.0 is generally considered good. Note: this penalizes upside volatility too, so consider the Sortino Ratio if your returns are positively skewed. Full guide →
- Sortino Ratio: Like the Sharpe but only penalizes downside volatility (losing days). If your Sortino is much higher than Sharpe, your strategy has favorable positive skew — big winners aren’t hurting your score. Full guide →
- Calmar Ratio: Total net P&L divided by the absolute max drawdown. Tells you how much profit you earned relative to the worst equity-curve pain you experienced. Higher is better. Full guide →
- Omega Ratio: The sum of all positive daily P&L divided by the sum of all negative daily P&L. Similar to Profit Factor but at the daily level, and it captures the entire return distribution (including skewness and kurtosis). Above 1.0 means you’re net-positive on a daily basis. Full guide →
- Ulcer Performance Index (UPI): Return divided by the “Ulcer Index”, a measure of drawdown depth and duration. While Calmar looks at one worst point, UPI captures how long and how deep you stayed underwater. Higher UPI = smoother ride. Full guide →
- Recovery Factor: Total net profit divided by the absolute max drawdown. Tells you how many times over your cumulative profit covers the worst drawdown. A value of 3.0 means you’ve earned 3× your worst-case loss. Full guide →
- Tail Ratio: The 95th percentile of daily P&L divided by the absolute 5th percentile. Measures whether your extreme gains are larger than your extreme losses. A ratio above 1.0 means your big winning days outsize your big losing days. Full guide →
- CAGR (Compound Annual Growth Rate): Your annualized rate of return accounting for compounding, calculated as ((ending account value / starting deposits)252/trading_days − 1). Requires deposits to be entered in the Money Transactions tab. Shows N/A if no deposits are recorded. Full guide →
- Total trade and volume statistics give you a snapshot of how active your training is - stats like trades/month, volume/month etc., can be found here.
- Symbol statistics show you the best/wost ticker by PnL and also the max/min traded tickers. You can click on each of the tickers (visualized as tags) to apply them as filters or explore the trades directly from this tab.
- Finally, trade duration and commission stats show you the total duration of winning/losing trades and stats like total comms spent per day/week and also avg of these statistics.
Money Transactions:
This is where you can enter the account or portfolio starting balance. Note that we do not extract any deposit/wire/expenses-based info from your imports. We only import trade/execution relation info only You can use this tab to input all of those additional values as deposits and withdrawals into your account. The graph on this page is the only graph in the dashboard that includes your deposits, withdrawals and shows you the entire account equity.
Calendar:
- The first tab - year view gives you a heat map of the entire year(s) of trading - you can choose to view multiple years by clicking on the 3-dots icon on the top right corner. Clicking on each cell will redirect you to the trading day explore view and clicking on a section of the month will redirect you to the month view tab.
- The second tab - month view shows you PnL closed PER DAY for all days in a given month. You can also see no. of events such as IPOs, splits, etc, in this view. Clicking on the number of the date inside any cell will redirect you to the day explore view.
Tables:
The trades tables are one of the most frequented tabs in TradesViz. We will focus on this table in this section as the other tables - symbol grouped and day grouped are basically derived from this table.
Here are some useful functions of the table:
- You can export the current page of the table in PDF/Excel format by clicking on the PDF or Excel button at the top of the table
- You can hide/make visible certain columns by clicking on the Column visibility button
- You can expand/minimize all the rows to show the inner executions of each trade on the current page by clicking on Toggle collapse.
- You can use the group apply to apply a function - like adding commissions, generating charts, adding/removing tags or notes to many trades at once using the group apply function. More info can be found here.
- You can rearrange the columns by dragging the column header and moving it horizontally to the position you want.
- You can also view all the columns by clicking on the toggle horizontal scrolling.
Here are all the table columns (updated as we add more):
- Symbol: Symbol of the trade - Will only show underlying if it's a spread-based option trade.
- Open Date: Date of the first execution of the trade.
- Close Date: Date of the last execution of the trade.
- Position: Side of the position - long or short (this is based on the side of the first execution of the trade sorted by execution date).
- Total Executions: Total executions of the trade.
- Duration: Total duration of the trade.
- Open Price: Price of the first execution of the trade.
- Close Price: Price of the last execution of the trade.
- Total Volume: Total quantity of assets traded.
- Open Position: Total remaining quantity of the trade (i.e the total amount of assets needed for the trade to be considered 100% closed).
- P & L: Total realized profit and loss of the trade (by default, it's gross PnL, it can be set to Net by clicking on the "Filters" button at the top right corner of your dashboard and selecting "Net" and "Apply changes").
- Notes: Notes you have made for the trade.
- Tags: All the tags you have added to the trade (clickable - can explore trades filters by a particular tag by clicking on "Apply as filter" after clicking a tag).
- Total Commission: Total commissions paid for the trade.
- Total Fees: Total fees paid for the trade.
- Remaining Unrealized P&L: The REMAINING PnL you would get if you fully closed the trade now (excludes the already realized pnl).
- Current P&L: The TOTAL PnL of the trade if you were to fully close the trade now (includes the realized pnl)
- % Return: % return of the PnL in proportion to the total value spent on the trade.
- R-Value: Van Tharp's R-value measure (more info). This field is populated only if you have entered your stop loss for the trade.
- Stop Loss: Stop loss for the trade (user-defined/editable via the trade explore or by clicking the pencil icon in the row)
- Profit Target: Profit target for the trade (user-defined/editable via the trade explore or by clicking on the pencil icon in the row).
- DTE: Days to expire for options.
- Price MAE: Total value the underlying has gone against you during the trade (maximum adverse excursion).
- Price MFE: Total value the underlying has gone in your favor during the trade (maximum favorable excursion).
- Last Price: Last price of the underlying of the trade (based on EOD).
- Stop Distance: Distance from the open price and the stop loss.
- Profit Distance: Distance from the open price and the profit target.
- Open Stop Loss PnL: Price-value difference between the buy/sell cost basis (based on the position of trade) and stop loss.
- Open Profit Target PnL: Price-value difference between the buy/sell cost basis (based on the position of trade) and profit target.
- Buy Cost Basis: Average of all the buy-based execution values of the trade.
- Sell Cost Basis: Average of all the sell-based execution values of the trade.
- Unrealized R-Value: R-value calculated with the assumption that the trade was closed with the last EOD values.
- Total Value: Total price value of the remaining position of the trade.
- Total P&L Ticks: Total PnL in tick-values (symbol specific) for futures only.
- Best Exit efficiency: % of PnL captured compared to the best exit PnL (more info).
- Best Exit PnL: Best exit PnL by adjusting the last execution's execution time (more info).
- Best Exit Time: Time at which best exit PnL was achieved after the last execution (more info).
- Trading account: The trading account to which this trade belongs.
- Asset type: The asset type of the trade.
- Positive PnL Time: For how long (in seconds/minutes etc.,) was the trade negative (total sum) during the entire trade's period?
- Negative PnL Time: For how long (in seconds/minutes etc.,) was the trade positive (total sum) during the entire trade's period?
- Max Running PnL: What is the maximum PnL reached during the duration of the trade?
- Min Running PnL: What is the minimum PnL reached during the duration of the trade?
The other tables - Symbol and day grouped as the name implies are simply the trades from the trades table grouped by symbol and per-day. The day grouped table is a bit different. While you will see the total realized PnL of each day (same as the calendar view), the expanded version will only show you the trades you opened or closed (based on account settings) on that day and will not include partial executions in the table row expand view - you will have to explore the row by clicking on the calendar icon to see all the executions/transactions and realized PnL for each of it in the day explore view.
This concludes the sections of the dashboard that has the most unique stats. For all the charts, most of the stats are self-explanatory and you can also refer to this guide on where to find the charts you are looking for.
Please let us know if you need any help with navigating TradesViz or if you need a customized flow of UI for your trading style or if you need more information about any particular stat/chart etc., We are always available to assist you via email - [email protected]