For every type of trader, the calendar tab is one of the most important sections of the trading journal. "Exploring" each day of the calendar tab what day explore helps with.
It has been nearly 4 years since we first wrote about this in our blog. You can read the original here: https://tradesviz.com/tab-explore-dayold.
With the launch of TradesViz v2 along with plenty of updates in the previous years the Day Explore tab has changed we wanted to write a blog post with all it's updates and changes.
Before diving into the details, if you are more interested in a video format, please check this:
(We have 10 NEW videos all focusing on features of TradesViz v2.0 UI)
First, we will list all the ways you can get to the day explore tab. Unlike the trade explore button that you see in almost all trades, there are different buttons/UI elements that redirect you to a day explore page.
There are 3 ways to do this:
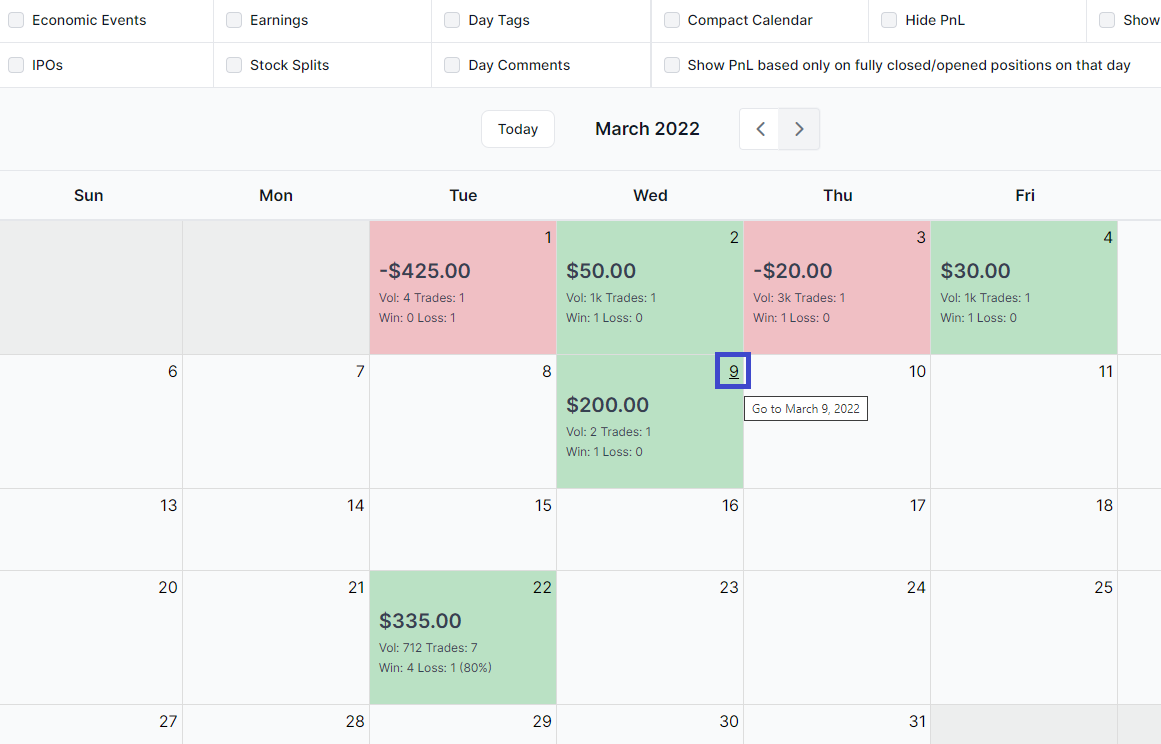
- Explore a day by clicking on the cell number in the trades calendar or by clicking on the small cells in the year view
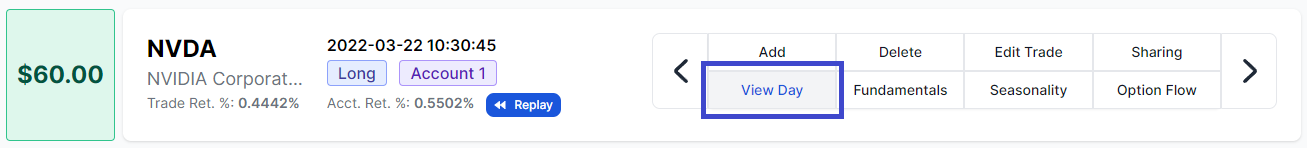
- Explore a day on which the current trade (assuming you are on a trade explore page) by clicking on "View day" button on the trade explore page.
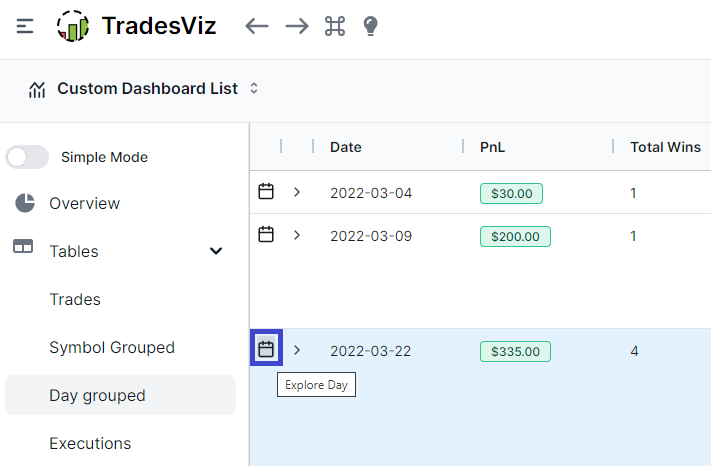
- Click on the calendar icon in the group by days table
Overall, the day explore tab has several sections that are very similar to the trade explore tab. We will visit all the sections one by one below, but for more info on the common tabs, please check the video attached above and also the trade explore tab blog post.
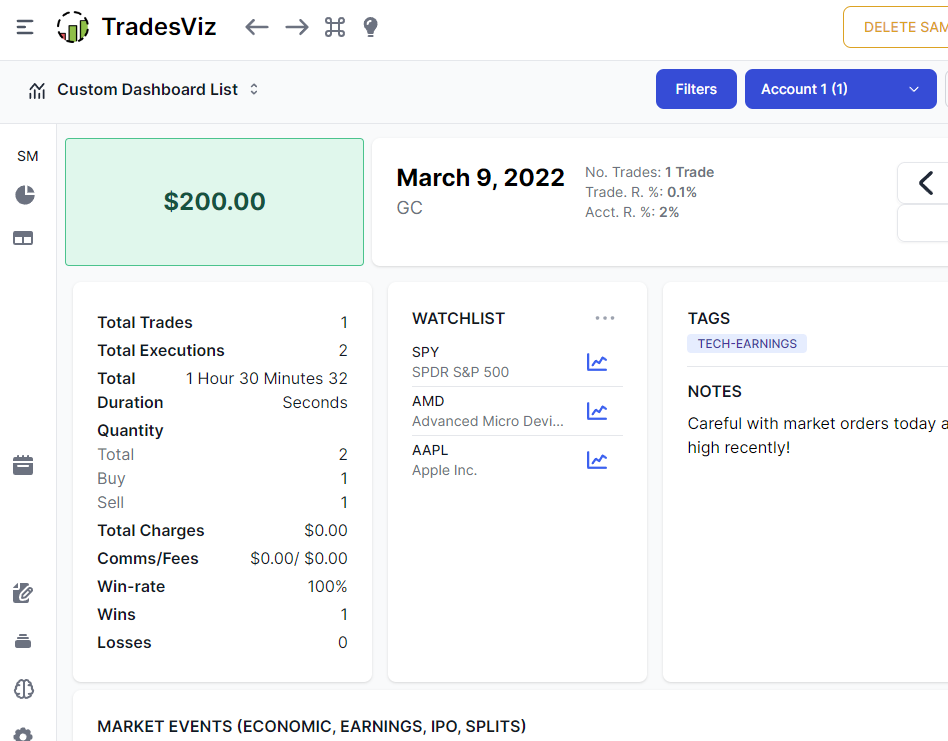
Upon launching the day explore tab from any of the 3 methods mentioned above, you will see a page like this:
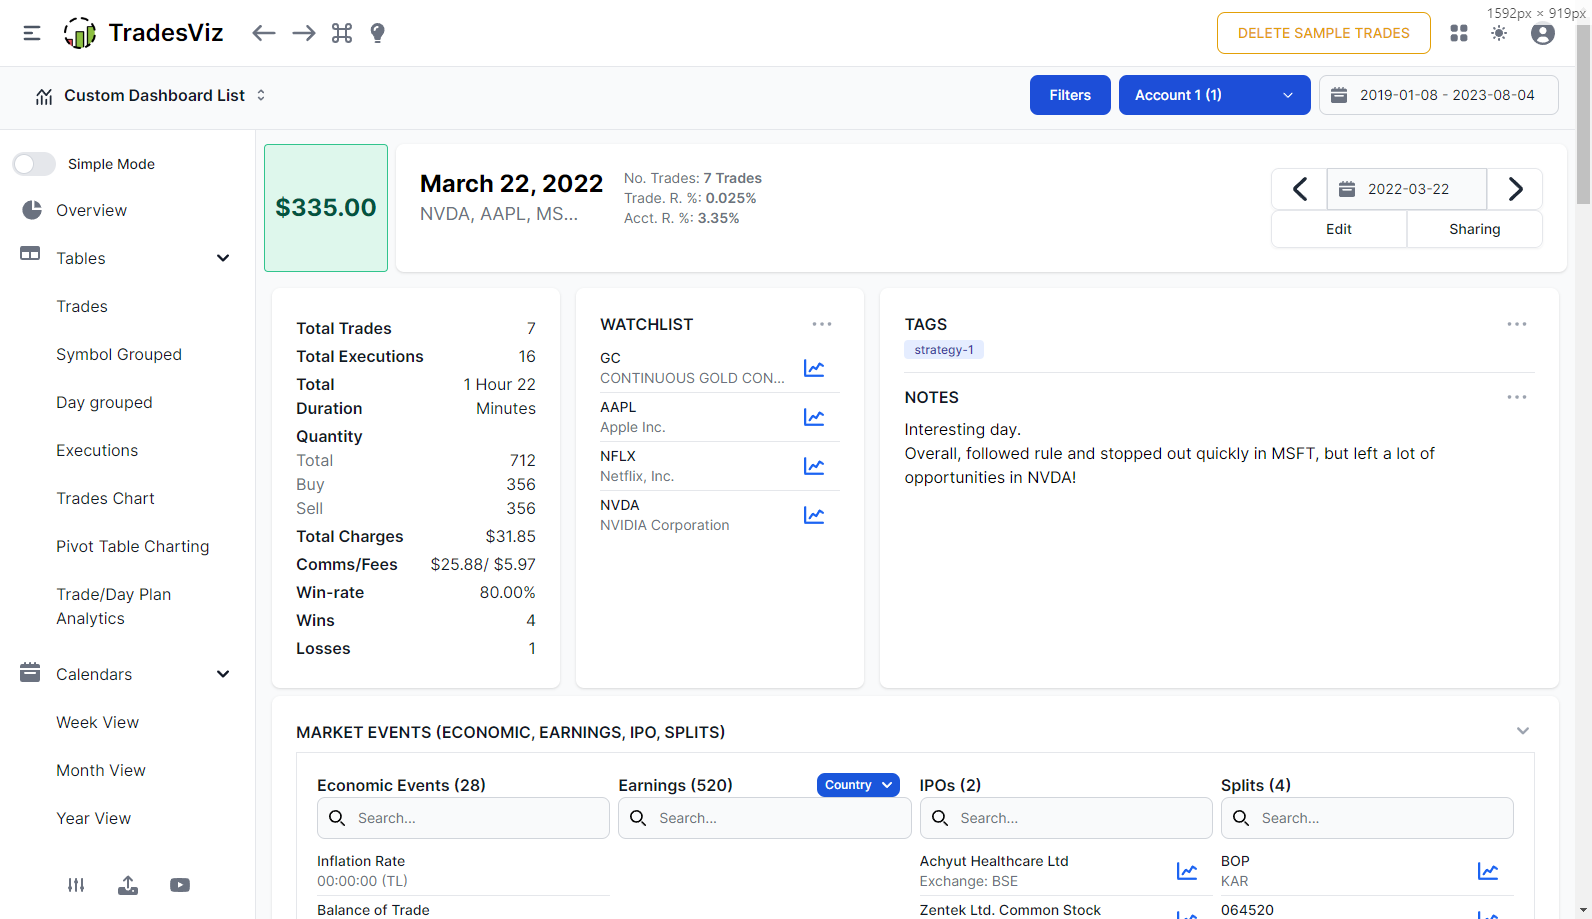
The first section contains the total realized pnl of the day (this includes pnl from all realized **executions**) along with a list of symbols and return percentages. On the right side, you will see a navigation interface to jump to different days or to move forward and backward in the calendar.
The second second is split into 3 parts:
- The first part shows you a summary of no. of trades, wins, win %, total comms/fes etc.,
- The second part shows you the watchlist for the day which can be edited and saved
- The last part shows you the tags and notes which can be edited by clicking on the edit button at the top or by clicking on the 3 dots icon at the top of the tags/notes container
Up next is the daily events section.
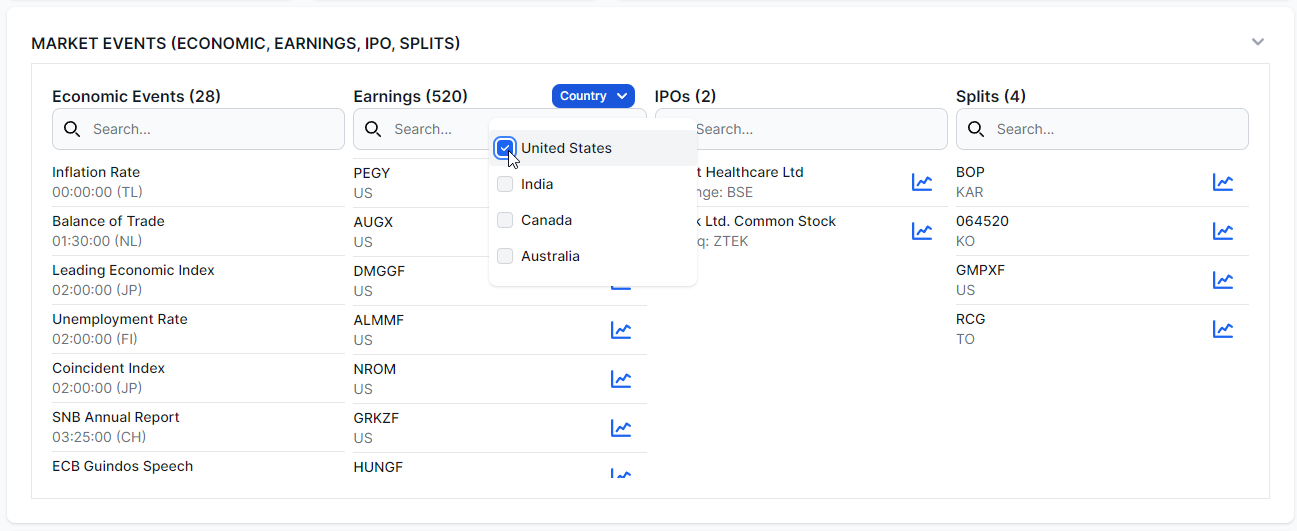
This section shows you international economic events, earnings, IPOs, and splits. You will see the total no. of these events in different colors in the trading calendar of TradesViz itself. It is also possible to search for events in specific counties by typing in the 2 letter country code in the search box. For example, you can type in "(US)" (without quotes) to search for all US events.
Recently, we added earnings for all the countries we officially support - United States, India, Canada & Australia. In addition to searching for specific tickers, you can also filter by any country you want.
For all the symbols/tickers you see on IPOs/Earnings/Splits, you will see a button on the right side that will take you to the symbol explore tab where you will view all the info about that particular symbol.
This is an incredibly useful feature that helps you plan (since all of this information is available for future dates also and data is updated every day) every day and even for the next few days. There is no need for TradesViz users to search for external earnings calendars or economic events because it's all present in your dashboard.
Using the watchlist feature in addition to this makes the perfect daily plan. Add notes and/or tags to quickly write your expectations for the day and the next day you start - you will be able to enter the market with confidence. This lack of preparation is what leads to FOMO and other uncertain decisions that ultimately lead new traders to ruin.
Finally, as with all sections in trade explore, the sections of day explore are also collapsable by clicking on the arrow button at the top right corner of each section. This is preserved across all your sessions.
The next tab is the trades table tab. This lists all your trades made on this day.
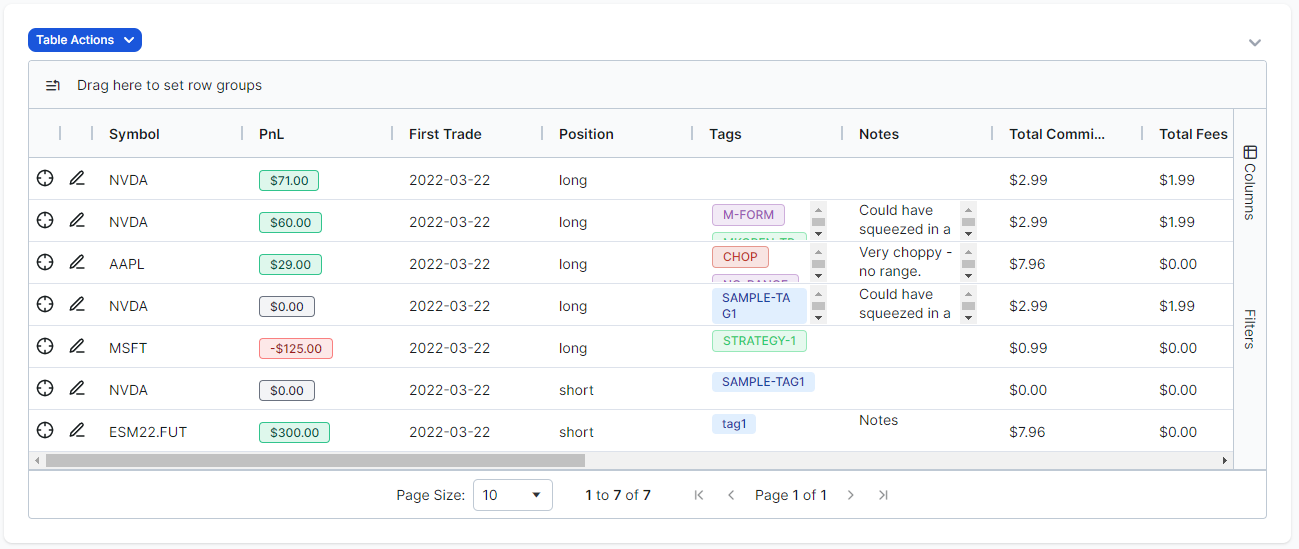
There are a few key points to note here:
- The Pnl you see is the realized pnl for this trade. Meaning, if you open a position on say, the 10th of March, partially closed on the 11th of March, and fully closed on the 12th, you will see the same ticker on the day explore all 3 days but with different PnLs. But exploring the trade on any of these days will lead to the same trade. This is why we emphasize that you are seeing the **realized** pnl per day and not the fully closed pnl that may have happened on another day.
- Similarly, some other stats you see in the trades like the commissions and fees are also only for the executions made as part of that trade on that day
- You can explore a trade by clicking on the explore icon or edit the trade's attributes like tags, notes by clicking on the pencil icon - these are nifty shortcuts to increase the ease of journaling and navigating to different pages on TradesViz.
The next section is the day plans section. We explore in detail the trade plans in the trade explore blog post and also both the general concept of plans in a lot of detail in another blog post so we will not be going in-depth into this feature here.
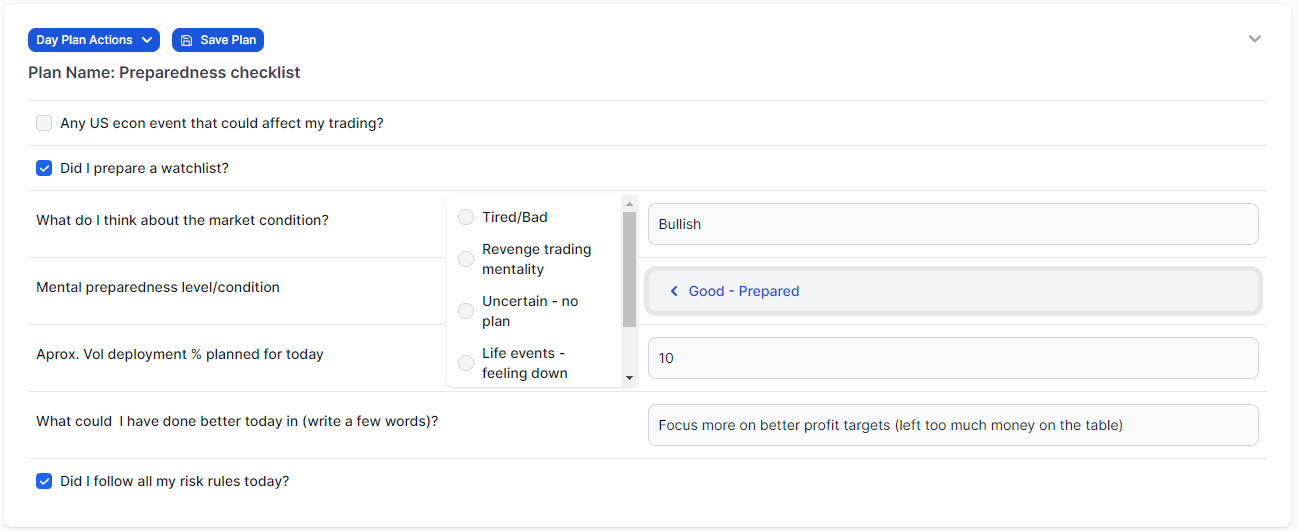
Like the trade plans, it is possible to use the day plans to attach information about how the trading day went or what rules were followed/broken, etc., All of this can then be analyzed via the trade/day plans tab where, for the day plans, you will see all trades for a given day along with the conditions you've entered in a grid that can be used to visualize, analyze and get statistics from.
Features like the trade and day plans make TradesViz an ultimate powerhouse of anlaysis that can be utilized by any trader trading any asset type from any country/exchange to get REAL insights that can be applied to trading. Unlike other trading journals where everything is of a superficial/surface level and provides no real use other than just for viewing stats, TradesViz is designed to be used by traders of any experience level and turn them into data-driven, well-informed, confident, and consistently successful traders.
After the plans section, we have two more sections that are similar to the trade explore tab. The first one is for importing images - again, this is an exact replica of what we saw in the trade explore tab where you can upload images by browsing or copy/pasting and you also have the ability to edit them.
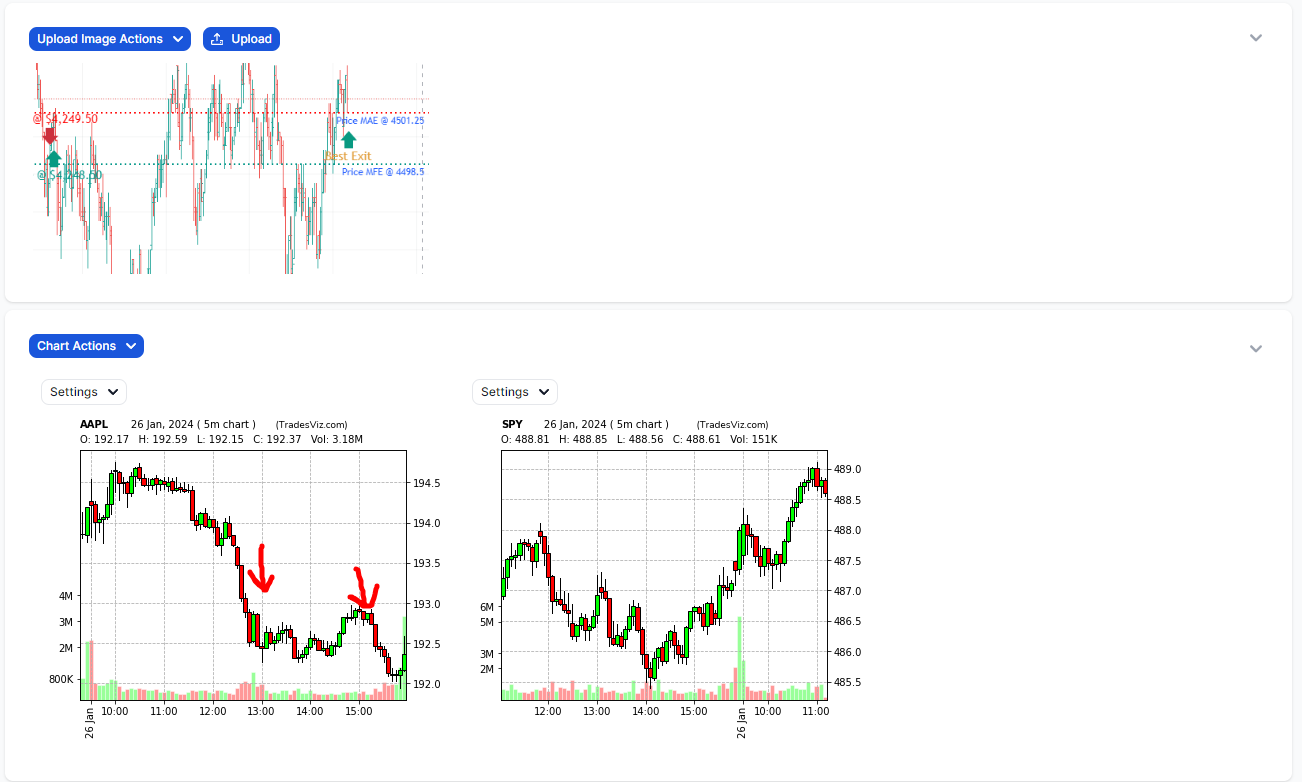
The charts container however has some differences. Unlike trade explore's chart tab where the charts will usually be of the symbol of the trade (you can add custom charts) here, you can *only* add custom charts of any symbol. This is a great way to add stock charts of tickers you want to trade on this day (in addition to the watchlist) and since you can do technical anlaysis by drawing on the chart, it doubles as a tiny charting platform that can help with your daily planning!
In case you are looking for the charts of all the trades (with markers) that were made on this day, fret not, they are at the bottom of the day explore tab:
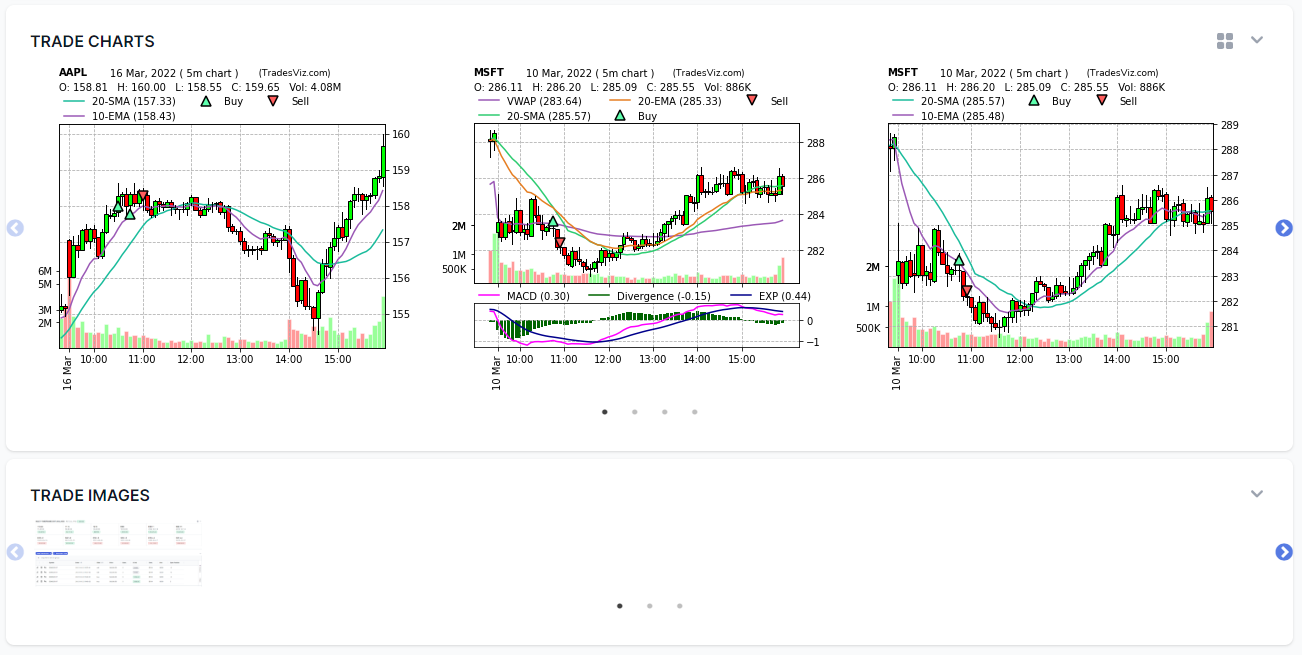
You can view them as a carousel or as a grid by clicking on the grid icon at the top right corner. Note that these are the exact same charts that you see on the trade explore pages of each of the trades made on this day. These images are not editable from this section as they as just a view-only version of the original trade's charts. The last section is for the trade images that belong to the trades that were made on this day.
Finally, we have the realized PnL and volume charts. For traders with a lot of executions made on any given day, this can be a godsend in learning how you performed throughout the day. Relieve all the roller coasters and note them down in the notes section at the top!
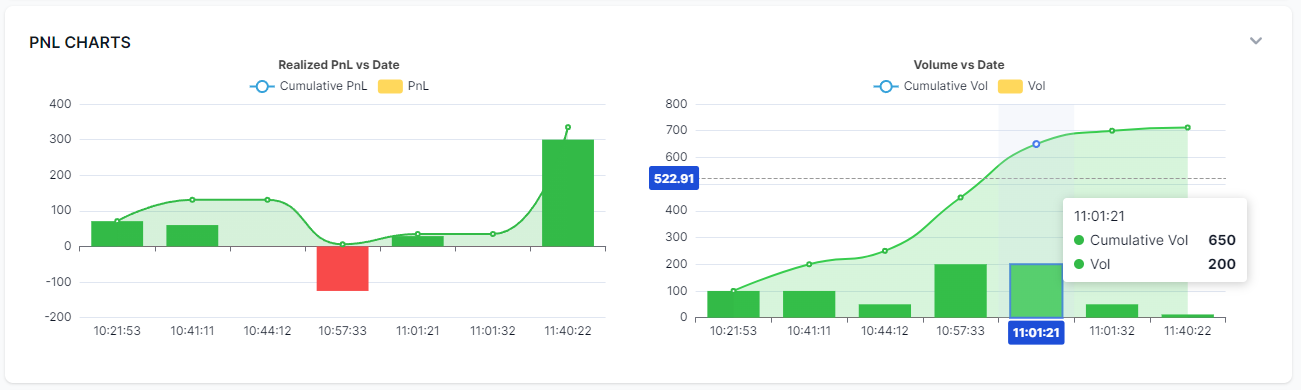
It is important to note that each of the data points of the PnL chart is *realized* pnl from each execution of all trades made on this day. The bars represent the pnl made on each point in the day and the line represents the cumulative sum of the pnl.
This concludes the new day explore section. Compared to the 2020 version, we have greatly improved the interface, usability, and utility of the day explore section. There are no alternatives at all in any other online journaling solutions for the features you see here. The concept of day and trade exploration was introduced and refined by TradesViz in 2020.
We will soon release blog posts for other important tabs, such as the calendar, equity curve, and mor,e using updated v2.0 screenshots and info. Meanwhile, we have already released videos about all of these tabs, so please make sure to check them out.
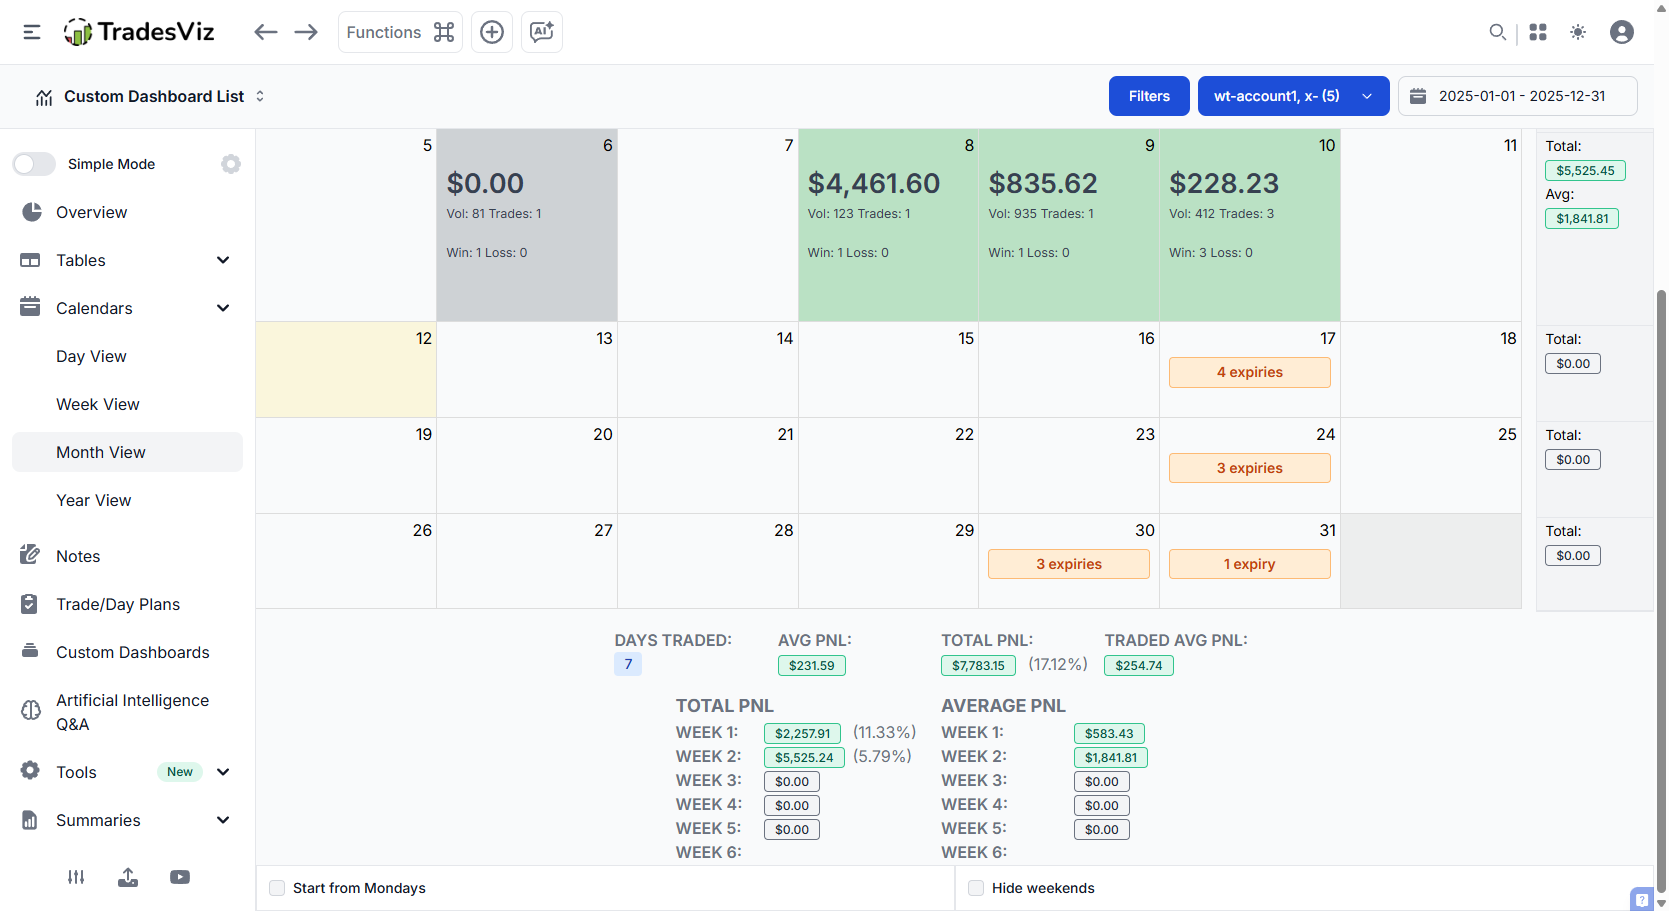
Oct 2025 Update
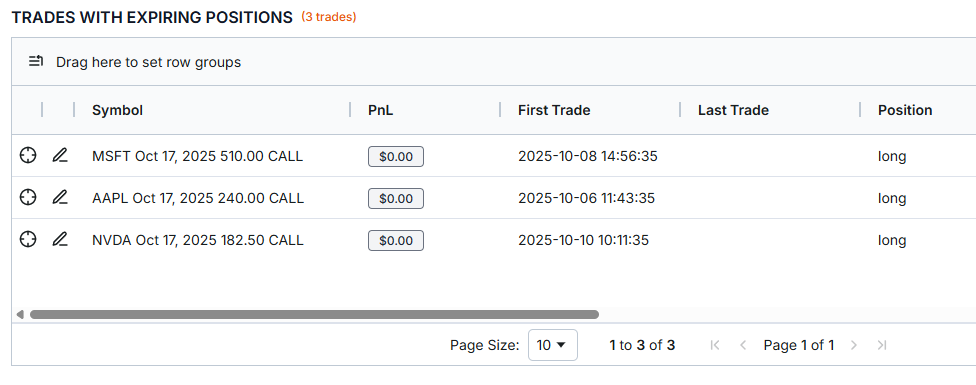
You can now view the trades with expiration executions on future dates. For example, if the current date is Oct 12th and you have a few options trades expiring on Oct 17th, you will be able to view those trades when you visit Oct 17th. To help you with identifying this, we have also added a marker for showing expiries on the calendar so you can directly jump from the calendar to the day explore view.
 |
 |