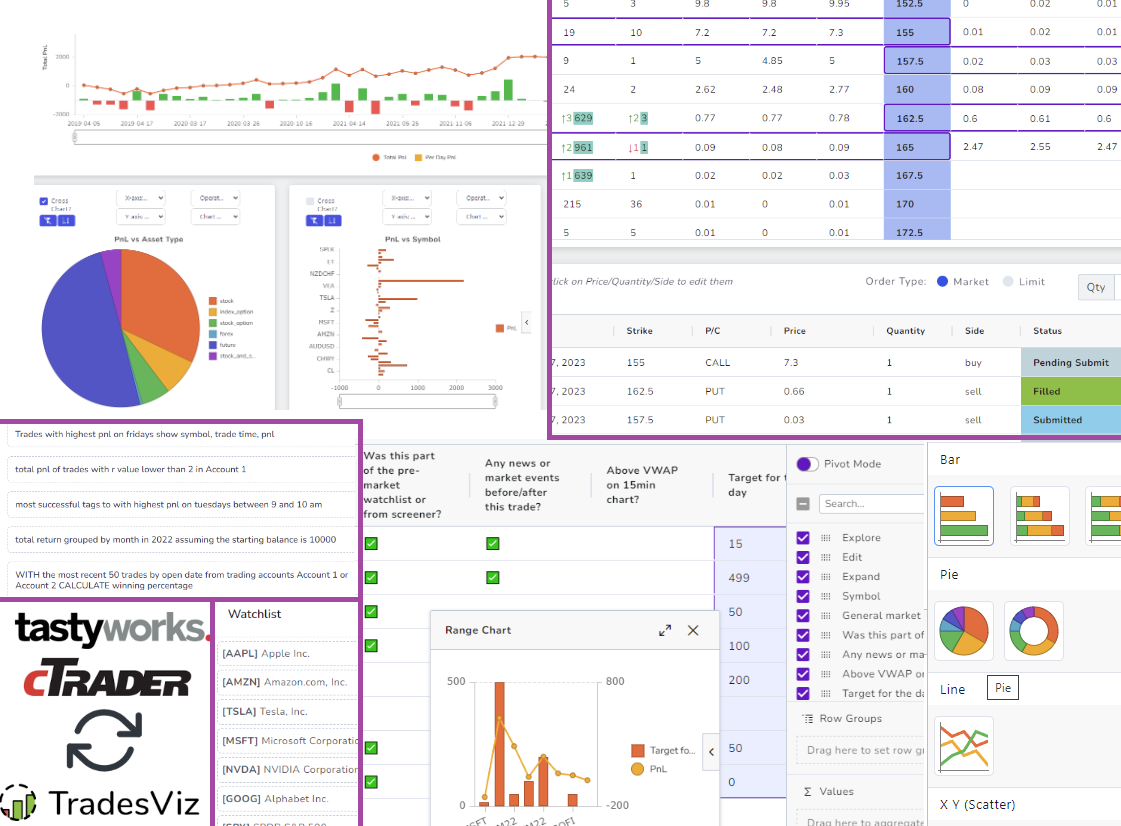
It has been an exciting first half of the year for us at TradesViz as we explored a lot of different domains - not only in trade journaling but also in simulations and analysis.
We set multiple first-in-the-field records and saw TradesViz quickly become the most preferred journal for new traders and a high adoption rate amongst professional and experienced traders who were so far stuck with using outdated journaling platforms.
Here are the MAJOR new features that have changed the trade journaling landscape:
- Pivot Grid + Charting: The feature that made the pros turn their heads to TradesViz and completely shift their trade journaling and analytics to TradesViz. Using the most advanced pivot grids and charting systems available, we created the most powerful single-page analytics showing 1000s of unique insightful charts varying from simple line charts to complex multi-type pivot-based charts.
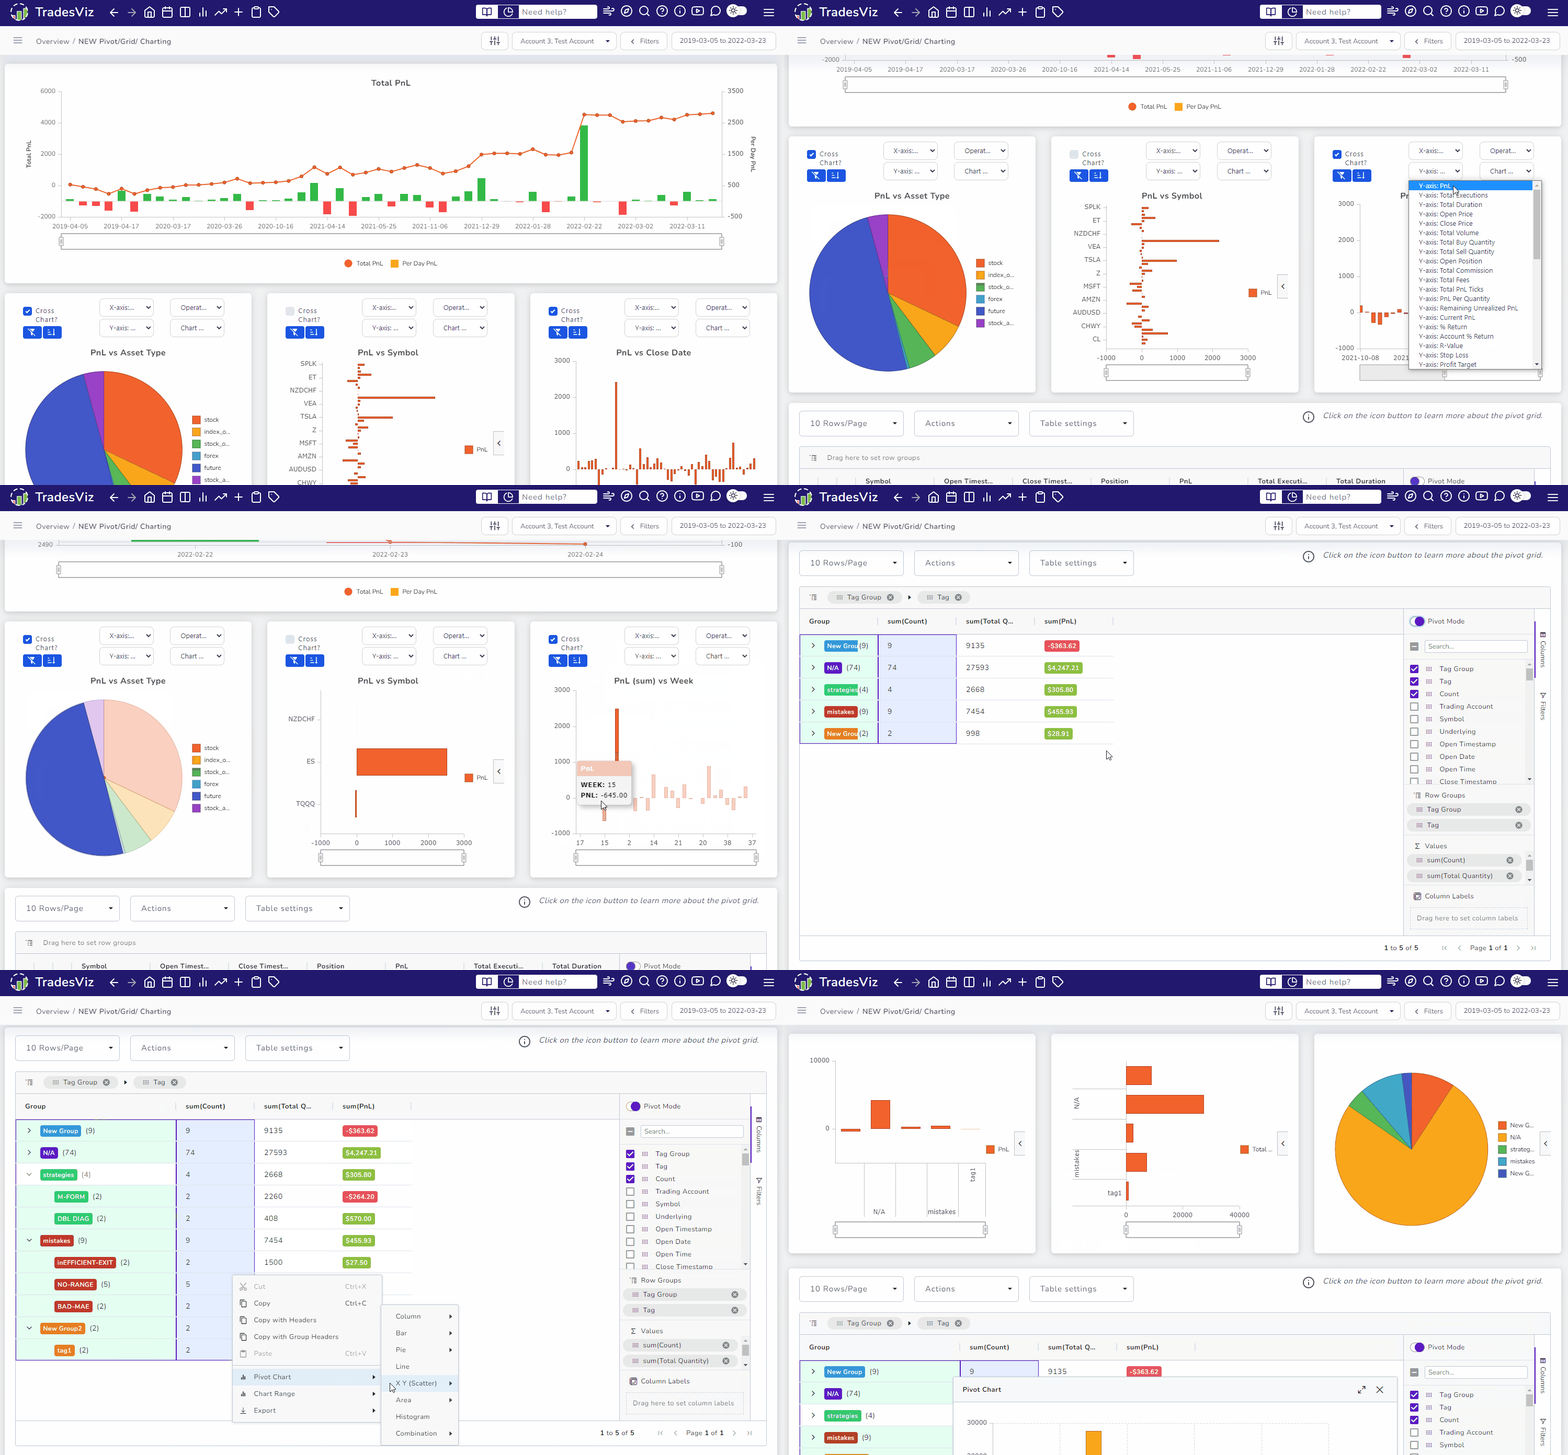
The charts are connected to the table and vice-versa so filtering among even 1000s of trades is a breeze. There is zero loading lag and everything is instant.
If you are looking for a powerful tool that can clearly point out your weaknesses and strengths, this is the end game you are looking at - there does not exist a feature better than this on any other similar tools/platforms. Try it if you are not yet a user - there is nothing like this anywhere.
Read more about how to use the pivot grids to do advanced analysis here.
- Multi-chart trading simulator: Simulators have been part of the daily routine for many traders on TradesViz since we launched our original simulator for stock, futures, and forex.
Our original launch filled in a gap that a lot of traders had. They were able to get analytics, but no way to practice them. Many had to pay for expensive backtesting and simulation subscriptions. We changed that. We built the most extensive simulation platform for ALL asset types (even options) within TradesViz at no extra cost for Platinum subscriptions.
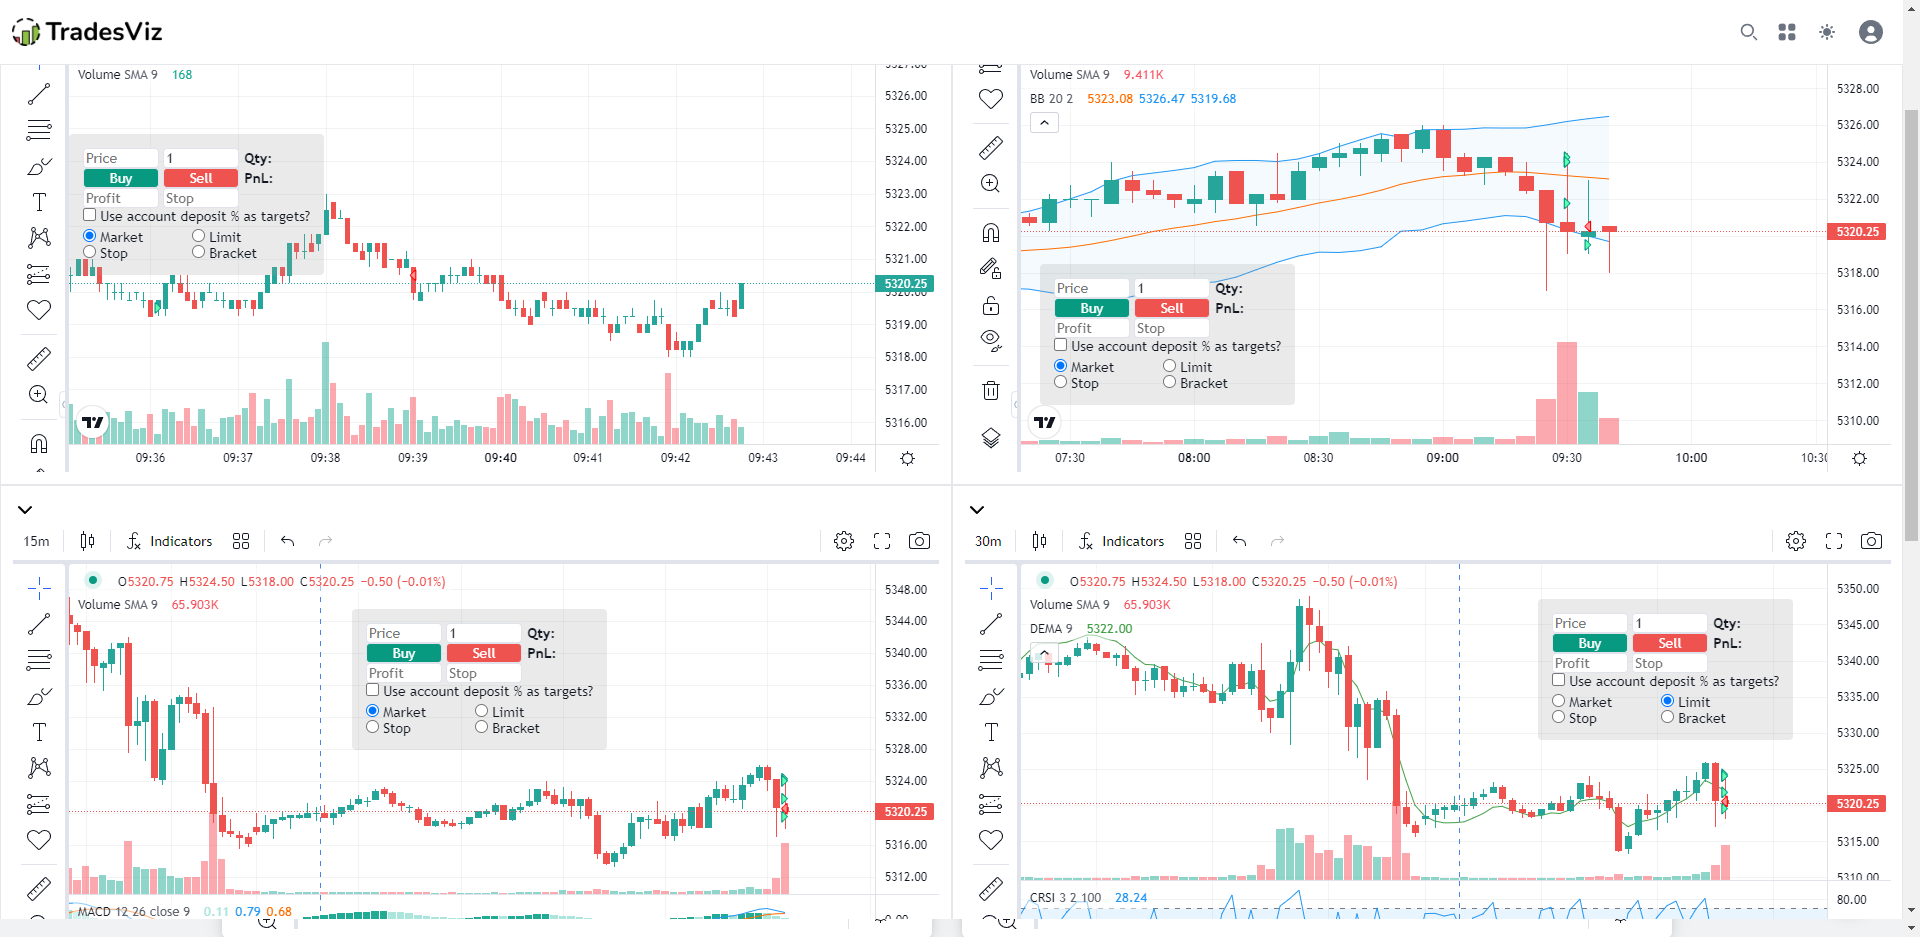
With this update, we're bringing the simulator closer to a real trading platform by providing the ability to have multiple charts open at once. You can now have 4 unique symbols on any timeframe simulating at the same time. Just like the multi-window you have in your real trading platform. For example, you can trade NVDA and AAPL whilst also looking at the movements of SPY. To our knowledge, we are the only trading journal/analytics platform to have this type of simulator system.
- Trade and trading day plans: Ever think it would be nice to attach your own piece of infos/data to your trades and also analyze it? Sure, you can use tags and notes, but notes are not analyzable and tags have limitations.
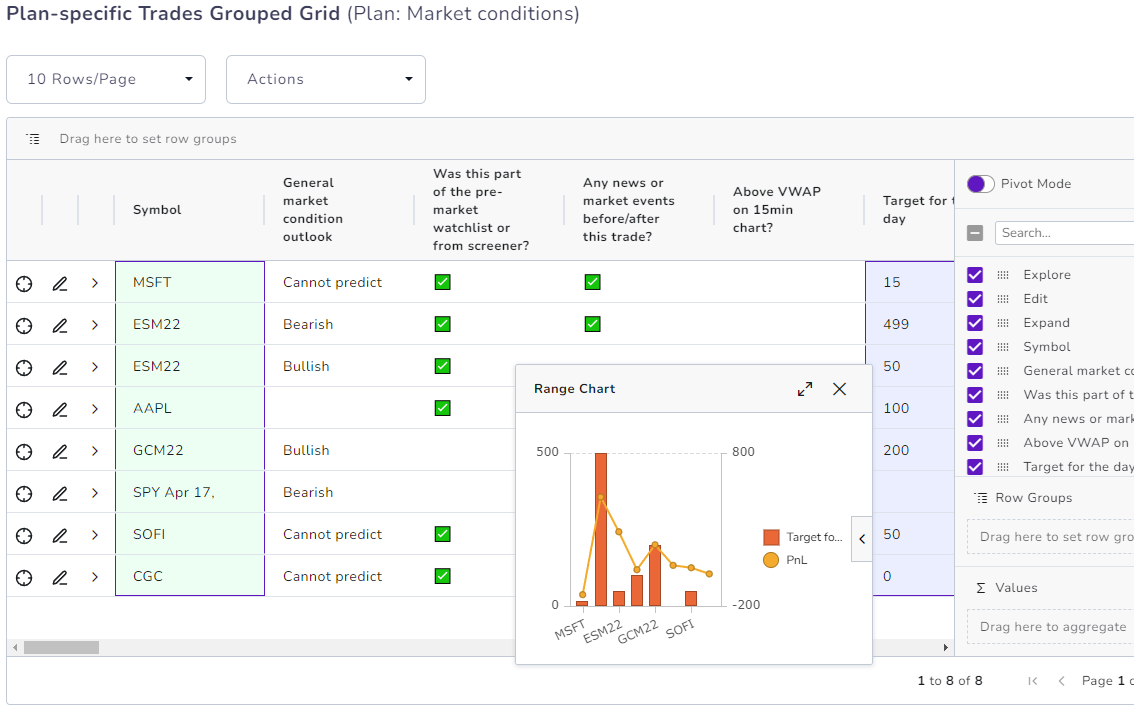
The trade/day plans were created to overcome this problem. You can now plan that comprises checklists, number inputs, short text, etc, and attach them to your trades and trading days. Did you do your premarket research? did you create a watchlist beforehand? How did that affect your overall trading? How well did you follow your strategy/checklist? All of these questions can be analyzed via the trade plans anlaysis.
- Artificial Intelligence Question & Answer Analysis: We've promised this to our users: No BS features. This AI feature adheres to our promise. Unlike certain competitors who come with fancy scores or cover up if-else-if statements as an AI and give it fancy names, we are actually very clear and transparent about even how our system works.
This is the first online trade journaling system with a real, working, useful AI system that you can use to ask objective questions about your trading data.
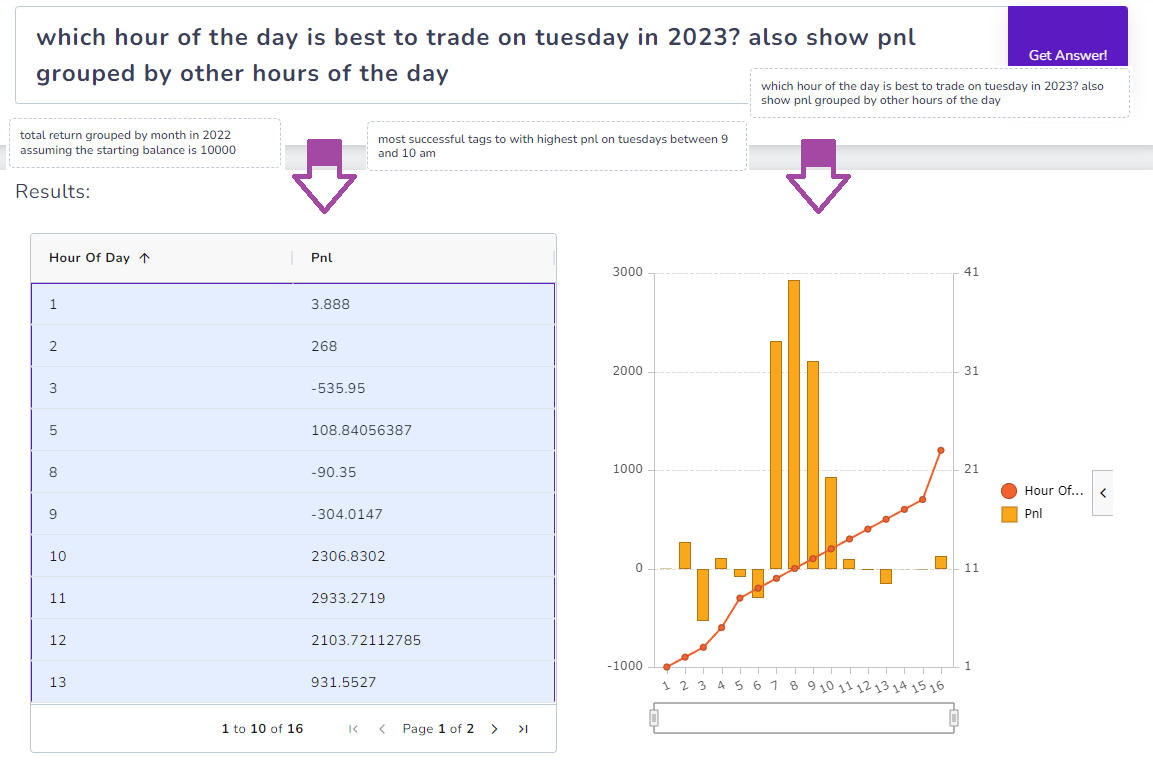
The system works so well that if used with our custom dashboard widgets, it can completely simplify your trade journaling and make it 100% tailor fit to your needs - just like if someone were to build a trading journal exactly for your trading attributes, strategies, and preferences. This is the power of AI query. A revolution in trade journaling and trading analysis that will change how traders will interact with their data.
- Full-fledged Options Chain Simulator: We have simulators for stock, forex, and even futures (one that our competitors and most online simulation platform don't have). But we're taking our simulator suite up one level.
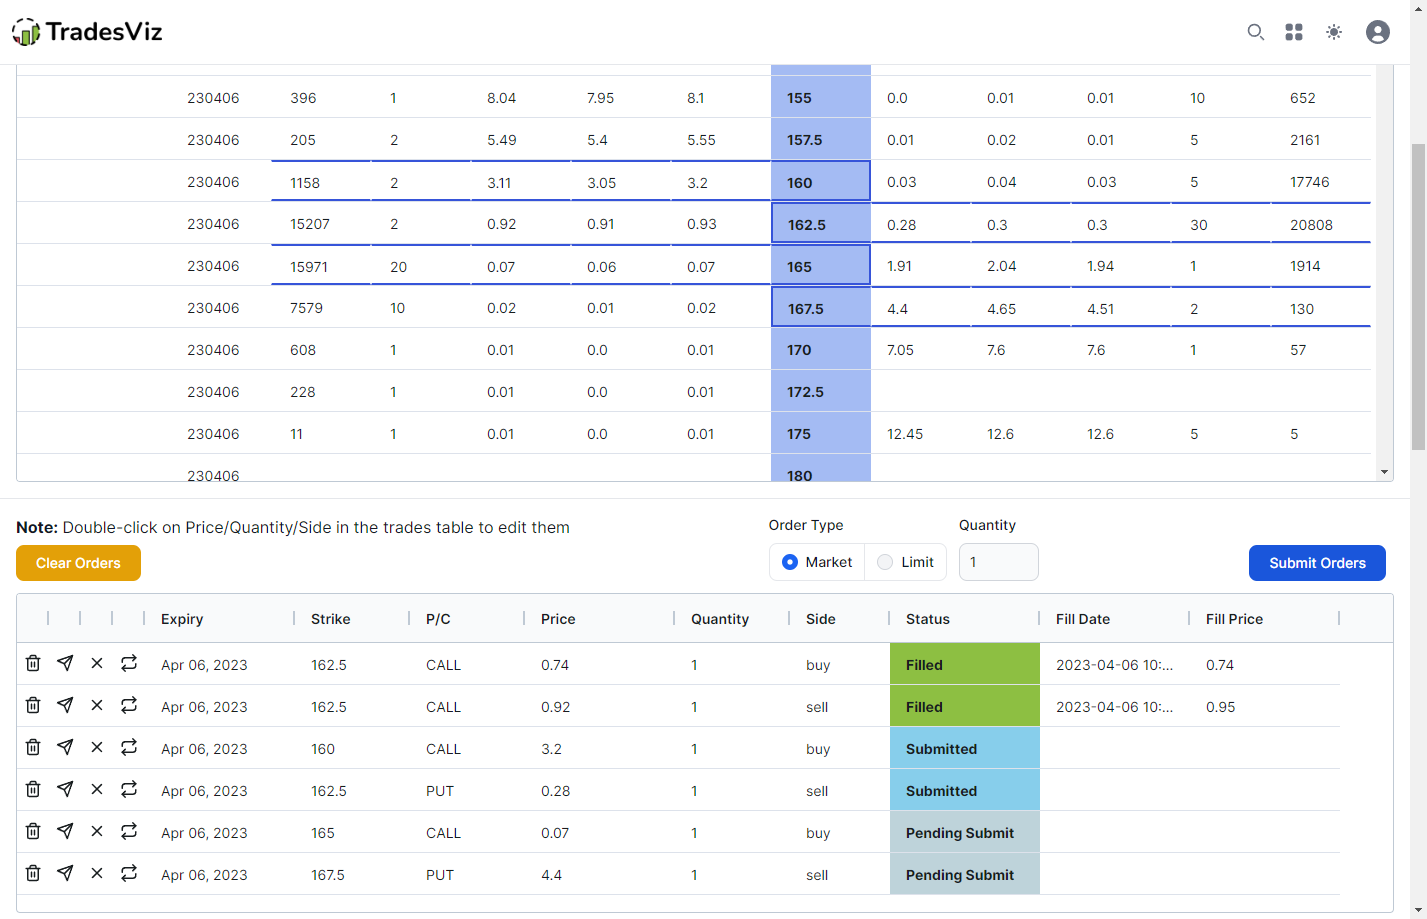
To our knowledge, again, TradesViz is the only online platform to have a full-fledged options chain simulator - yes, you heard that right. The fast flickering options advanced chain interface you see in your trading platform for a symbol? You can now view and simulate past symbols on our options simulator. Place complex leg orders, and watch them get filled just like when you are trading on a real trading platform. If you want to be a better options trader or if you want to learn to trade options, THIS is the best tool available online that can give you the closest experience to the real deal.
Here are some of our minor feature updates:
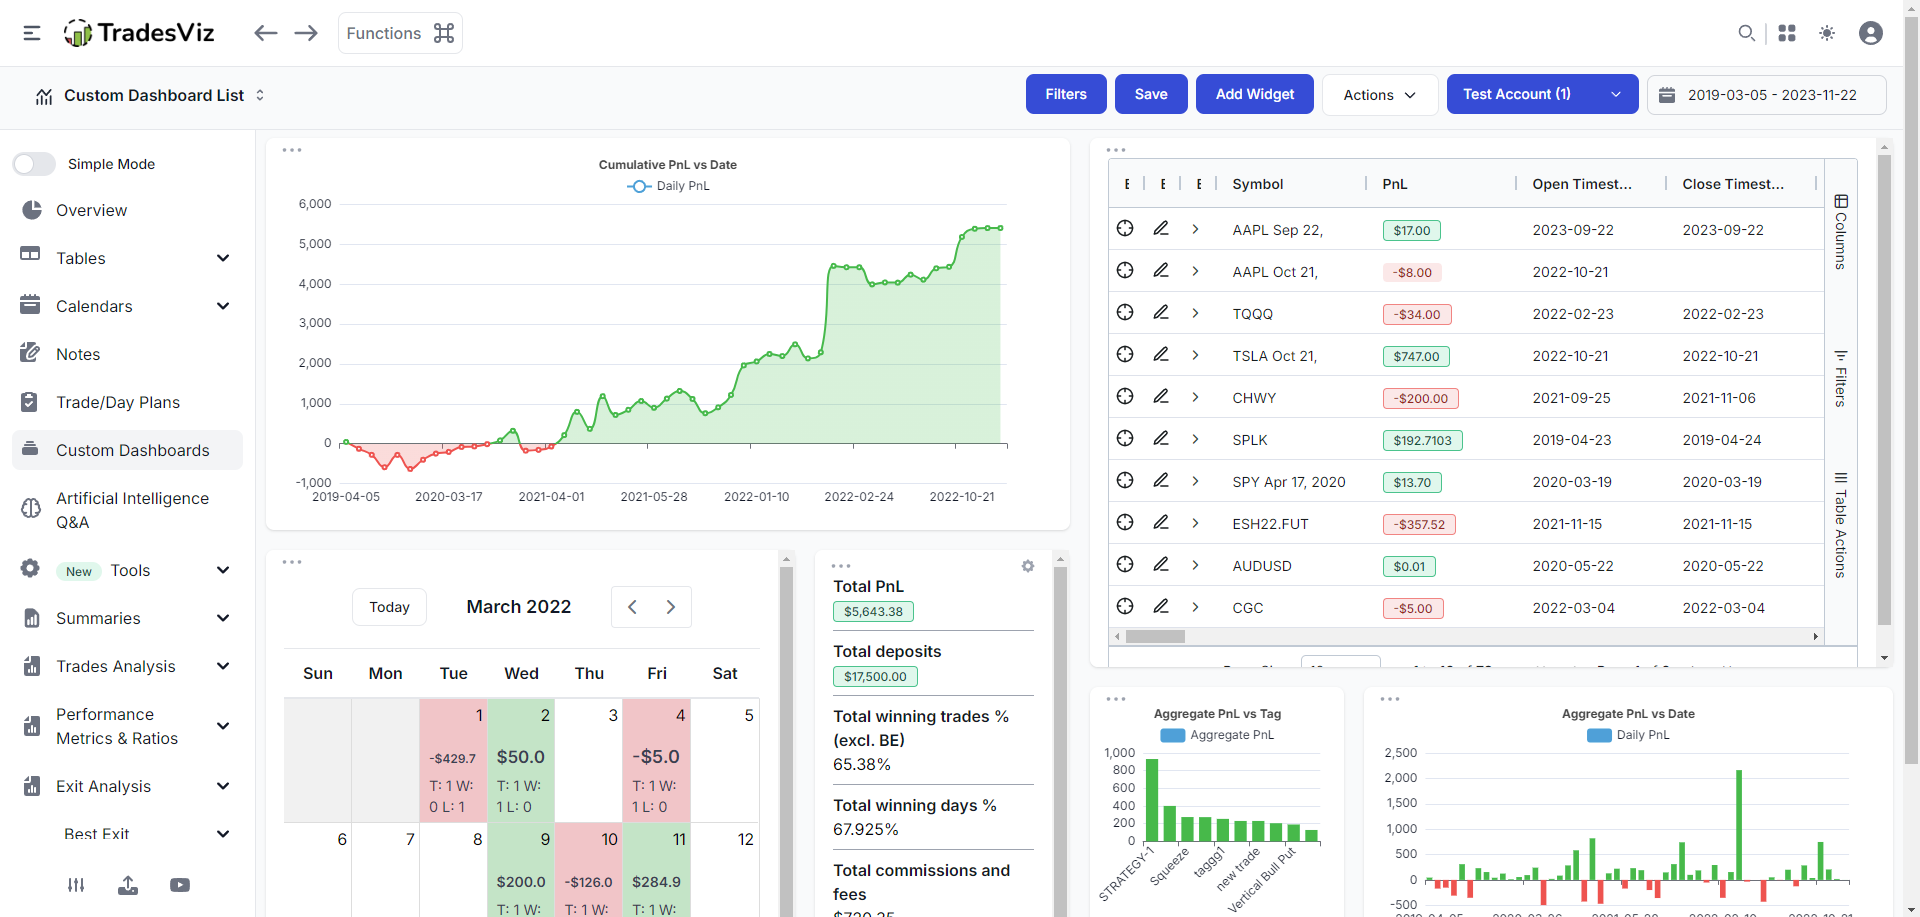
- Custom Dashboard Widgets: Calendar & Statistics List: The custom dashboard is one of the features that defined TradesViz as the most flexible trading journal online bar none. We have extended this to include calendars and even list of statistics thus allowing any trader to add any piece of widget/info to the custom dashboard.
- Auto import trades from TastyWorks: 100% auto-import from Tastyworks broker (imports all asset types!)
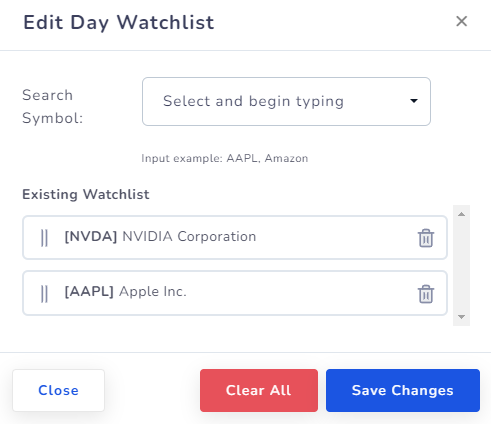
- Daily watchlists: Create watchlists for stocks from your day explore view.
- Trading Trend Analysis: You must have used moving averages in your trading on chart (OHLC) data. But why do we use them? it is to understand the trend of the price averaged over a period of time. Moving averages will always be the most popular and easy-to-understand trend-based indicator.
What if we applied the same to your trading performance?
- What is the trend of your R-value over the last 100 trades?
- Has your average commission/fee payment increased in the last 2 months?
The trend anlaysis tab answers these questions. - Auto import trades from cTrader: 100% auto-import from the cTrader platform (with this, we now have 34 international brokers/platforms auto-syncing with TradesViz - the largest list of connected platforms in the world for any trading journal)
- Running PnL Analytics: Have you ever heard of the phrase "cut your losers" and "let your winners run"?...
It's nice to hear that, but impossible to implement in a realistic way when you are trading.However, you can analyze your historical trades to see if this was the case and let that guide you more realistically so that you can take these insights and apply them when you are trading.
This is why we have created the running pnl anlaysis charts.
- AI-Powered Widgets in Custom Dashboard: Taking customizability to the next level.
Ask any AI question > Get results > Add it to your custom dashboard.
Can you imagine the no. of possibilities here? It's infinite.
None of these ideas would have been possible without the 1000s of interactions we've had with traders since the inception of TradesViz. We will always be grateful for every user's support and feedback!
We have focused a lot on improving the versatility of TradesViz in the last ~6 months. From just being an advanced trading journal to a tool capable of providing the most insightful visualizations, simulating all asset types, and using cutting-edge AI to make trading analytics simpler and easily accessible.
Our next goal is to improve the usability (UI and UX) part of TradesViz and to tweak and update a lot of existing features. While creating new features is hard, improving and modifying them to be more useful and easy to use is even harder in our opinion. We will always strive to improve and be transparent about our updates to our users.
Traders in 2023 and years moving forward should be careful in choosing their choice of trading tools. Far too many tools exist these days which makes decisions harder for new traders. Here are two important attributes we would see in any successful product: consistent improvement and innovation. Both of these feature guarantee that you are getting the most value for your money and that the developers of the product actually care about the users.
There are also too many resources being spent on creating false hype and marketing around trading-related products to lure new traders into expensive subscriptions that provide no value - this seems to be like a playbook for a lot of newer companies from what we have seen ourselves and from the feedback of our users who come from other platforms/competitors. Further proving this point, since our launch, we've yet to see a single competitor provide even 10% of the value TradesViz provides its users. But at least we're glad that some of our features are being used as inspirations in some new features of already existing journaling products.
Trading performance-wise, it has not been an easy year with rising rates and uncertainty about the US economy affecting the markets making it very harsh for new traders. While things have gotten better, the current conditions require a lot more effort than usual from new entrants to the market to be consistent. Our suggestion? Practice & learn + Reduce size. With the addition of TradesViz's simulators and along with our existing options flow, seasonality, and fundamental traders, explore different types of trading methodologies. Become a trader for all seasons. Be adaptable and flexible. Don't rely on just one strategy. Increase the breadth of your toolkit if you want to stay successful in the market for a long time.
We hope to bring you even more useful features to make your trading easier in the coming months. We sincerely wish for your continued support and hope to be your preferred trading journal.
That's it for now! TradesViz's development process is very user-centric so all our inputs and feedback are taken into consideration when implementing every feature! Please let us know if you have any questions, feedback, or feature requests by emailing us at [email protected]!
