The custom dashboard has been one of the biggest features we have launched last year and it was also the *most used* feature of TradesViz. We have continued to add chart and stats widgets to it and the entire list is now at nearly 500 unique widgets.
This is the first time any online journal has had this level of flexibility. With the custom dashboard, you can simply set it as your home page and completely ignore every other tab - just focusing on what you need and what you consider important.
However, it was missing a very important widget: the calendar. We have now added that too. For a trader, the PnL calendar is one of the most visited tabs/pages in their trading journal so it made perfect sense to add this as a widget to the custom dashboard.
You can add this widget by clicking on the "Add widget" button at the top of the custom dashboard and then by clicking on the big plus icon in the empty widget box.
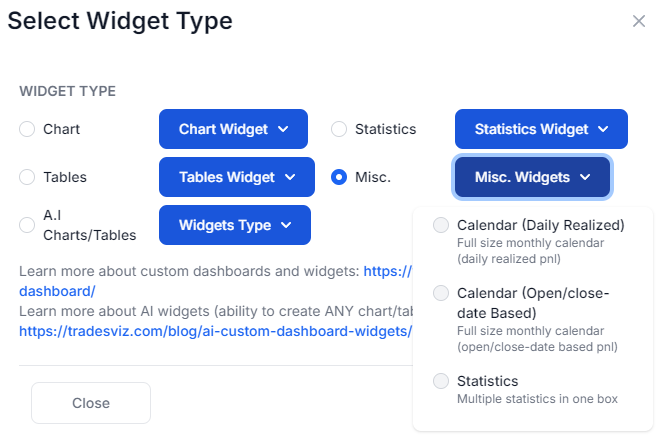
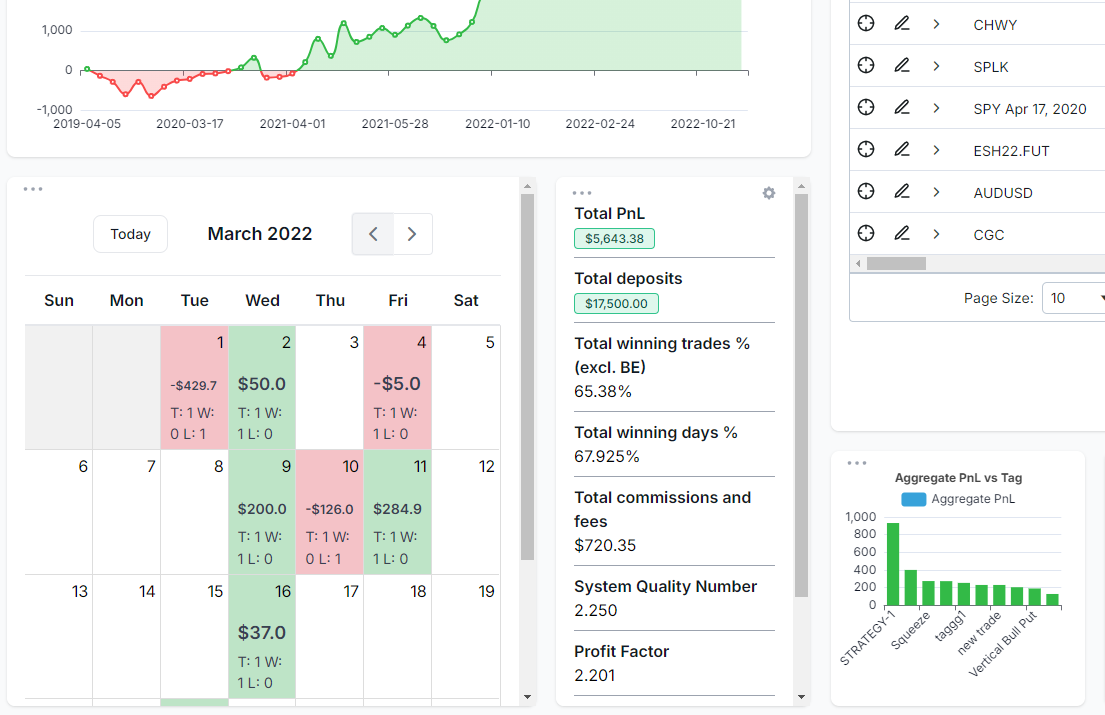
You will see a new dropdown named "Misc. Widgets" with the Calendar entry. Once you add the calendar widget, this is how it will look next to your other widgets:
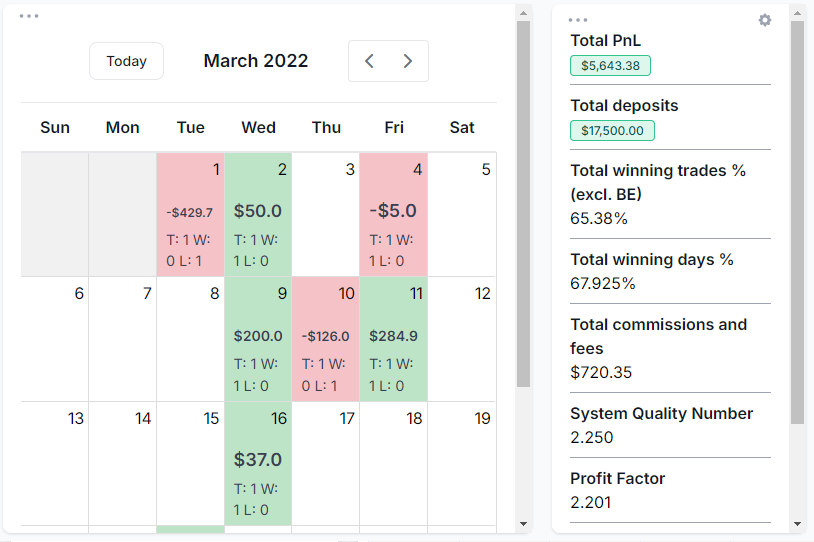
Clicking on the calendar icon near the title will redirect you to the full calendar tab where you can view a larger version + also view the no. of events, tags, comments, calendar summary, and more.
Up next, we also have another widget called the statistics box. This is pretty much a widget born out of feature requests from the UI side. The normal stat box when added too many to a dashboard takes up a lot of space. So we have designed this widget based on user feedback and tried to maximize the usage of the screen space.
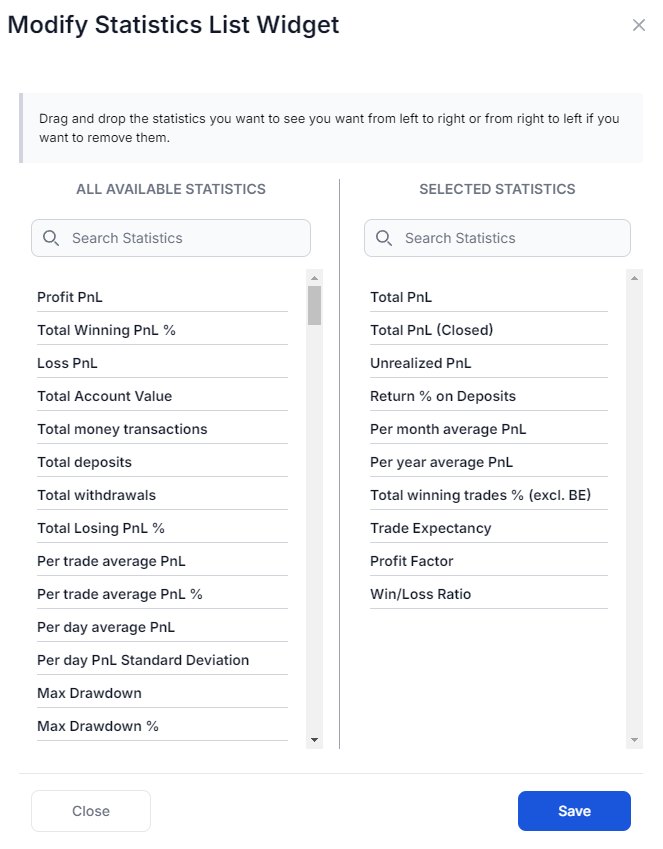
The statistics box allows you to add any number of statistics that are available on TradesViz (200+) and it will be listed in a columnar format like below:
Adding 9 stats in the space of 3 normal stat widgets. That's 3x space spacing and it's even bigger if you are using a larger screen. Clicking on the gear icon near the title will open a popup that will let you customize what stats you want with an intuitive drag-and-drop UX.
With this, we have achieved the following:
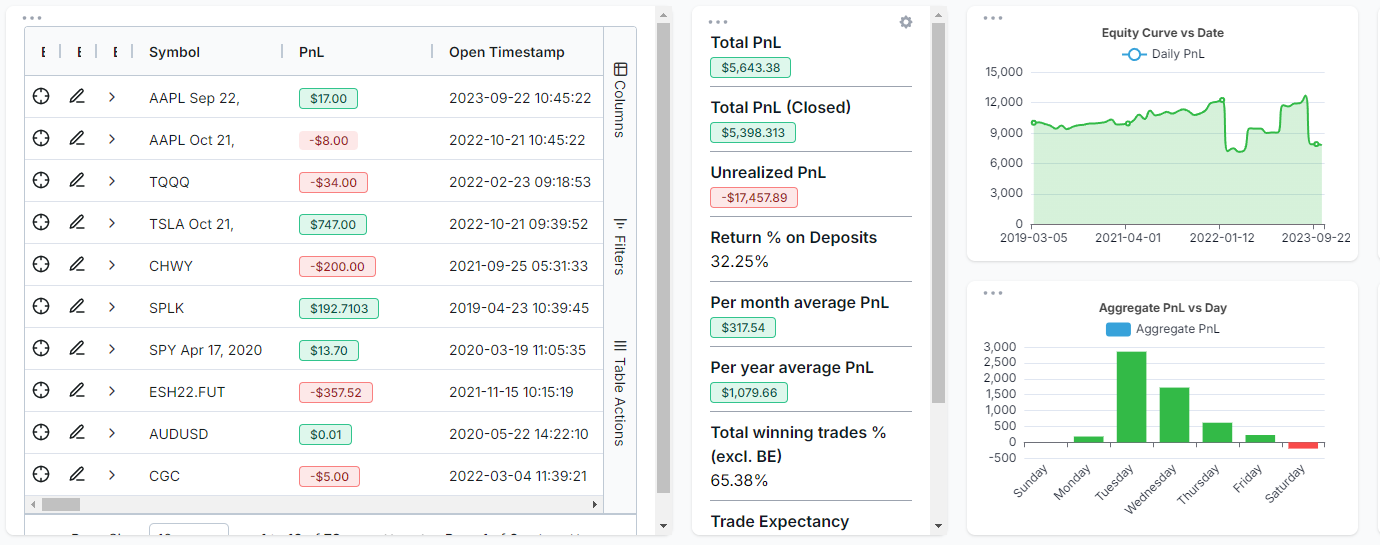
In one dashboard, you can view EVERY basic information a trader needs:
- Overall pnl
- Important Statistics
- Important charts/metrics
- Calendar
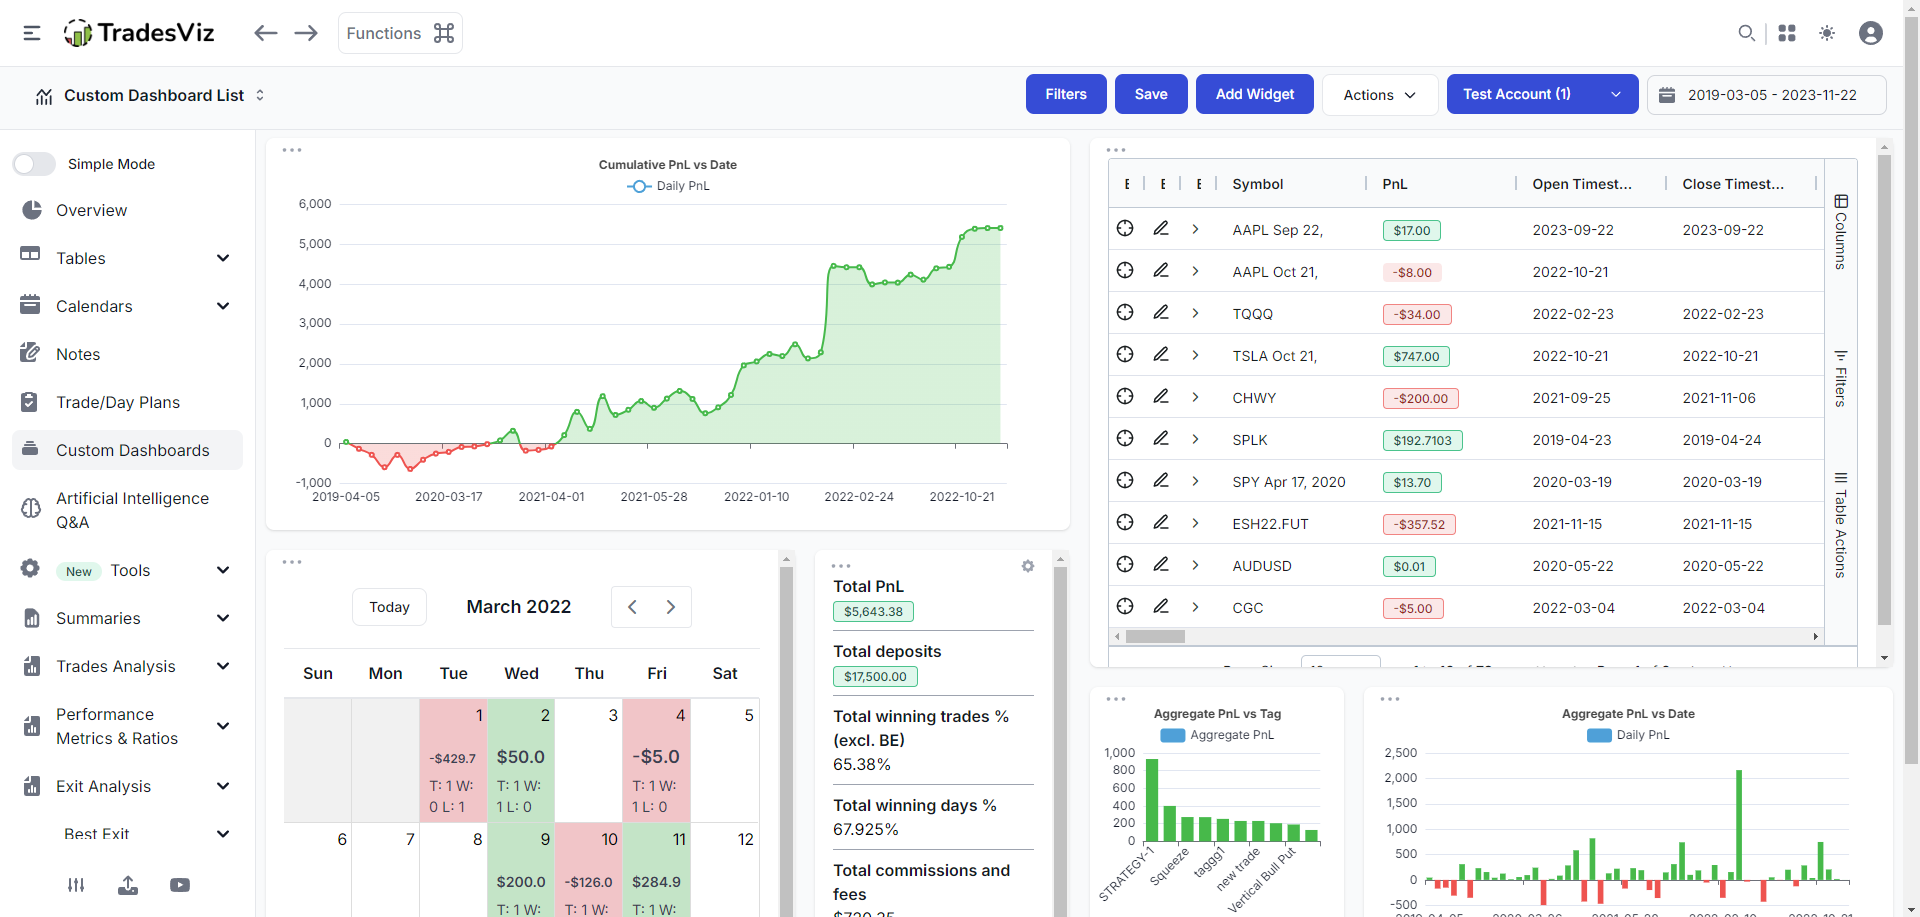
While TradesViz has a dedicated tab for each type of analysis, there is no need for you to explore every tab every time you log into TradesViz - simply set a custom dashboard as your home page via the account settings.
As an example, here is what a simple all-in-one dashboard would look like:
There will be a lot of UI/UX improvements this year as we set our focus on refining a lot of our features to increase the effectiveness of the stats we provide and also to make TradesViz easier than ever to use.
Have any questions? Ideas? Let us know by emailing [email protected]. Most of these features would not exist without your feedback! So please do let us know what you think and how we can make TradesViz a better journal for you.