We launched the custom dashboard feature more than a year ago and since then it has changed the way users interface with trading journals. As every trader is different, the stats and metrics that are important will also change. A trading journal must be flexible enough to adapt to the trader's needs when it comes to charting and statistics.
Since then, we've added new completely new types of widgets and continued to add the charts from other new tabs of TradesViz as chart widgets. This alone has made many TradesViz users completely switch to the custom dashboard as their home page (you can set any custom dashboard you want as your default home page via the account settings!).
However, there are still some requests we were not able to satisfy - i.e. more personalized stats and widgets that are apt to certain trading styles. This required a completely new way of interacting with the data where a user can add any stat or chart or table they want.
This is where the AI query we launched recently comes in to help. Being the first journal to launch a real AI-based data querying feature in the field of trade journaling, we naturally had a lot of feedback on how users wanted to use this feature - one such vision was that of adding the results of AI query as custom widgets - this solves the problem of lack of availability of personalized widgets in custom dashboard and removes the number bound on the no. of widgets in a custom dashboard.
Why is this special or important?
Remember: With the AI query, you can ask any questions you want about your data and you will get charts/tables automatically generated for you. This is as custom or as personalized it can get when it comes to getting insights/data.
Now, with our new custom dashboard feature you can add ANY AI query you have previously generated as a standalone widget to your custom dashboard.
There is no longer any restriction on what you can visualize or have as a widget on your custom dashboard. If it can be charted or put in a tabular format, it will be available as a widget.
How to add AI widgets?
- Visit Custom dashboard
- Click on Add widget
- Click on the Plus button
- Choose any AI widget type
- Once you see the empty widget box, click on the gear icon
- Now select the AI query and the title of the widget
- Click Apply changes
How to add your own custom AI widget?
In the video example above, we use the following AI query:
sort by close date in ascending order
This shows a total pnl chart that you would see on the daily statistics page - i.e. the most commonly viewed chart in any trading journal as it shows your total pnl growth over a period of time.
But note here that we have customized even that chart by asking the system to show only the last 100 trading days in 2022. This shows you the level of customization you can do that was previously impossible even on TradesViz.
In short, you need to first execute an AI query and see the results in the AI query tab. Once you do that, you can use that query in the custom widget in the form of statistics or a chart, or a table widget.
Here is a from-scratch example of the creation of a weekday vs pnl widget which uses a query from our advanced AI query guide:
Similarly, you can also create single-datapoint widgets which can be helpful if you want to create custom queries or formulas that do not exist anywhere. As an example, here's a query that outputs a profit factor:
let total losing gross pnl in trading account Test Account be a2
show a1,a2, absolute of a1/a2
In this case, even if the result has multiple rows, TradesViz automatically only chooses the first column of the first row to display as a widget.
Customization possibilities
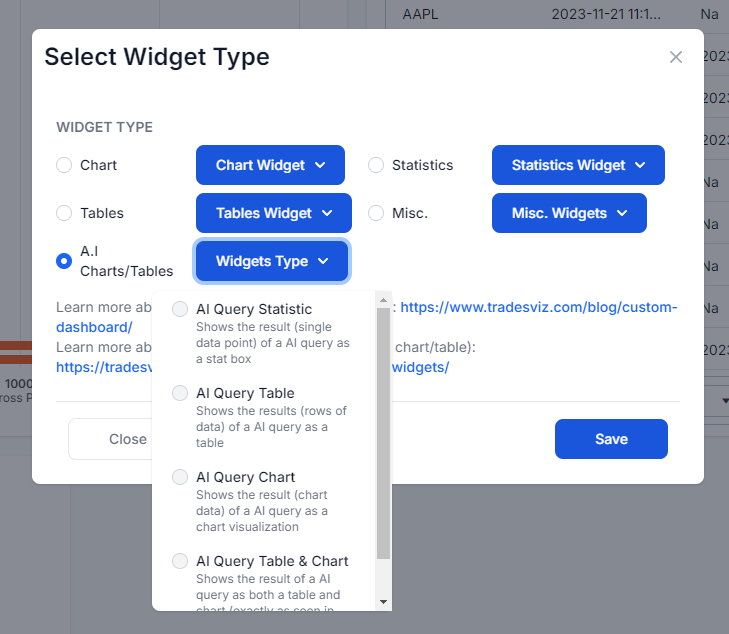
The 4 types of AI widgets are:
- AI Statistic widget: Useful for showing single-number statistics (uses the first column of the first row if the AI query returns more than 1 data point)
- AI Table widget: Useful for displaying tabular data
- AI Chart widget: Useful for displaying chart data (any chart type can be selected after generating the chart)
- AI Table+Chart widget: Useful for displaying both chart + table (cross filtering + charting possible)
In these widgets, you can further customize the appearance of the chart in the AI Chart and AI Table+Chart widgets by hovering over the chart and clicking on the expand button on the right side.
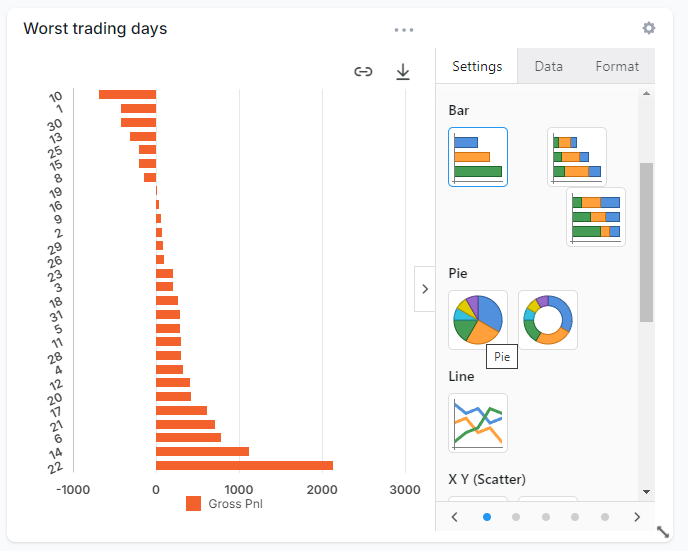
Certain types of data are better visualized using certain chart types. All of this is saved as part of your custom dashboard settings.
Summary
In short, this feature brings Excel-level customization to TradesViz. There is no solution online that has even a fraction of the level of advancements and customizability of TradesViz when it comes to trade journaling and statistics - this feature only elevates that to the next level.
This feature is available for all Pro/Platinum users. AI query or chart once generated does not consume the daily AI credits - so in effect, you can create an unlimited no. of widgets over time and make TradesViz trading journal truly your own trading journal designed for you by you using AI widgets.
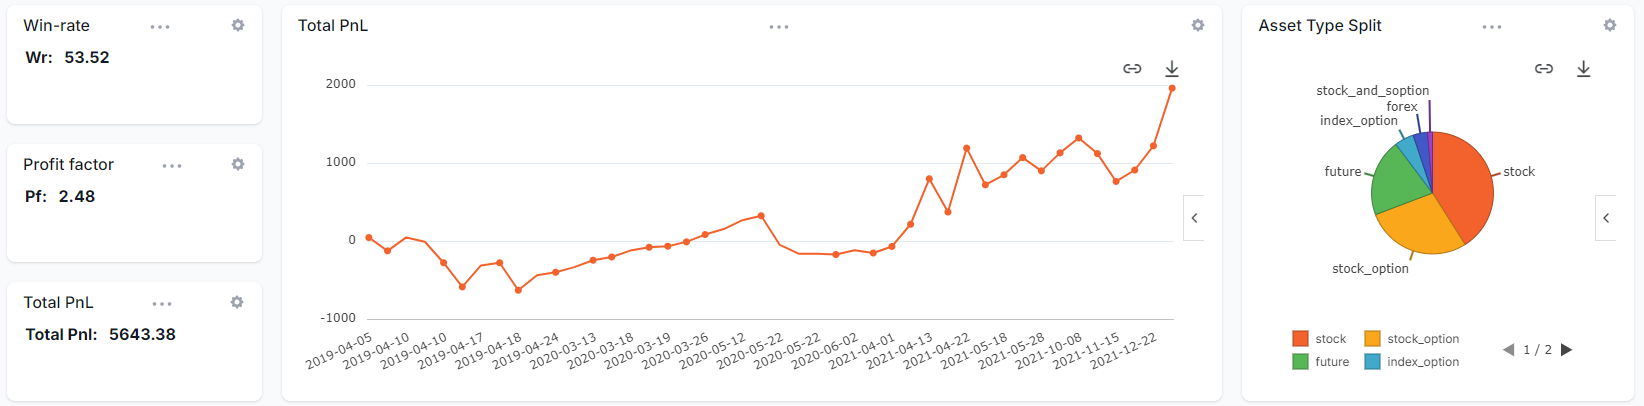
Here's an example dashboard that we created to show various examples of the AI widgets:
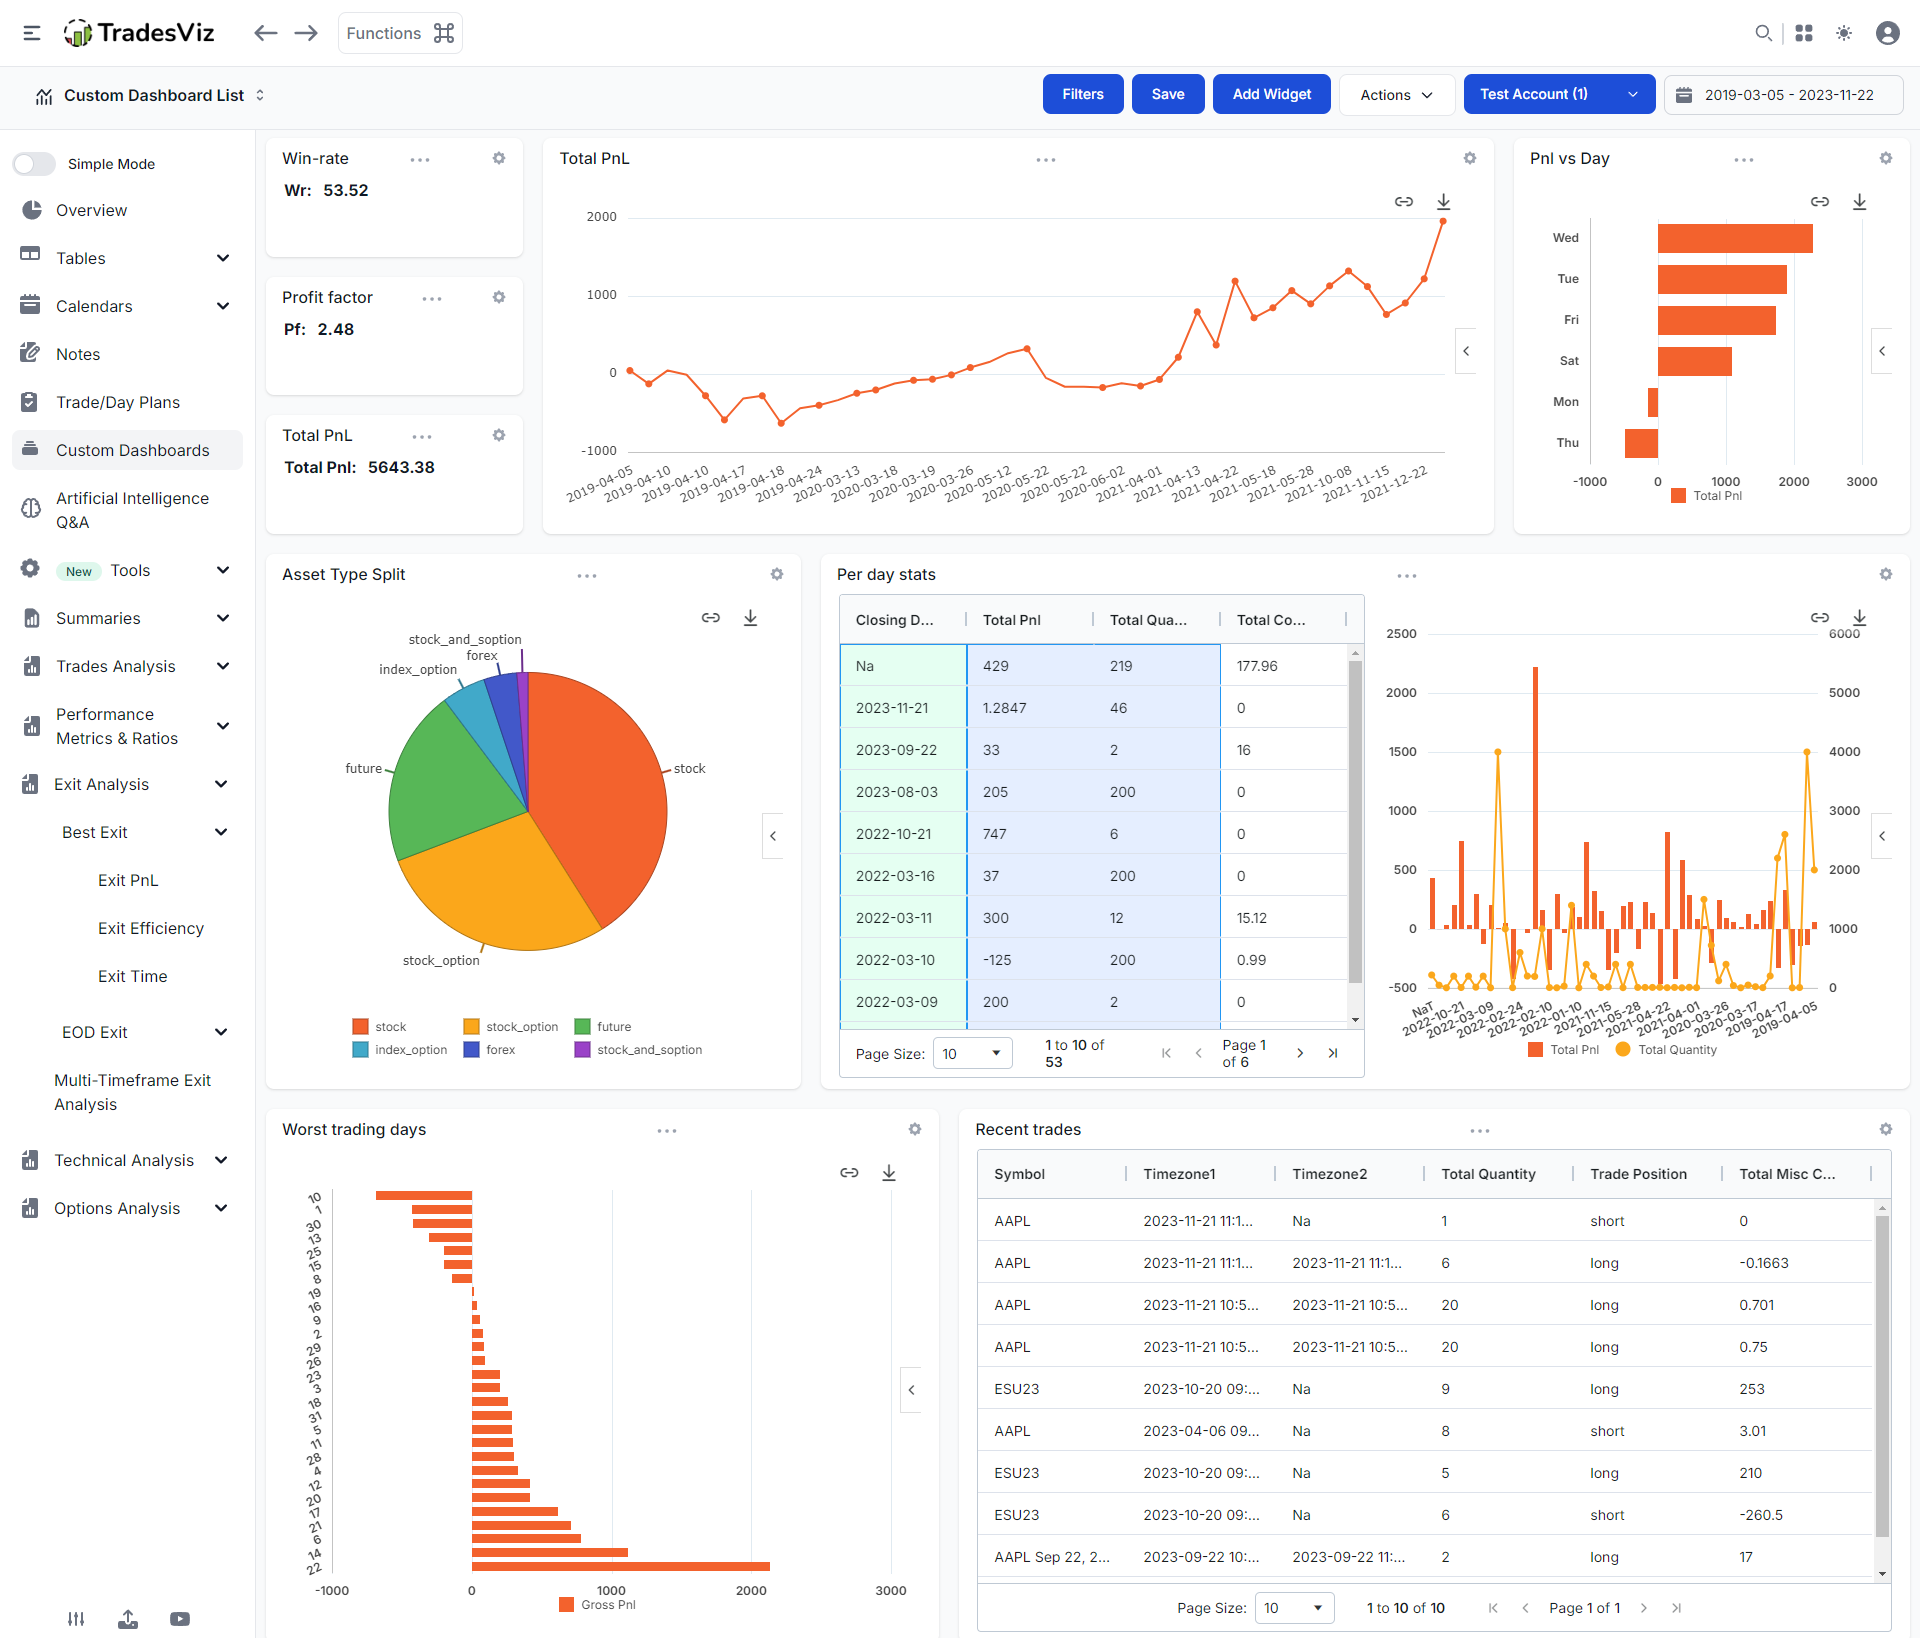
From top to bottom, left to right, below are the AI queries used to generate the respective widgets:
Note: Make sure to edit these queries to use your own trading account names! In these examples, these queries were run for a trading account with the name "Test Account". You can either choose to enter a trading account name to get stats specific to it or not mention any name to get stats from all of your trading accounts.
Win-rate (AI Statistic widget):
show WR*100 rounded to 2 decimal places
Profit factor (AI Statistic widget):
let total losing gross pnl in trading account Test Account be a2
show absolute of a1/a2 as PF
round to 2 decimals
Total PnL (AI Statistic widget):
Total PnL (AI Chart widget):
PnL vs Day (AI Chart widget):
show day of week as 3 letter ISO name
Asset type split (AI Chart widget):
Per day stats (AI Table+Chart widget):
Worst trading days (AI Chart widget):
show for all days of the month
Recent trades (AI Table widget):
show only symbol, open date, close date, quantity, side, pnl and commissions + fees as total misc cost
We suggest using these queries as a starting point to create basic dashboards. Once you are used to the AI query style, you can start using more advanced AI queries to create a trading dashboard that is a perfect fit for your type of trading.
Need help with creating a widget/query? contact us at [email protected]!
With the feature, we hope to give traders of all experience levels a way to fully customize the dashboard of the TradesViz journal thus allowing your journal to grow alongside your trading experience and history!
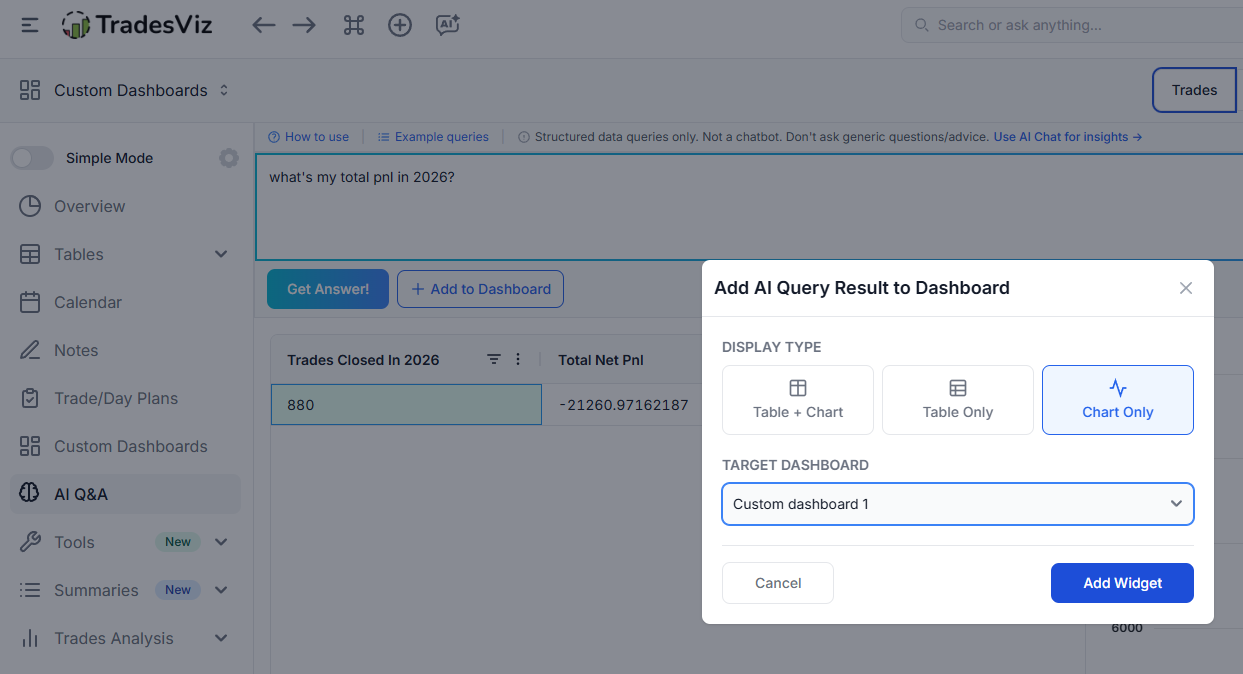
April 2026 Update:
You can now directly add your AI query result to your custom dashboard!