Please note: The following guide is for TradesViz 1.0 (old) which is no longer supported.
We have migrated/upgraded to TradesViz v2.0 which is superior in UI/UX and features.
Please visit this guide to learn more about the updated Trade Explore tab in TradesViz v2.0: https://www.tradesviz.com/blog/tab-explore-day/
Note: A lot of updates have been made to this tab over the last 2 years!
This is one the 3 "explore"-based tabs (the other 2 being day explore and chart explore) in TradesViz. An explore tab basically means the tab shows specific information about either a trade or a group of trades. Explore trade tab - as the name implies is a tab that has all the information only about a single trade.
Accessing trade view
One of the main differences between the explore tabs (day explore, trade explore and chart explore) is that these are dynamic tabs that only appear on the sidebar if an exploration selection is made. So, to access this trade tab view, there is only one interface which is by clicking on the target icons ( ) in the trade-based tables. This icon will be present on pretty much every page where there is a table of trades.
Overview
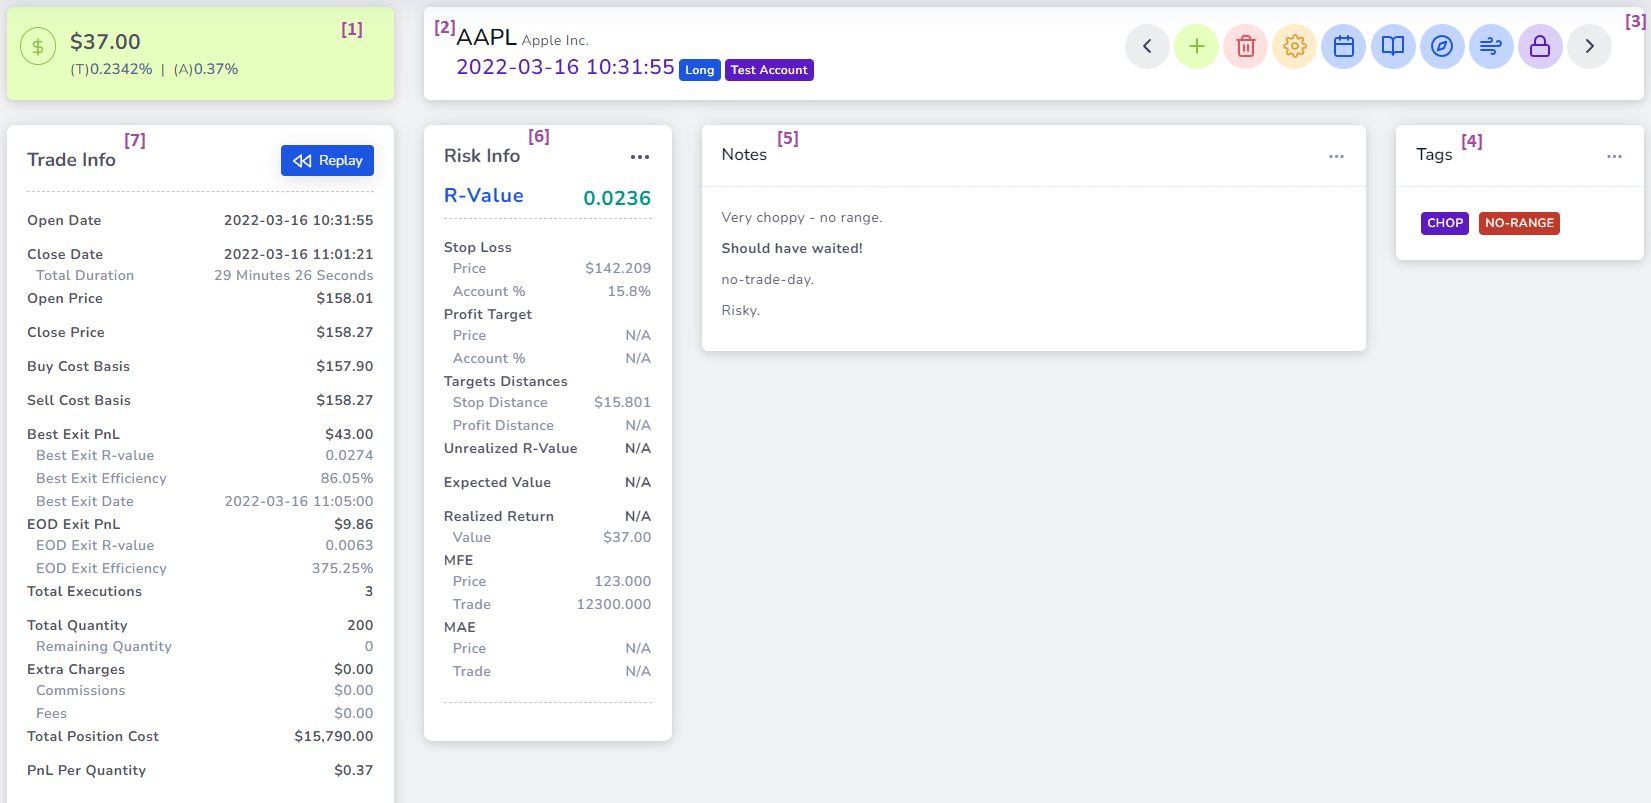
We have marked 7 different components with numbers in the above image. Most trades must be familiar with these numbers and the generic layout of trade info. We'll explore these 7 components in short:
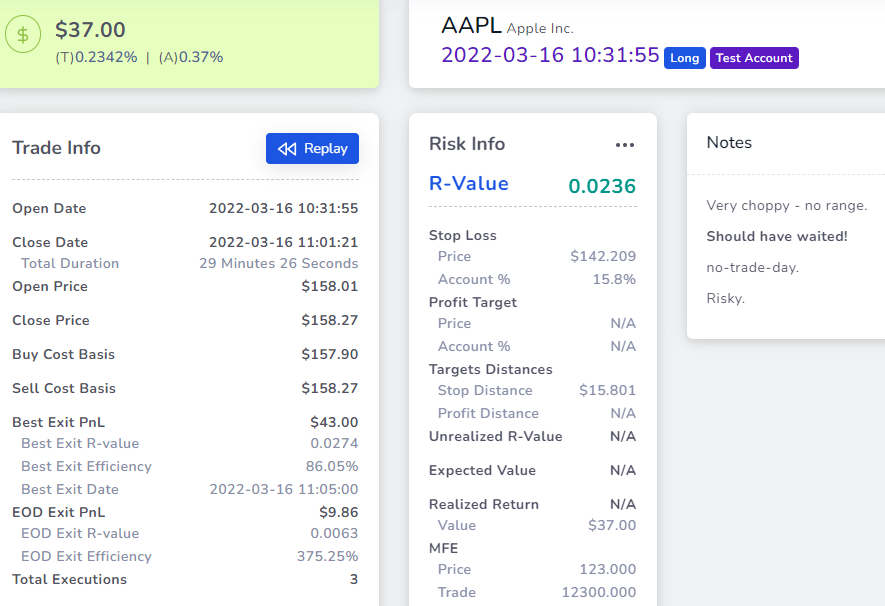
- Shows the PnL (net or gross depending on the global toggle setting) along with the percentage of the return. The number near 'T' is the trade % return - i.e return on investment of trade, and the number near 'A' is the account % return - i.e, return relative to the total deposits made in the account.
- Shows the Symbol's ticker and full name next to it. The line below has 4 pieces of information - Date, position (long/short), trade status ("Open" tag will be visible if the trade still has open positions), and the Trading account to which the trade belongs. For this example, this trade belongs to a Trading account named "Test Account".
- The trade explore buttons are explained in detail further down in this post. From left to right, the buttons are: Move left (previous trade), Add execution, Delete trade, Trade setting (notes, tags, stop losses, etc.,), Go to day, view fundamental info, view options flow info, view seasonality info, and sharing settings.
- Tags container - you will be able to add tags using the trade settings popup or by clicking on the 3 dots icon at the top right corner.
- Notes container - you will be able to add rich text notes using the trade settings popup or by clicking on the 3 dots icon at the top right corner.
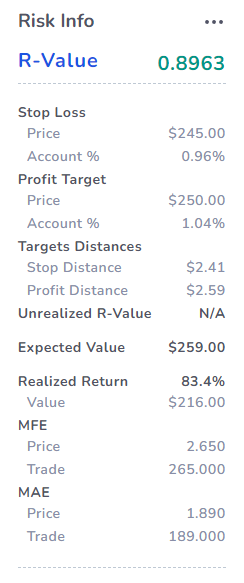
- Risk information - automatically populated if stop loss/profit targets are mentioned.
- Trade info - All the basic stats of the trade.
Executions table and bulk operations
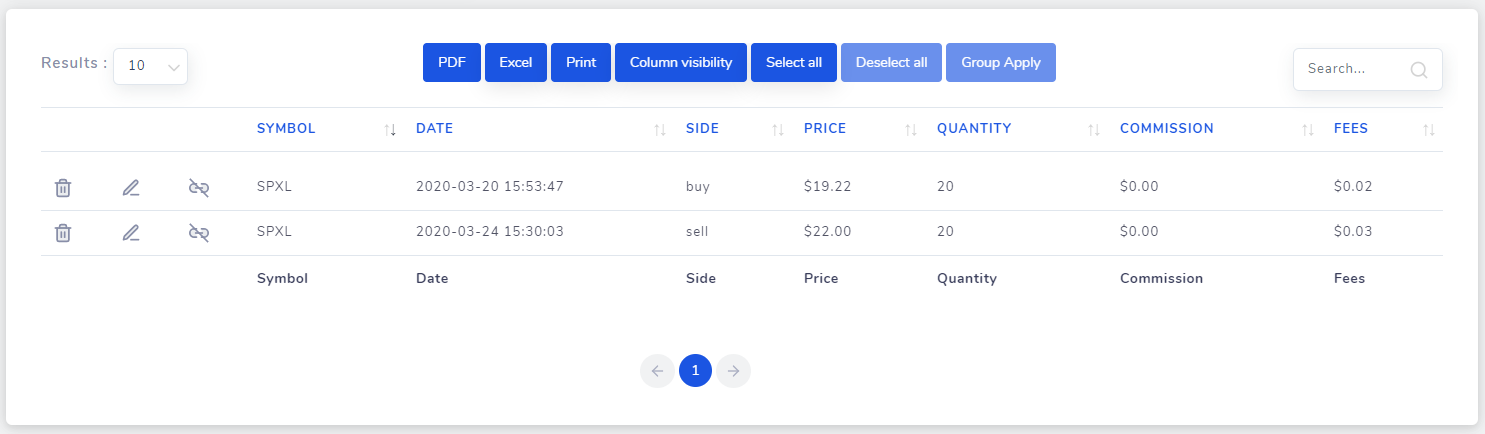
This table is a bit more simplified compared to the tables discussed in the tables tab blog post. While the table buttons (PDF, Excel, etc.,) remain the same, the group apply function is very simple and has only a few options. Other than that, the row buttons are also simple to understand. From left to right, the buttons are: Delete execution, Edit execution, and Unlink execution. The first 2 functions are understood as all they do is allow you to delete and edit the execution's fields like date, side, price, etc., but the 3rd function is a bit different. You can use unlink if you want to separate execution from a trade. If you unlink an execution, it will be separated into a different trade with just that unlinked execution alone. The opposite - merging of trades and executions can also be done. Merging of trades is explored in the bulk trades operations blog post here. The unlink function can be useful if you think a trade is supposed to be 2 different trades, but the auto-grouping system of TradesViz grouped them into one - or if don't want executions of different asset types to be in the same trade (ex: AAPL stock and AAPL options), you can easily unlink those executions.
While we are on the topic of executions, it would be useful to also learn about the group apply functionalities available for execution table rows.
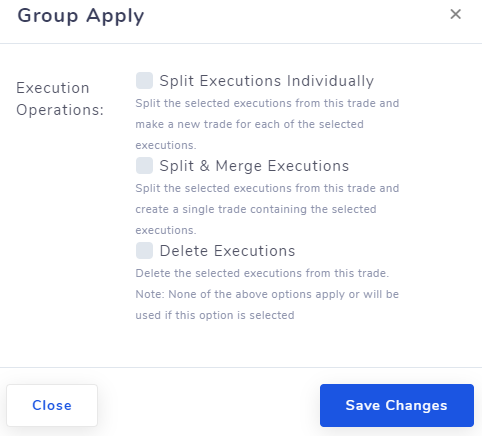
The image above shows the 3 available group apply functions. When you select more than 1 execution by CTRL- or SHIFT- clicking rows in the executions table, you will be able to click on the "Group Apply" button on the top of the table. 2 of the 3 Group apply options are split/un-link related options. Note that we use split and un-link interchangeably as they mean the same here - isolating one or more executions into a separate entity.
Splitting executions individually split/unlinks each selected execution into a trade of its own. For example, If your trading account has 1 trade of SPXL and in that, you have 5 executions. If you select 3 executions and choose the split executions individually option, your account will now have 4 trades of SPXL - one with 2 (5-3) executions and 3 others with 1 execution each. Once again, this can be used if you think there is a mistake in the grouping or if you do not want executions of different assets to be combined. There are also other uses like splitting a trade and then adding more executions to it later on etc.,
Splitting and merging executions does the split operation, but unlike the previous option, it will combine all the selected executions into one. So, using the same example above, if we select 3 executions and choose this option, as a result, we will have a total of 2 SPXL trades one with 2 (5-3) executions and one with 3 executions.
Adding user content
Notes, Tags, and Stop-loss
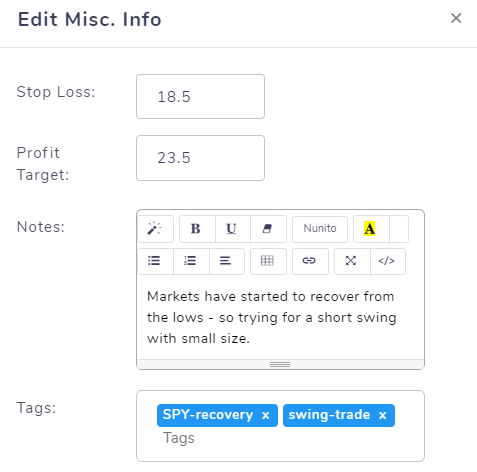
3 types of text-based user content that can be added are notes, tags, and stop-losses. All these can be edited in one popup window which will appear if you click on the trade settings (yellow-gear) button at the top right corner. Notes are fully rich-text editable - you can even insert images here. Stop loss and profit target values are needed for the risk calculation stats which were shown in the previous section.
Images
Apart from inserting images in the rich-text area in the notes section, you can also add images separately to a trade. There are 2 perks to adding images this way. First, you can insert large images and view them with proper zoom as there is a separate image viewer for the images section (images in the rich text area cannot be zoomed). The next perk is, you can actually edit the image. No more pulling up MS paint or other tools to annotate your trades/screenshots! Just upload your image and edit it online with our full-fledged online editor!
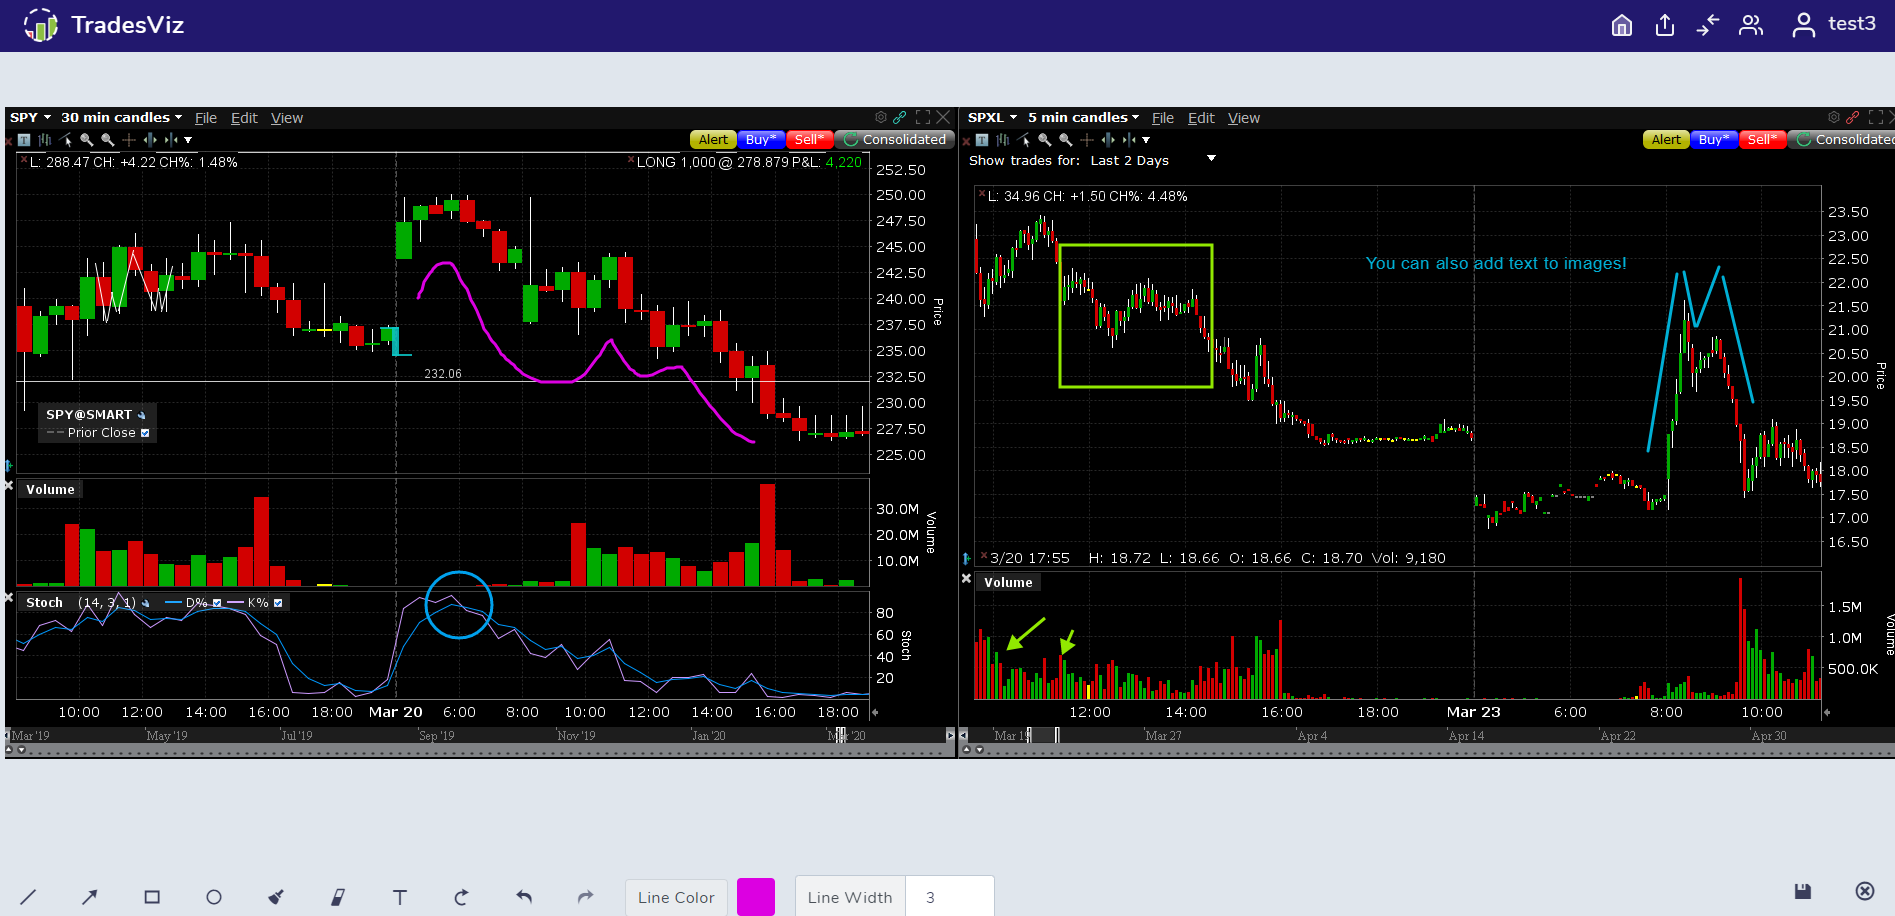
To edit an image, open the image viewer by clicking on the image, and then on the top right corner, click on the pencil icon. This will open the image editor window on the same page. After finishing editing, click on the same button in the bottom right corner to go back to the trade explore view. Your edited image will reload automatically.
Symbol/Stock charts - explored in a dedicated blog post here.
Trade explore buttons
- Add execution - Open up a popup with all the fields to add a new execution to the current trade
- Delete trade - Deletes the trade after asking for the user's confirmation. Note: The deletion of trade or executions is irreversible.
- Go to trading day - Redirects to the trading day explore view - explored in a separate blog post here.
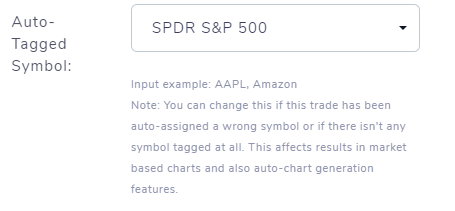
- Editing settings (explained above under User content > Notes, Tags) - Popup with fields to enter the notes, and tags and correct the auto-tagged symbol of the trade if incorrect or for any other reason. Every trade imported to TradesViz gets tagged with the actual symbol data in our database. If this tagging operation is inaccurate, users can use this popup to fix this or change this to any other symbol they wish. This affects 2 things: generating charts from trade (charts are explored here) and the sector-based charts under chart analysis. Our system is not able to auto-tag a symbol, then charts for trades cannot be generated (however, remember that any symbol chart for any trade or trading day can be created by using the custom chart option). Another use for this is to tag trades with similar symbols if the trade's symbol is not available. For example, you can tag MES trades with ES symbol if MES is not available in the symbol list since their charts are pretty much the same. In the example below, SPY is shown to be selected from the list of symbols available.
- Sharing settings - feature has a dedicated blog post here that explains the sharing of trades, trading days, and even your trading accounts.
Similar trades table
The last section of the trade explore view is the similar trades table which shows the 10 trades that are most similar to the current trade with respect to either PnL, volume, total executions, duration, and open date. By default, they are sorted in the order of the most similar to the least similar. This is very useful to quickly jump to trades that you would like to view and possibly apply tags or comments to similar trades. Think of this as something like "You might like these..." suggestions that you see in a lot of content-based websites - except, here we are just showing your own trades to you saying they are similar because it might be worth noting your own performance in those similar trades and may even learn a thing or two from it.
Update:
Risk statistics now include price MAE and MFE. More statistics are being added - do let us know if you need anything specific!
That's all the currently available features for the trade explore. We suggest learning more about the other 2 explore views - day explore and chart explore to get a complete idea about the dataflow in TradesViz. As always, if you have any questions or suggestions, send us an email at [email protected] or send us a message via the contact form here.