Please note: The following guide is for TradesViz 1.0 (old) which is no longer supported.
We have migrated/upgraded to TradesViz v2.0 which is superior in UI/UX and features.
Please visit this guide to learn more about new and advanced grids and tables in TradesViz v2.0: https://www.tradesviz.com/blog/grid-complete-guide/
The most common format for displaying trades is the tabular format. TradesViz has 3 different types of table formats for viewing trades in 3 different contexts. The main difference between each of the tables is the data they display. Other than that, can you apply and use the same features on all the 3 tables. We will first explore the 3 types of tables and their significances and then move on to the features that can be used in all 3 tables.
Trades table
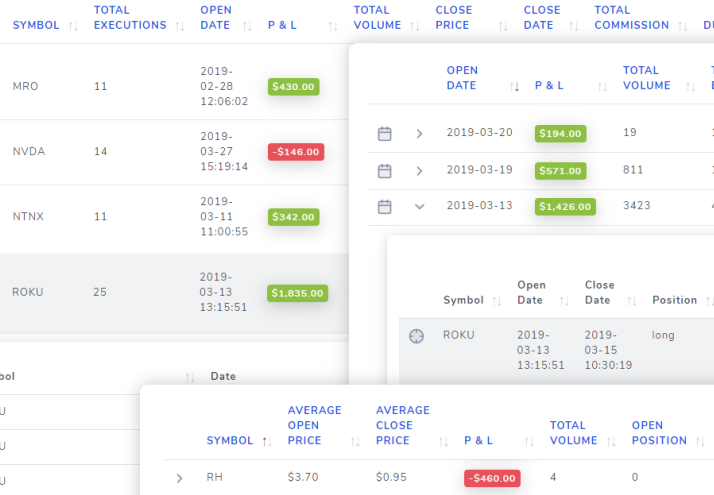
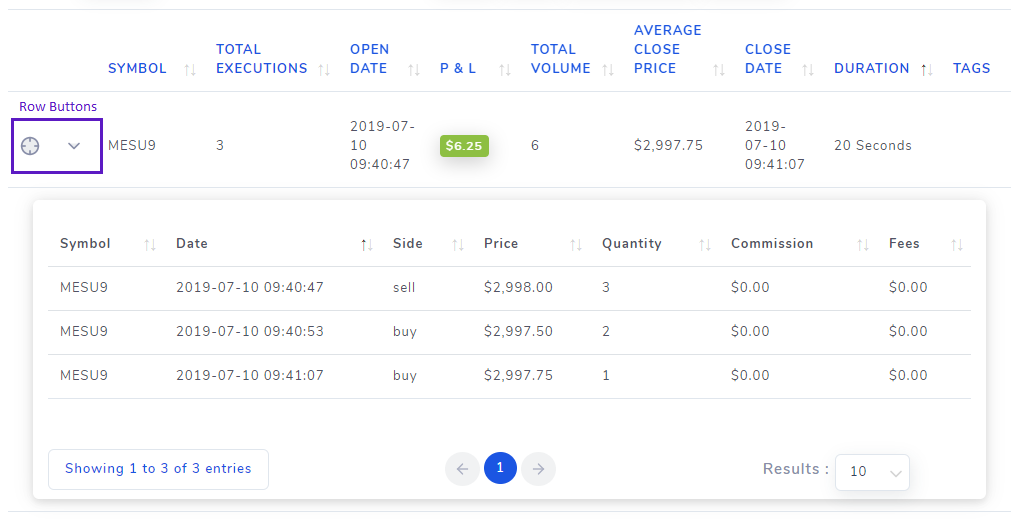
The simplest of the 3 and the one that pretty much every trader would have seen - a table listing all your trades - one trade in one row. We didn't just stop there though. In TradesViz, you can not only view the trade's statistics, but you can also view the individual executions of each trade in the same view, in the same place! - using the "Expand" row button.
This expanding row feature is common to all 3 tables, but the data displayed depends on the table. Trades and their executions - this is pretty much all you need to know about this table view - the simplest and the most commonly used one. Visibility of columns in all 3 tables can be toggled using one of the table buttons (explained at the end of this post). The columns available for this table are:
Row buttons (outer row): Explore the trade button, Expand trade (row) button
Columns: Symbol, Total executions, Open date, Close date, Open position, P & L, Total volume, Average close price, Average open price, Return %, Total fees, Total Commission, Duration, Tags, Notes, etc.,
The column list is quite big here (~40+ columns). You can view the full list here.
Finally, the leftmost button of every row is the "Explore" button. Clicking on it redirects you to the trade explore tab (explored in another blog post) the content in the main area with the details of the trade. You can switch back to the table view by clicking on the Trades tab in the sidebar. Trade explore tab is the "trade" page of TraesViz where you will be able to view the trades details, charts, and executions.
Symbol grouped table
Often, it's quite interesting to know how your trading performance varies symbol-by-symbol. There are quite a few ways this metric is visualized in TradesViz (treemaps, bar charts) but the only way to visualize all the data volume, commission, total trade count, etc., - not just PnL, is by using a table - where each row summarizes all the trades you have placed in a particular symbol. All the stats of the main/outer row is just the sum of the inner rows. For example, in the previous section, we viewed an example of a single MES trade. With the symbol-grouped view, however, you can view all your MES trades in a single section.
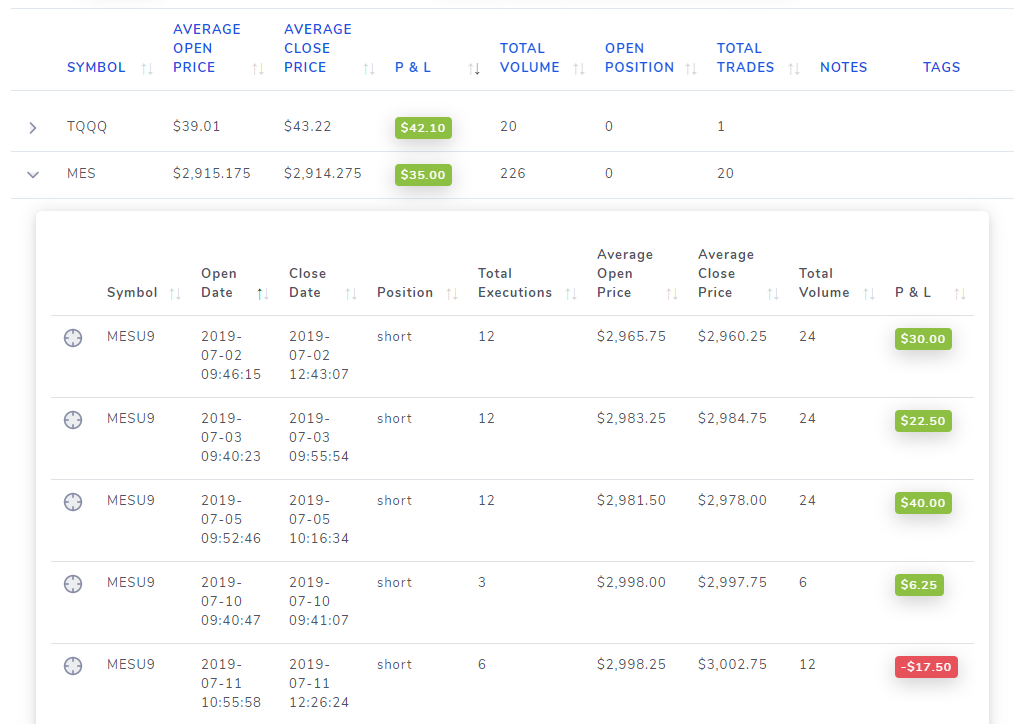
In the trade view, we had the main/outer row as the trade and the child/inner rows as the executions whereas, in the group by symbol table - we are moving one level up. The main/outer row shows the cumulative stats of all the trades made under a particular symbol and the inner/child rows show the individual trades. Note that you cannot view executions in this view, however, the "Explore" button is still present in this row (as it was in the trades table view) so it's very easy to go to the trade explore the view from this symbols grouped view also. "Grouping" here means that if a bunch of trades all have the same underlying they will be put under the same main/outer row.
A caveat here is that when you have trades of different asset types of the same underlying, they will all be grouped under the same underlying. For example, observe the table below:
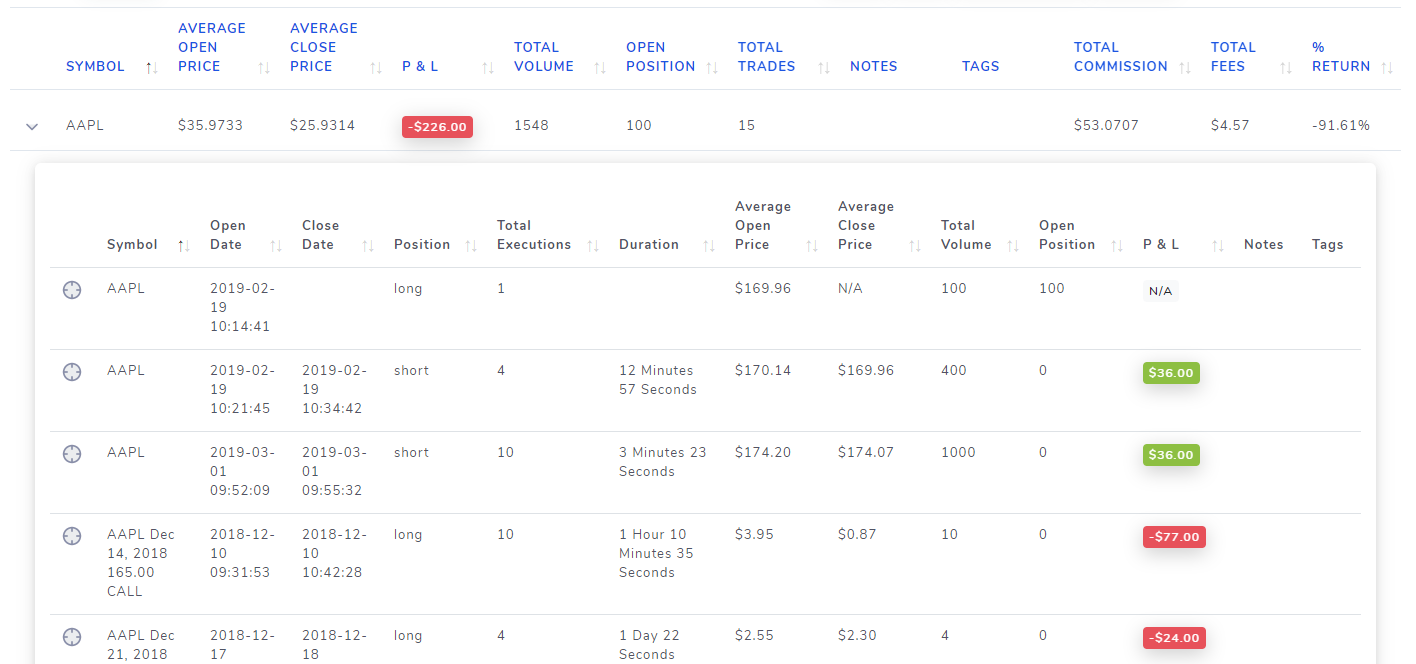
Here, AAPL being underlying - there are trades in both stocks and options. We are still experimenting with small nuances like these - as to whether this should be asset-type separated or purely underlying-based grouped - let us know your comments and feedback by email to us at [email protected]. We are constantly adding more flexibility and features to accommodate every trader's preferences and requests.
Row Buttons (outer row): Expand (row) button
Row Buttons (inner row): Explore trade button
Columns: Symbol, Total executions, Open position, P & L, Total volume, Average close price, Average open price, Return %, Total fees, Total Commission, Tags, Notes
Day grouped table
Here, we shift the focus towards trading days. The outer rows are each trading days and the inner rows are the trades and/or executions made on that date.
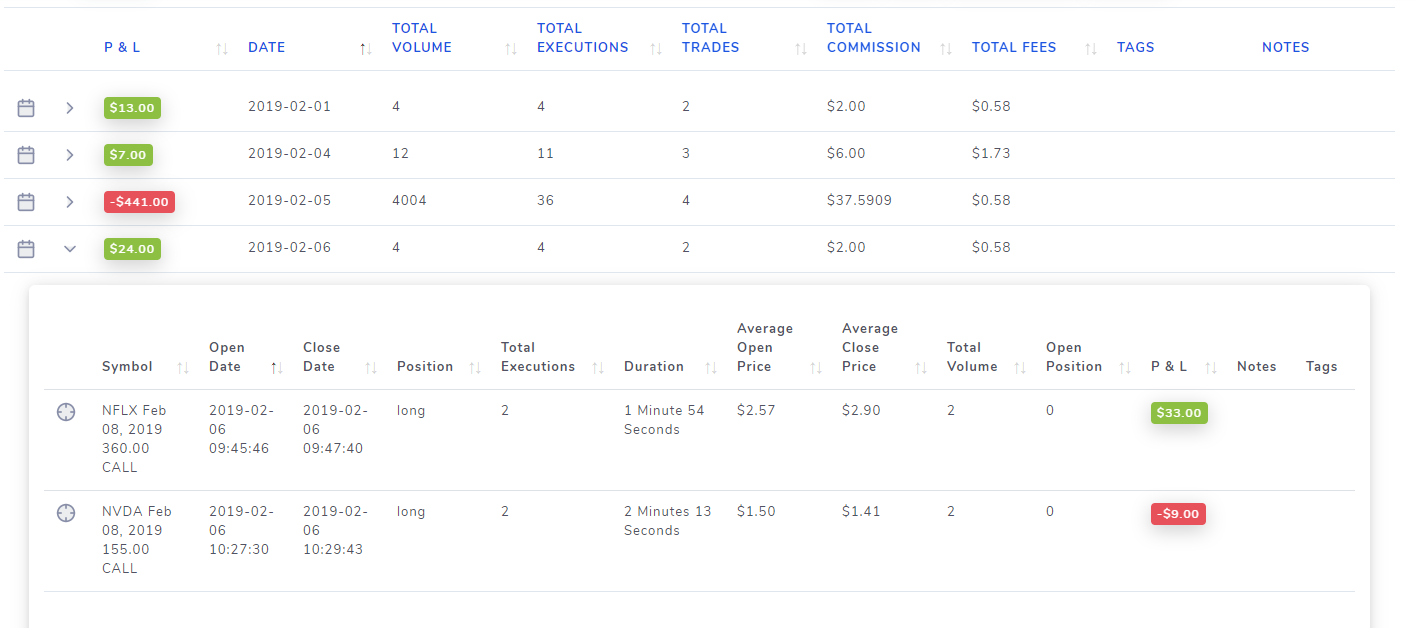
Note that the date column is just "date" - not open date or close date. Meaning, on every single day an execution was made - whether it was adding, removing to a position, an entry will be present with the day, and the other stats filled in. On days where positions are just adjusted, unrealized PnL will automatically be calculated and be used for the P & L column.
A new row button for redirecting to the day view is also present in all the rows of the day view table. Similar to the symbol grouped table view explored in the previous section since the inner rows are all trades, and explore trade row button is also present here.
Row Buttons (outer row): Explore day button, Expand (row) button
Columns : P & L, Date, Total Volume, Total Executions, Total Trades, Total fees, Total Commission, Tags, Notes
Executions table (Added on update: 27th Mar 2022)
This is a granular version of the trades table. Instead of each row being an individual trade (summarized from a group of executions), here, you will see that each row corresponds to an individual execution. This is very useful if you want to know what exact executions were imported recently or if you want to look for a specific execution and then find the trade to which that execution belongs to.
Row Buttons (outer row): Edit trade (edit the attributes of the trade to which this execution belongs)
Row Buttons (inner row): Explore trade button (go the trade to which this execution belongs)
Columns: Symbol, Date, Price, Quantity, Side, Realized PnL, Commission, Fees, Trading Account, Asset Type
Common table features
Searching content in tables
Searchable tables usually only have static text searches for a few columns. But in TradesViz, you can use logical operators like AND, OR to enhance your search and construct any type of search query in the table view itself - for all columns! Let's see an example of how this can be useful.
Suppose you want to search for trades that have trade (volume lesser than 5000) and (price between 10 and 100) and (PnL greater than 150). It's a common scenario where one would like to know how successful we are in trading mid-priced stocks with relatively high trading volume. In most traditional platforms, this would either require a completely separate window where the user would have filters and then apply those filters. But in TradesViz, all you have to do is:
- Select the view you want - since we just want to look at individual trades, let's choose the trades view table
- Scroll down to the bottom of the table and look for the text input box that's aligned with these columns: Total volume, Open price, and P & L.
- Enter these search "queries" in those input boxes like this:
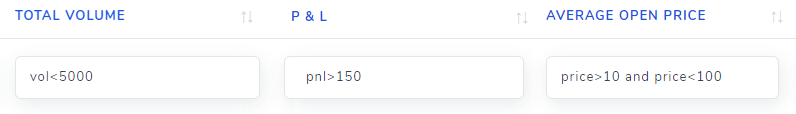
- That's it - look at the table now!
The table automatically refreshes every time you type in a valid query in the text boxes. Now, without leaving the window, without applying any fancy global filters and in the same tables view itself, we have executed a fairly specific search query and easily filtered the trades. Note that this search feature also works for tags, notes, symbols, etc.,
Another example is if you want to search for a symbol or filter for all symbols starting with AAP, all you have to do is append a '%' character to the end of your query. "AAP%" searches for all stocks beginning with the name "AAP". Searching for dates like "2020-02" also works! If you want to search for multiple tags, just enter the tags separated by a comma: "tag1, tag2" etc., Go ahead and try different search queries - Searching for trades really can't get any easier than this! The possibilities and combinations you can try here are limitless!
Managing trades - Group operations
We have seen how to filter for a very specific set of trades very easily using the column filter text inputs in the previous section. Using the "Group Apply" you can do bulk operations very easily on trades. Since this feature is has a lot of options, we have written a dedicated blog post for this. Please visit the link here to learn more about bulk trade operations.
Table buttons
For the user's convenience, we have added 3 ways to export the trades on the current page in any of the 3 tables by just a click of a button.

PDF, Excel, and printing the current table page are the 3 ways to export trades from within the dashboard. If you want to export all the trades in bulk in CSV format, please take a look at the import/export management blog post here.
The column visibility button is a dropdown that lists all the columns of the table - it can be used for toggling the visibility of columns that you think you don't need. Note that, columns can also be rearranged by dragging the column name cells in any order you want! By default, not all columns are visible even if they are all toggled on in the Column visibility dropdown. The reason is due to the auto-hiding of columns. Viewing all 15+ columns can be very cluttered, so the columns automatically hide/go out of view when the window size increases and come into view when the window is big again - this does not apply if the column is explicitly hidden via the Column visibility dropdown.
Updates through 2022:
- 3 more buttons were added: Toggle horizontal scrolling, toggle compact mode, and hide buttons
- The horizontal and compact mode changes the visuals of the table to better suit your preference
- Another button called "Toggle pin left column" will be made visible when horizontal scrolling is toggled to enable pinning of the first (leftmost) column
- The day view table has been made up to 5x faster
- Save state button to save the state of the table (if profile/cloud-based save settings is enabled in account settings)
- A lot more columns were added (Reference: https://www.tradesviz.com/blog/general-statistics-reference/)
That's it for all the features and the cool stuff you can do with tables in TradesViz. If you have any questions or feedback regarding features, please write to us here or send us an email at [email protected].