This guide covers every statistic, score and table column you will find inside the TradesViz dashboard. It is Part 2 of our reference series. Part 1 covers all the charts and where to find them. Here we focus on what each number means: the PnL stats, the performance ratios, and the trades table columns.
We last updated this guide for the 2026 dashboard. If you used TradesViz back in 2021, a lot has changed, so we rewrote it to match the current UI.
How far TradesViz has come: 2021 to 2026
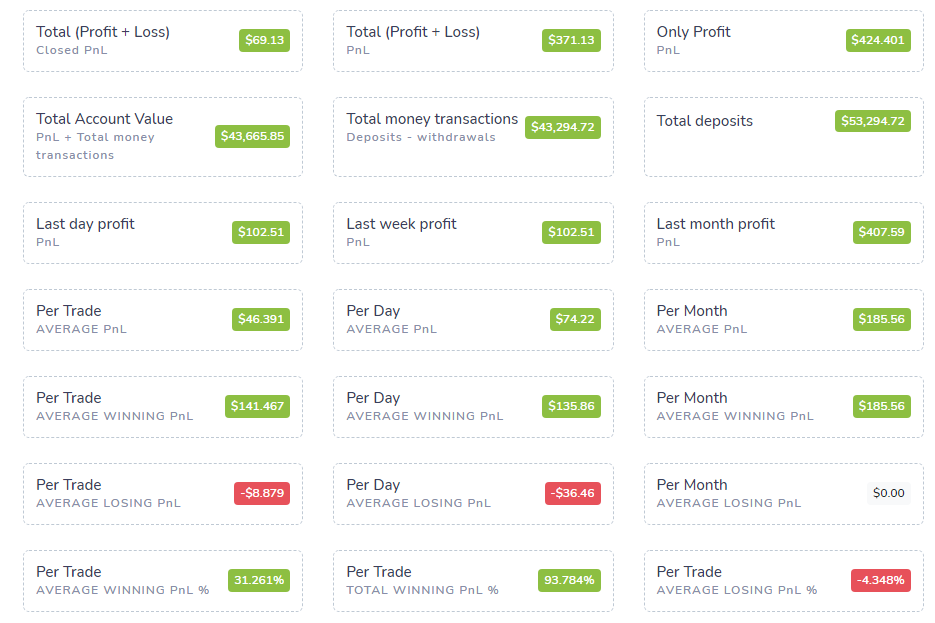
When we wrote the first version of this reference in 2021, the Overall Statistics tab had a few dozen stats spread across rigid sub-tabs, and the trades table had roughly 25 columns. As of 2026:
- 600+ statistics across the dashboard. The Overall Statistics tab alone has 150+ individual PnL, risk and activity metrics.
- 80+ trades table columns, including full MFE/MAE, multi-timeframe exit analysis, options Greeks, running-PnL and cost-basis fields.
- A full set of performance ratios (Sharpe, Sortino, Calmar, Omega, Ulcer Performance Index, Recovery Factor, Tail Ratio and CAGR), each with its own glossary entry.
- A redesigned, searchable Overall Statistics tab (see below) that replaces the old sub-tab layout.
- Gross and net PnL broken out everywhere, plus dividends, an account value that includes your deposits and withdrawals, and per-account comparison.
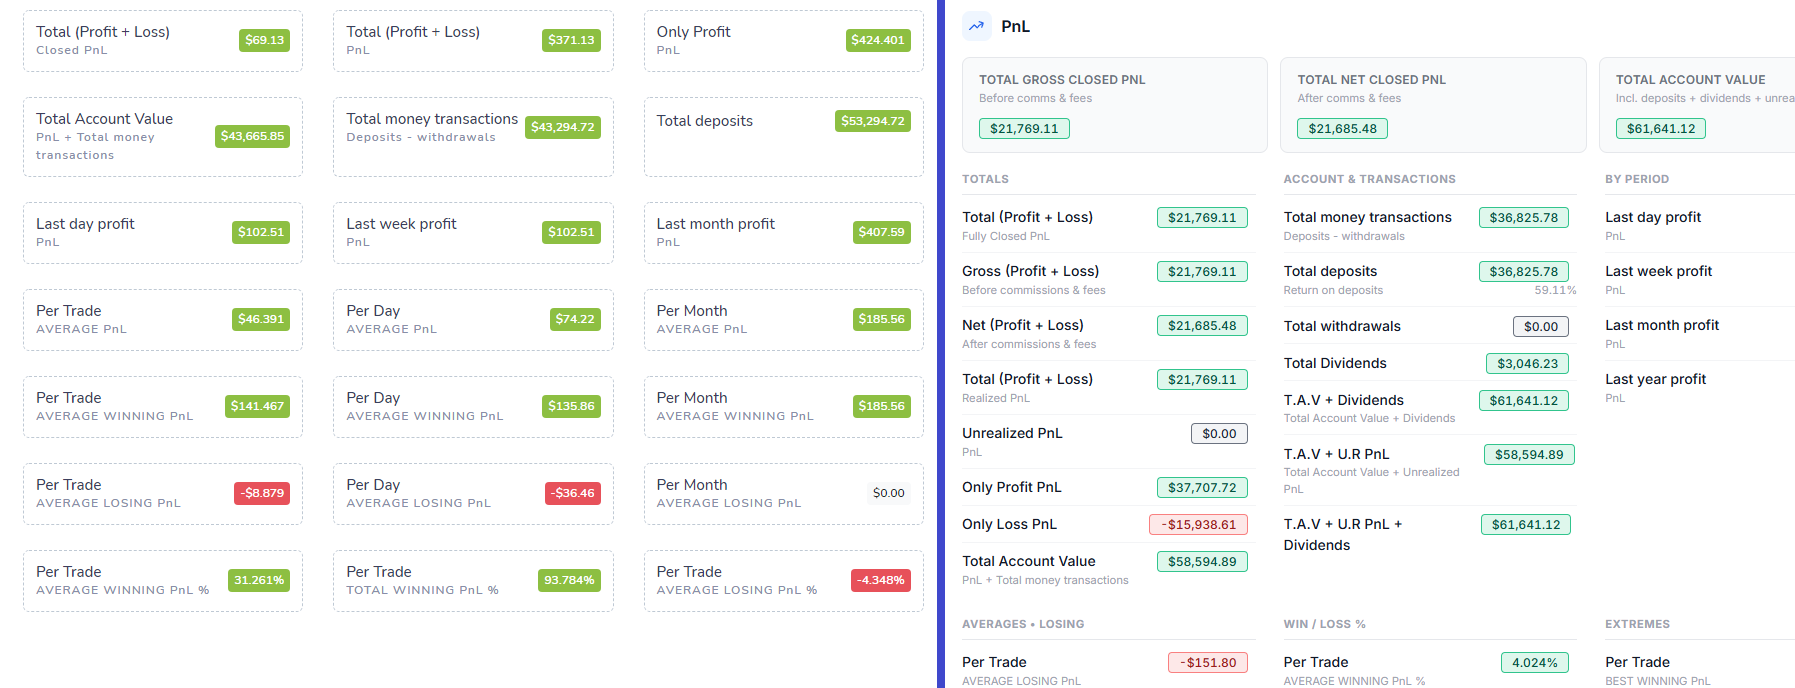
Overall Statistics: now searchable and collapsible (2026 redesign)
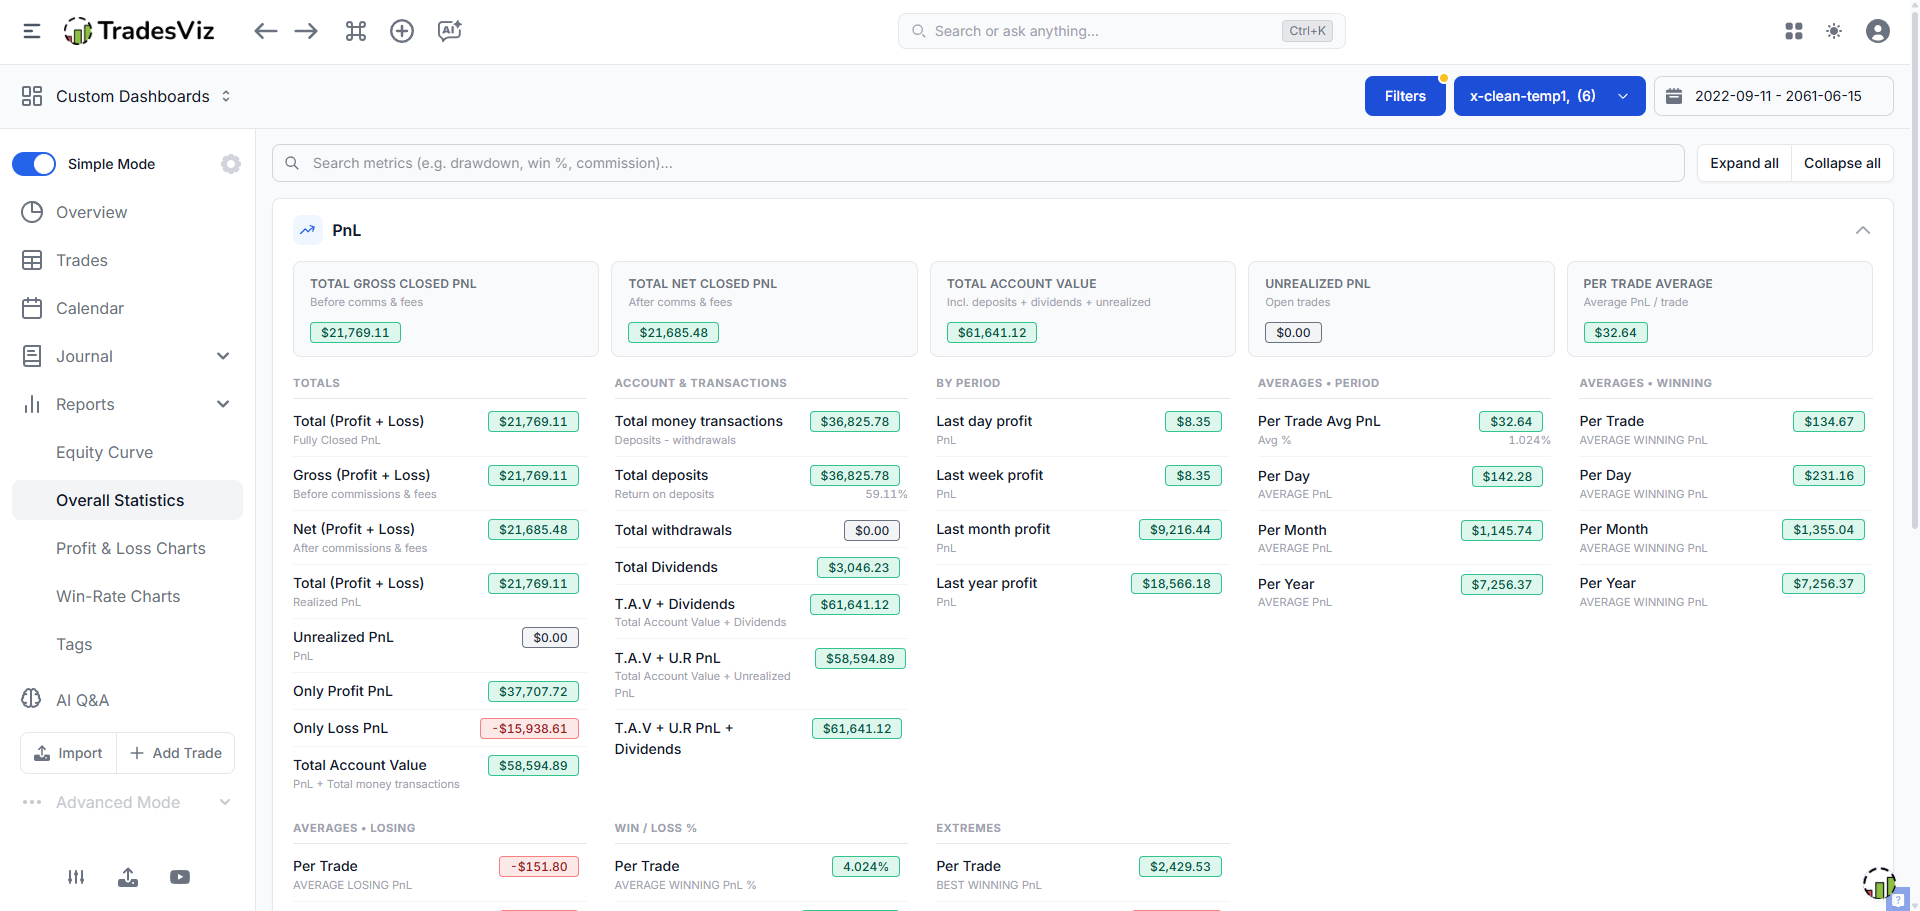
The Overall Statistics tab is the best single snapshot of your whole portfolio. In 2026 we rebuilt it from a stack of sub-tabs (PnL / Scores / Trades / Volume / Symbol / Duration / Commissions) into one search-first page. Everything now lives on a single scrollable page, grouped into collapsible sections.
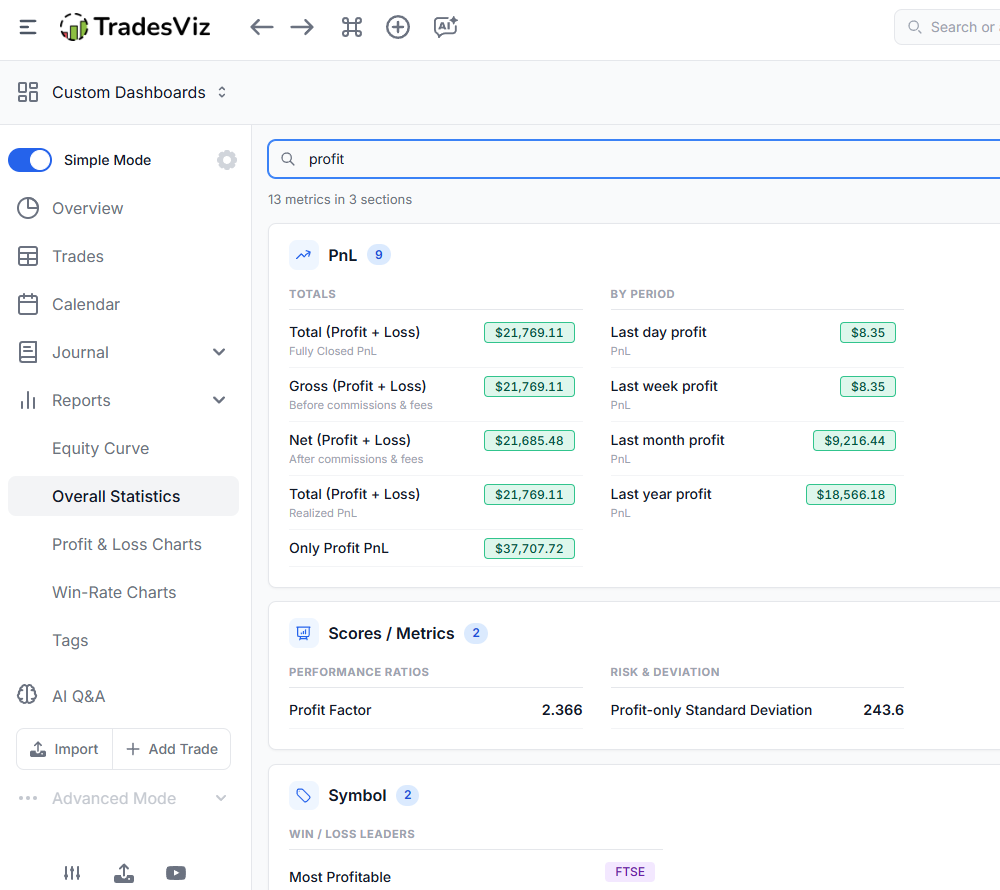
- Search metrics: the large search bar at the top is the fastest way to find a stat. Type drawdown, win %, commission, sharpe or any keyword and the page filters to matching metrics, expands the sections that contain them, and shows a per-section match count. Searching a category name like volume, averages or risk also works.
- Collapsible sections: PnL, Scores / Metrics, Total Trades, Volume, Symbol, Trade Duration and Commissions are each a collapsible card. Use Expand all / Collapse all to control the whole page at once.
- Hero cards: each section opens with a row of summary cards. For example, the PnL section pins Total Gross/Net Closed PnL, Total Account Value, Unrealized PnL and Per-Trade Average. Large numbers in the Volume and Drawdown summaries are shortened to K / L / M so they stay readable.
- Persistent state: your expand and collapse choices are remembered between visits, so the page is never a fresh wall of numbers.
- Simple vs Advanced mode: Simple Mode keeps only the essentials (PnL + Scores/Metrics) open while still letting you search. Advanced users get the full collapsible depth.
The sections below describe every metric on this page.
PnL statistics
The PnL section answers a simple question: how much did you make or lose, and how is that spread across trades, days, months and years? It is split into the following sub-groups.
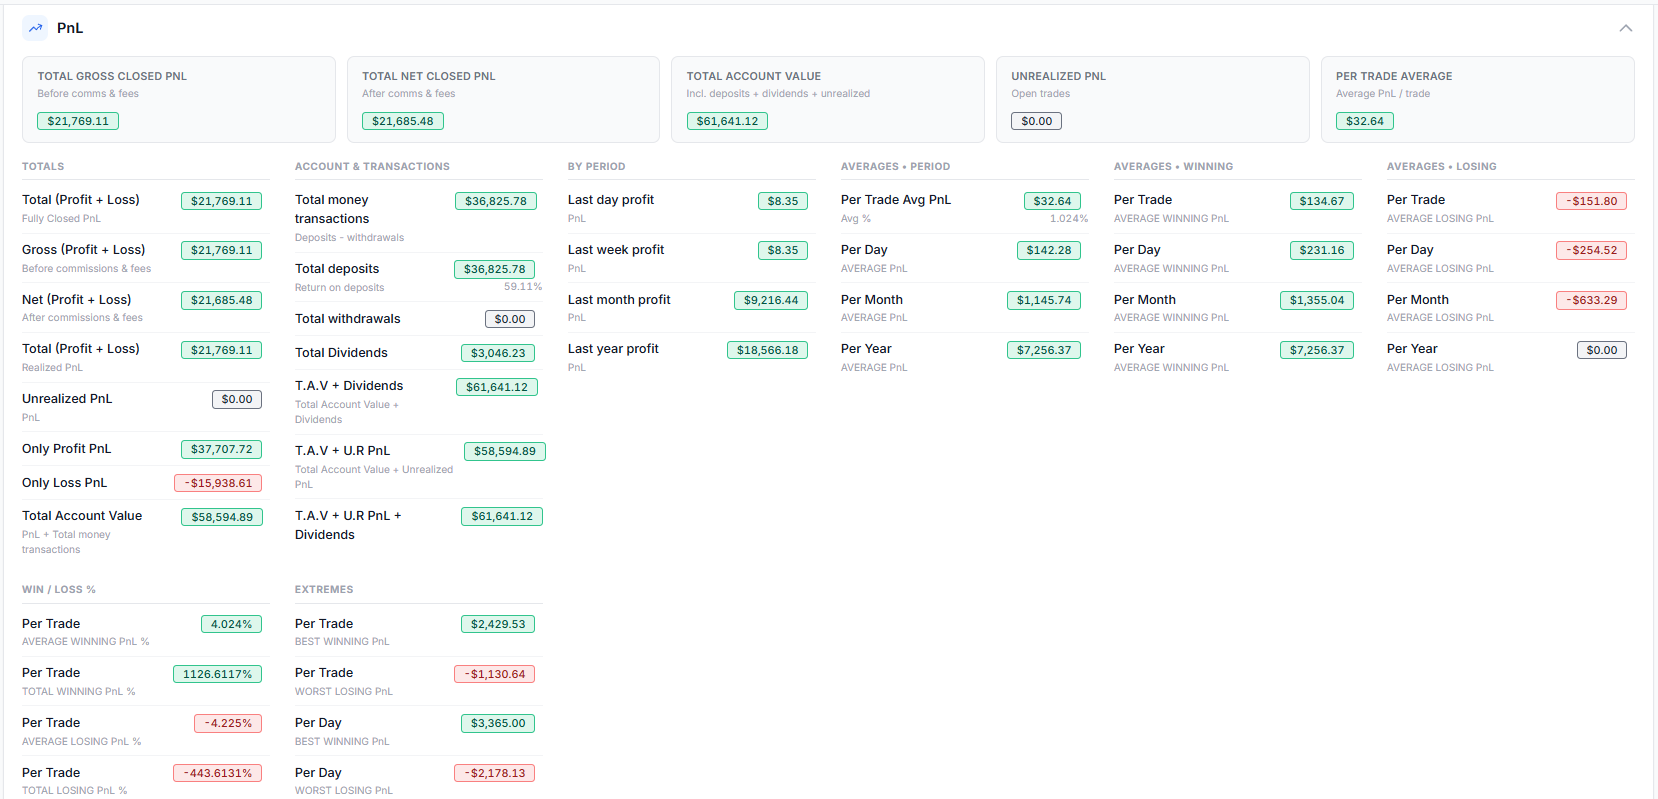
Totals
- Total (Profit + Loss), Fully Closed PnL: realized PnL of only the trades that are 100% closed.
- Gross (Profit + Loss): closed PnL before commissions and fees.
- Net (Profit + Loss): closed PnL after commissions and fees.
- Total (Profit + Loss), Realized PnL: realized PnL including partially-closed trades.
- Unrealized PnL: the PnL you would have if all open trades were closed at the last EOD price.
- Only Profit PnL / Only Loss PnL: the sum of all winning trades and the sum of all losing trades, separately.
- Total Account Value: PnL plus total money transactions (the value of your portfolio, not just trade PnL).
Account & transactions
- Total money transactions: deposits minus withdrawals (entered in the Equity Curve tab).
- Total deposits (with return-on-deposits %), Total withdrawals, Total Dividends.
- T.A.V + Dividends, T.A.V + U.R PnL, T.A.V + U.R PnL + Dividends: progressively complete views of total account value that fold in dividends and unrealized PnL.
By period
- Last day / week / month / year profit: PnL over each trailing calendar period.
Averages (period, winning, losing)
- Per Trade Avg PnL (with average % return), and average PnL per day / month / year.
- The same per-period averages broken out separately for winning and losing trades.
Win/Loss % and extremes
- Average / Total Winning PnL % and Average / Total Losing PnL %: percentage-return based win and loss figures.
- Best Winning / Worst Losing PnL per trade and per day.
Scores / Metrics
This section has the popular metrics traders use to measure performance and risk. Each ratio below links to a full glossary explanation, and many are covered in depth in our advanced statistics guide and new performance metrics post.
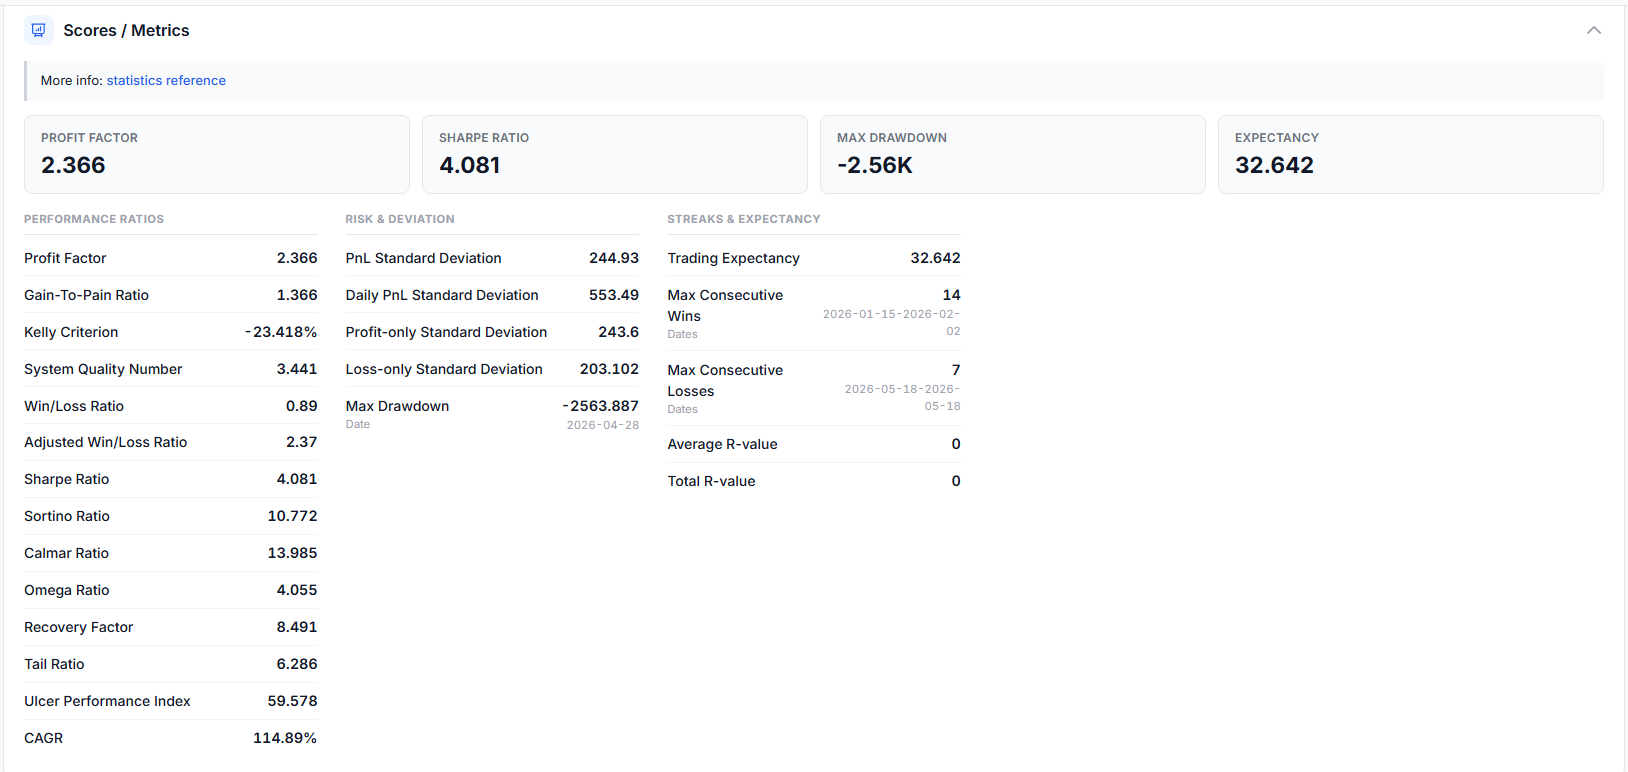
Performance ratios
- Profit Factor: gross profit divided by gross loss. (Source)
- Gain-to-Pain Ratio (trade-by-trade): the sum of all wins and losses divided by the sum of all losses. Higher is better.
- Kelly Criterion: the optimal fraction of capital to risk per position. A value of 0.05 suggests roughly 5% sizing. (Source)
- System Quality Number (SQN): Van Tharp's metric. It is the average PnL divided by its standard deviation, scaled by √(number of trades). Higher means more profitable and more consistent.
- Win/Loss Ratio: average winner / average loser. Adjusted Win/Loss Ratio: (avg winner × % winners) / (avg loser × % losers).
- Sharpe Ratio: risk-adjusted return. It is mean daily P&L over its standard deviation (annualized). Above 1.0 is generally good. Full guide →
- Sortino Ratio: like Sharpe, but only penalizes downside volatility. Full guide →
- Calmar Ratio: net P&L divided by absolute max drawdown. Full guide →
- Omega Ratio: sum of positive daily P&L over sum of negative daily P&L. It is Profit Factor at the daily level. Full guide →
- Ulcer Performance Index: return divided by drawdown depth and duration. It rewards smaller and shorter drawdowns. Full guide →
- Recovery Factor: net profit divided by absolute max drawdown. It tells you how many times over your profit covers the worst drawdown. Full guide →
- Tail Ratio: 95th-percentile daily P&L over the absolute 5th percentile. It tells you whether your big wins are bigger than your big losses. Full guide →
- CAGR: annualized compounded growth rate. It needs deposits entered in the Equity Curve tab. Full guide →
Risk & deviation
- PnL / Daily / Profit-only / Loss-only Standard Deviation: consistency measures for each subset of returns. (Definition)
- Max Drawdown (with date): the largest peak-to-trough decline of your Total PnL curve. Visualize it in the drawdown charts view.
Streaks & expectancy
- Trading Expectancy: the average return per trade across all wins and losses. A positive number means the system is making money.
- Max Consecutive Wins / Losses (with date ranges): your longest winning and losing streaks among fully closed trades.
- Average / Total R-value: profit or loss expressed as a multiple of initial risk (Van Tharp's R). Populated when you enter a stop loss. See the R-value statistics guide.
Total Trades, Volume, Symbol, Duration & Commissions
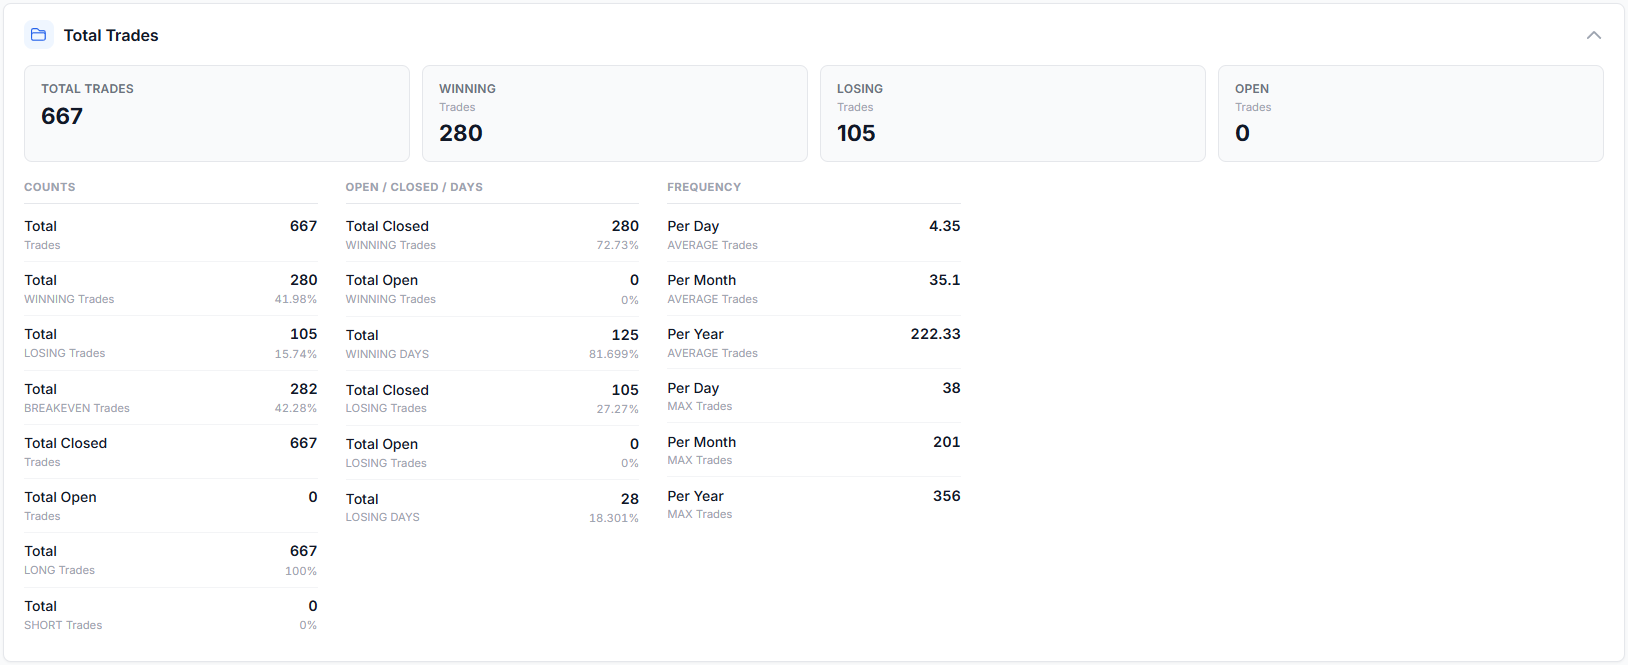
- Total Trades: counts of total / winning / losing / breakeven / long / short trades, the closed-vs-open and winning/losing-days breakdowns, plus average and max trades per day / month / year.
- Volume: total, winning and losing volume, PnL-per-quantity, and average / max / min volume per trade / day / month / year. Large volume figures in the hero cards are shortened with K / L / M.
- Symbol: best and worst ticker by number of wins/losses, by total PnL, the single highest and lowest-PnL symbols, and the most and least traded symbols by volume and by trade count. Every ticker is a clickable tag, so you can apply it as a filter or jump straight to those trades.
- Trade Duration: total, average, max and min holding time for all / winning / losing trades.
- Commissions & Fees: total commissions, fees and combined cost, plus averages per trade / day / month / year. For advanced cost modeling see commission profiles.
Daily Statistics
- The Total PnL figure is the profit or loss for the duration shown beneath it (click the duration, for example "Last 60 days", to change it). It matches the last point of the Total PnL graph.
- The PnL % change is the move between the first and last point of the Total PnL graph.
- The win/loss score chart is a rolling sum where each win = +1 and each loss = -1. It is a quick visual of your streaks.
Equity Curve
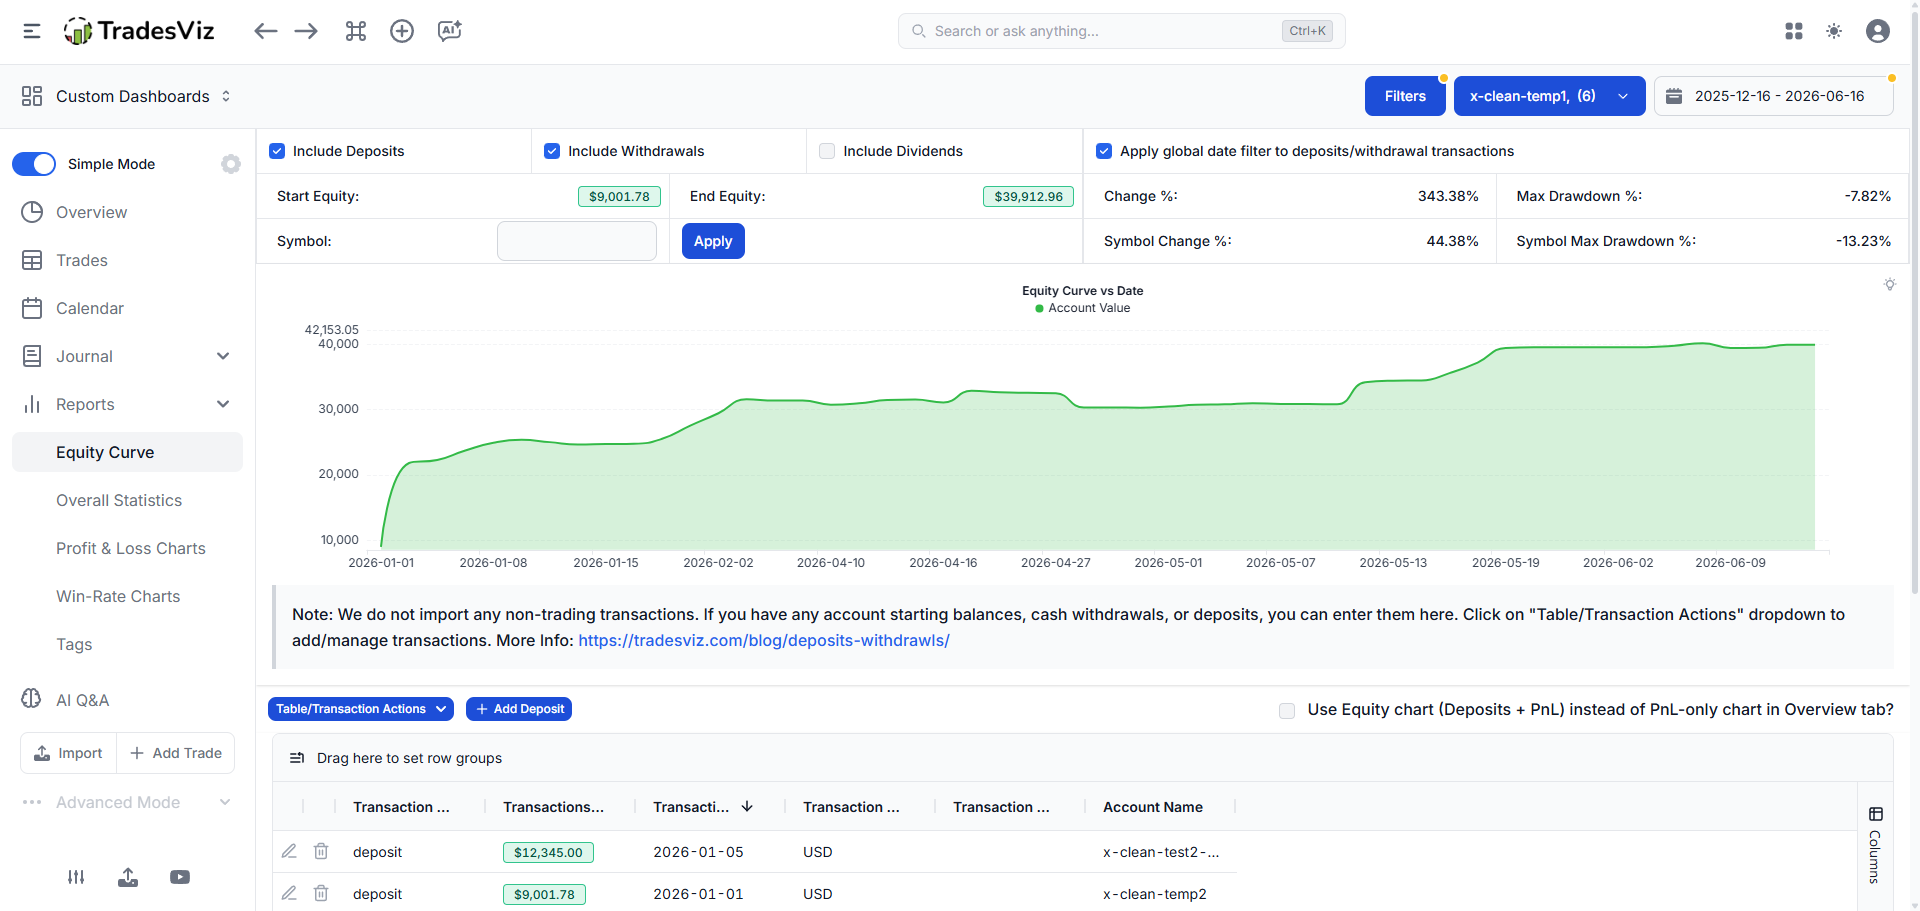
This is where you enter your account or portfolio starting balance, deposits and withdrawals. Trade imports only capture execution data, so this tab is where you record cash movements so that Total Account Value and CAGR reflect your real equity. The graph here is the only one in the dashboard that includes deposits and withdrawals to show full account equity. Full guide →
Calendar
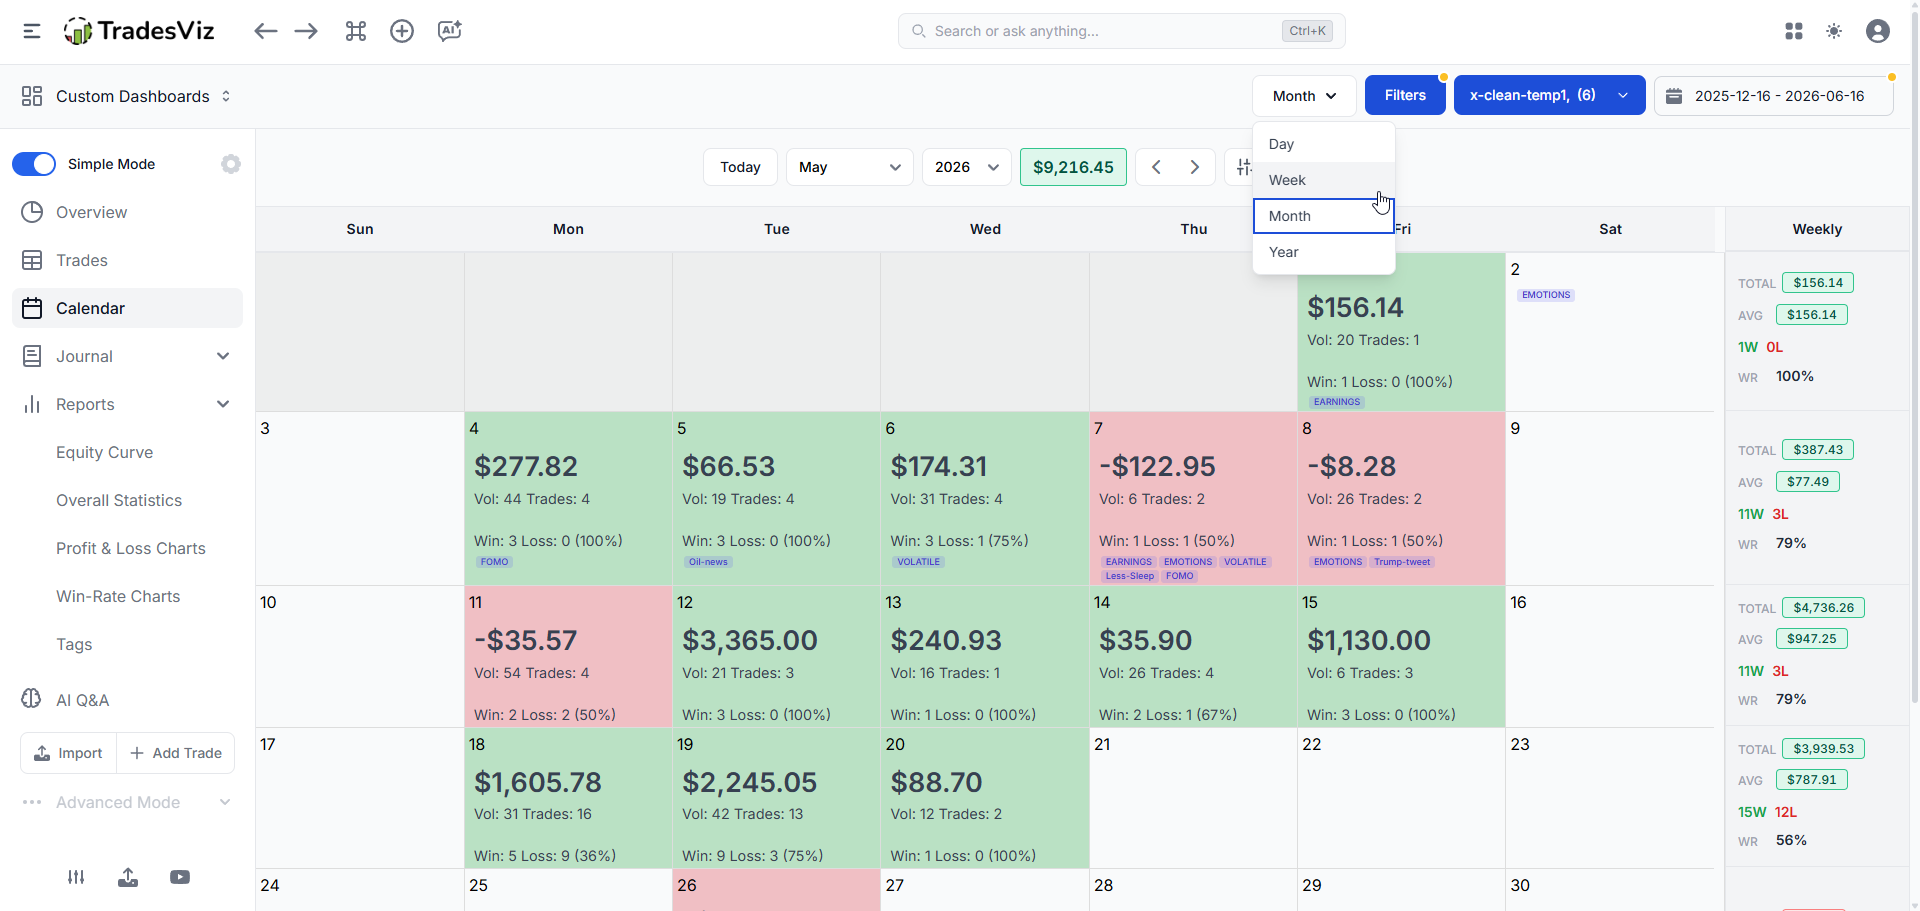
- Year view: a heat map of your entire trading year(s). Add multiple years via the 3-dot menu. Click a cell to open the day explore view, or click a month to open the month view.
- Month view: closed PnL per day for a given month, plus event markers (IPOs, splits, and so on). Full guide → Click a date number to open the day explore view.
- Week view: view per-week stats in a chart with a table below it for easy comparison and further plotting. This also shows volume traded per week. Full guide →
- Day view: a tabular view of the entire summary for a day, including trades made (with explorable links), important PnL stats, running PnL, the realized PnL graph and more. Full guide →
Tables: the Trades (grouped-by-trade) table
The trades table is one of the most-used parts of TradesViz. The symbol-grouped and day-grouped tables are derived from it. Full guide →
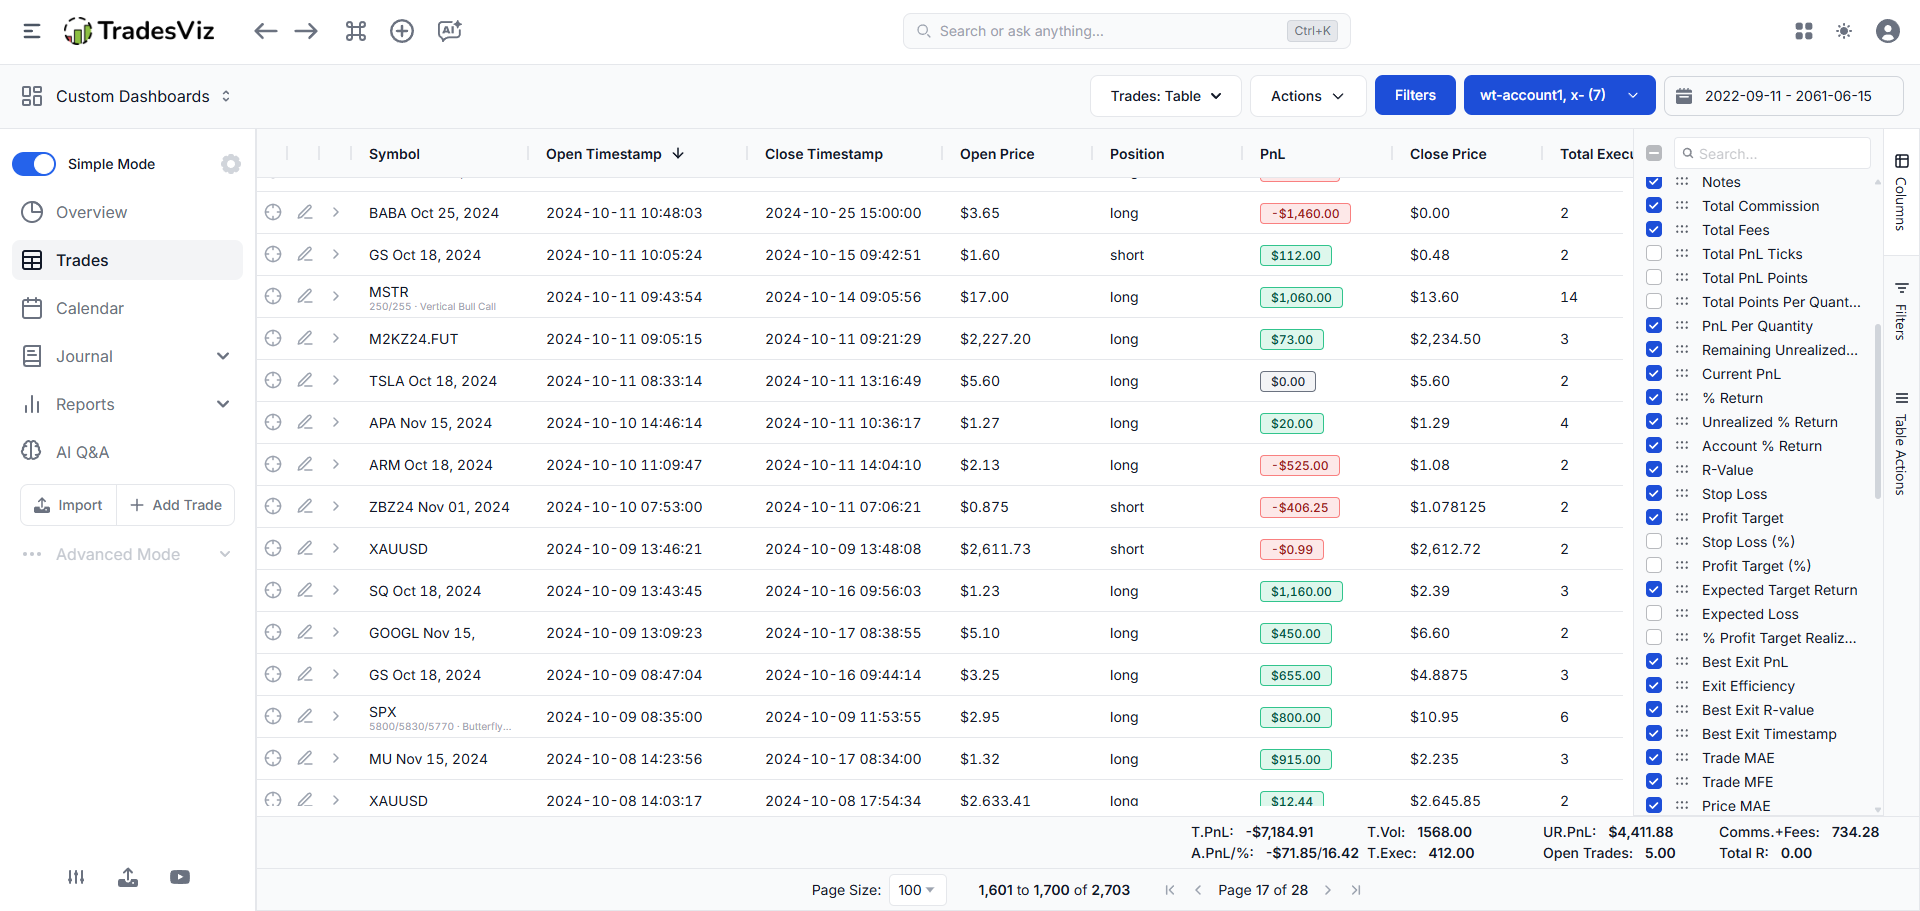
Useful table functions
- Export the current page to PDF or Excel from the buttons above the table.
- Show or hide columns via Column visibility, and re-order columns by dragging the header.
- Expand/collapse all rows to reveal each trade's inner executions.
- Use Group Apply to add commissions, generate charts, or add and remove tags and notes across many trades at once. Details in group trade operations.
- Toggle horizontal scrolling to view every column at once.
All trades-table columns (updated for 2026)
Identity & timing
- Symbol / Underlying: the traded symbol (shows the underlying for spread option trades).
- Currency, Asset Type, Trading Account: the currency, asset class and account a trade belongs to.
- Open / Close Date (and Timestamp): first and last execution date/time of the trade.
- Last Execution Timestamp, Days Since Open.
- Position / Side: long or short, based on the first execution.
- Total Executions, Total Duration.
Price & size
- Open / Close Price, Last EOD Price (and Underlying).
- Total Volume, Total Buy Quantity, Total Sell Quantity, Open Position (remaining quantity to be 100% closed).
- Buy / Sell / Cumulative Cost Basis, Total Cost, Total Credit/Debit, Total Remaining Position Value.
PnL
- PnL: realized PnL of the trade (gross by default; switch to Net via Filters → Net → Apply).
- Current PnL: total PnL if you closed the whole trade now (includes realized).
- Remaining Unrealized PnL: only the still-open portion's PnL.
- % Return, Unrealized % Return, Account % Return.
- PnL Per Quantity, Total PnL Ticks, Total PnL Points, Total Points Per Quantity (futures, points and ticks; see points & ticks stats).
- Max / Min Running PnL, Positive / Negative PnL Time: how high and low PnL went during the trade and how long it stayed in profit or loss. See running-PnL risk analysis.
Risk, stops & targets
- R-Value and Unrealized R-Value: PnL as a multiple of initial risk (needs a stop loss). (More info)
- Stop Loss, Profit Target (and their % variants), Stop / Profit Distance, Open Stop PnL, Open Profit PnL.
- Expected Target Return, Expected Loss, % Profit Target Realized.
Exit analysis & MFE/MAE
- Best Exit PnL, Exit Efficiency, Best Exit R-value, Best Exit Timestamp: how much of the ideal exit you captured. Full detail in exit analysis and multi-timeframe exit analysis.
- EOD Exit PnL, EOD Exit Efficiency, EOD Exit R-value: the end-of-day variant. See EOD exit analysis.
- Price MAE / MFE (and % variants), Trade MAE / MFE, Tick MFE / MAE, MFE/MAE Ratio: maximum adverse and favorable excursion. Covered in the MFE/MAE charts and MFE/MAE duration guides.
- MFE Date, MAE Date, Time till MFE / MAE, Time after MFE / MAE.
Options
- Strikes, Expiries, DTE (Open): option strike(s), expiry date(s) and days-to-expiry at open.
- For full options analytics see the options dashboard, Greeks analysis and options command center.
Tags, notes & misc
- Tags, Tag Groups, Notes: clickable tags (apply as filter), tag-group rollups and free-form notes. See the tags guide.
- Simulated Trade, Day / Week / Month / Year grouping helpers.
The Symbol and Day grouped tables are the same trades aggregated by symbol and per-day. The day-grouped table shows the realized PnL per day (matching the calendar). Expanding a row shows the trades opened or closed that day. Open the day explore view for the full execution and transaction detail.
Related guides
- Charts & statistics reference (Part 1): where to find every chart.
- Advanced statistics and new performance metrics: the ratio definitions in depth.
- MFE/MAE charts and MFE/MAE duration: excursion analysis.
- Exit analysis, EOD exit analysis, multi-timeframe exit analysis, multi-timeframe exit PnL.
- Options dashboard, option Greeks, options flow, payoff charts, NSE options.
- R-value statistics, points & ticks, running-PnL risk, drawdown charts.
- Accounts statistics comparison: compare multiple accounts side by side.
- TradesViz glossary: plain-English definitions of every metric.
That covers the full statistics reference. For charts, most stats are self-explanatory, and the charts reference shows where each one lives.
Need help navigating TradesViz, or a custom UI flow for your trading style? Email us any time at [email protected].