Could have, would have, should have... we have all said these words when we missed a really good exit on that position that was just entered.
But WHAT IF you simulate this for all your trades and figure out an optimal exit point?...
We have had similar what-if analysis before on TradesViz:
Best exit analysis: What if you held your trades a bit longer considering the same max risk taken during the trade (intraday only)?
EOD exit analysis: What if you simply exit the position at EOD?
This seems to stem from the thought of a systematic approach to trading. While we think entries are also very important, it's not something we can simulate with a journal.
What is Multi-timeframe exit PnL?
We define Multi-timeframe exit PnL as follows:
It is the PnL you would see if you had exited the first execution/position of your trade after a particular time period. No max risk is considered. No add-ons to trades or scale-ins are considered.
Here's a more concrete example:
Buy AAPL 100 @ 123.45 at 10:45 AM
Sell AAPL 100 @ 125.35 at 11:30 AM
Now if we want to see what pnl we would have gotten if we had exited 1 hour after the trade, the simulation would be:
Buy AAPL 100 @ 123.45 at 10:45 AM
Sell AAPL 100 @ XYZ at 11:45 AM
This is a 1-hour timeframe simulation where you exit the position exactly 1 hour after you enter it.
Remember that we imposed two conditions here:
- Only first execution
- No max risk
[2] seems obvious and is taken care of by best exit analysis for intraday trades (albeit without defined exit points - maximizing profit is the goal here)
[1] Is interesting because it ignores your scale-in's and out's. Take the following example:
Buy AAPL 50 @ 123.45 at 10:45 AM
Buy AAPL 50 @ 123.50 at 11:00 AM
Sell AAPL 100 @ 125.35 at 11:30 AM
Now if we want to see what pnl we would have gotten if we had exited 1 hour after the trade, the simulation would be:
Buy AAPL 50 @ 123.45 at 10:45 AM
Sell AAPL 50 @ XYZ at 11:45 AM
So bear in mind these caveats when looking at the Multi-timeframe exit PnL numbers on TradesViz for your trades.
This is just the first iteration of this feature. We are barely scratching the surface of useful simulation-based analysis that can directly impact your trading. Any feedback, or ideas you have are very welcome!
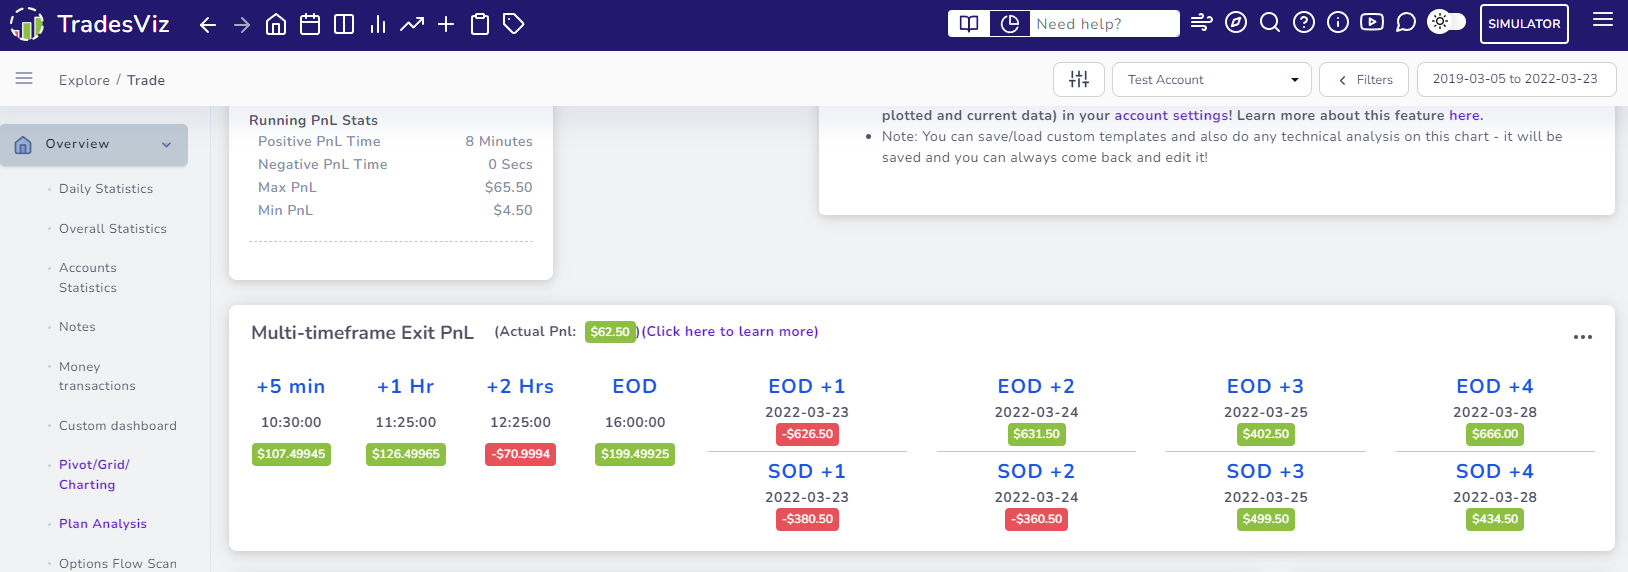
So far, we have exit PnLs for the following timeframes generated automatically for all trades (except options spreads for now):
- Exit PnL after 5 minutes
- Exit PnL after 1 hour
- Exit PnL after 2 hours
- Exit PnL at EOD
- Exit PnL at EOD + 1 (next day)
- Exit PnL at EOD +2 (2 days after entry)
- Exit PnL at EOD +3 (3 days after entry)
- Exit PnL at EOD +4 (4 days after entry)
- Exit PnL at SOD (Start/open of day) + 1 (next day)
- Exit PnL at SOD (Start/open of day) +2 (2 days after entry)
- Exit PnL at SOD (Start/open of day) +3 (3 days after entry)
- Exit PnL at SOD (Start/open of day) +4 (4 days after entry)
Where can you see this in TradesViz?
Two places at the moment:
- Trade explore: Right below the chart/stats area.
- Pivot grid: As independent columns for each of the 12 timeframe exit PnL's
There are a lot more features coming soon like:
- In-depth statistics and analysis on how this correlates to your actual PnL
- Exit time's correlations with other stats like a weekday, long/short, asset type, market conditions, etc.
- Charts showing these pnl numbers overlayed with your actual pnl
and more...
We are just starting to explore this, so expect a lot more features to follow!
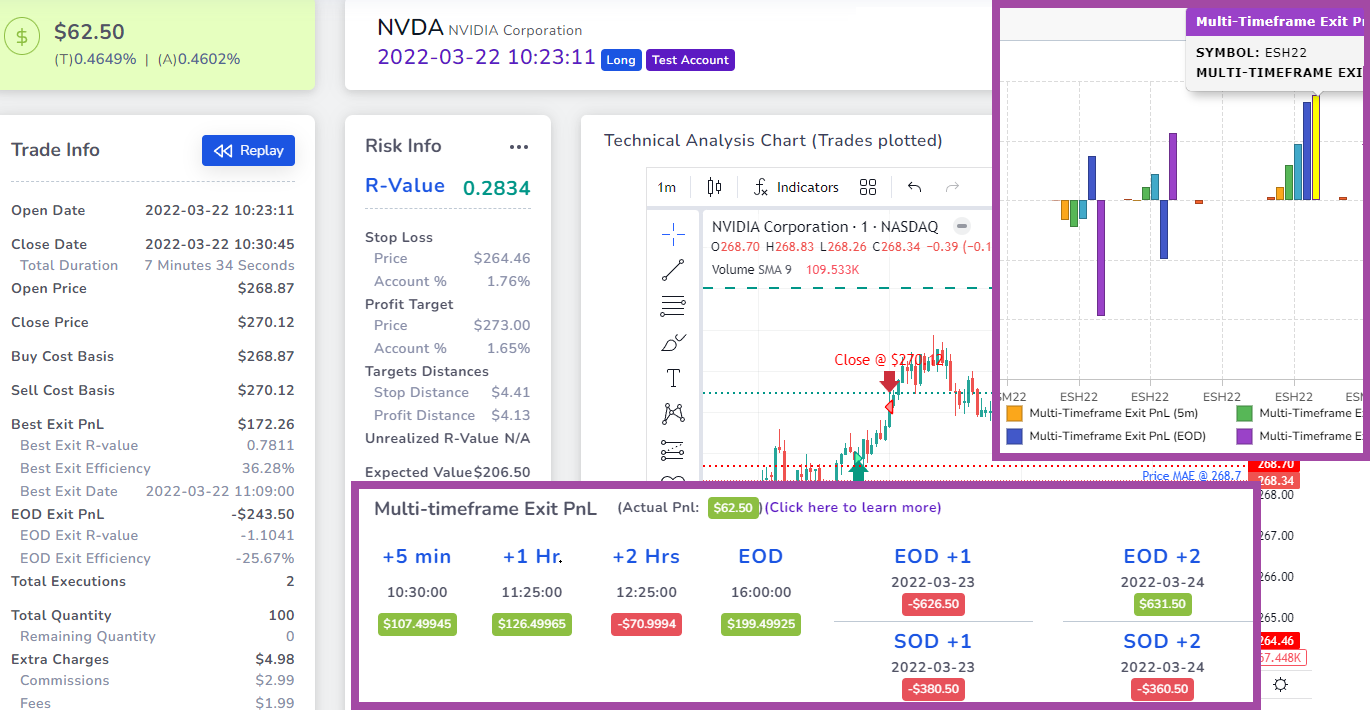
Here's how it currently looks when you see it on the trade explore page:
If you do not see this, it could be due to a few reasons:
- Your trade was imported before the launch of this feature so you need to re-calculate the trade. You can either click on the recalculate button on the same page (right above the executions table in the same trade explore page) or use group apply feature (video) to trigger mass recalculate on up to 250 trades at once (will take some time, but you can close the window since it's a background server process)
- We do not yet have data for this trade - try checking the day after
- Your symbol is not tagged properly. Click on the yellow gear icon and try assigning the correct symbol and re-calculate your trade.
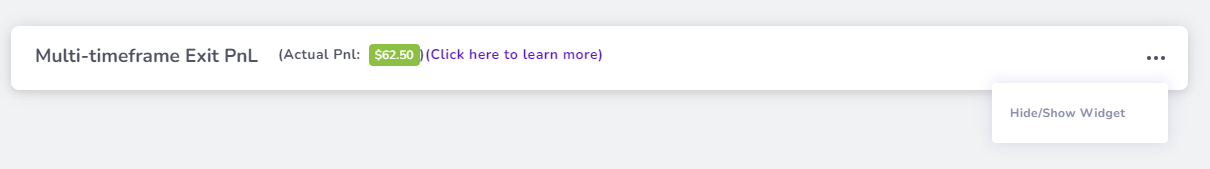
Note that you can easily collapse this section by clicking on the 3 dots icon on the top right corner of the section and clicking on the Hide/Show option.
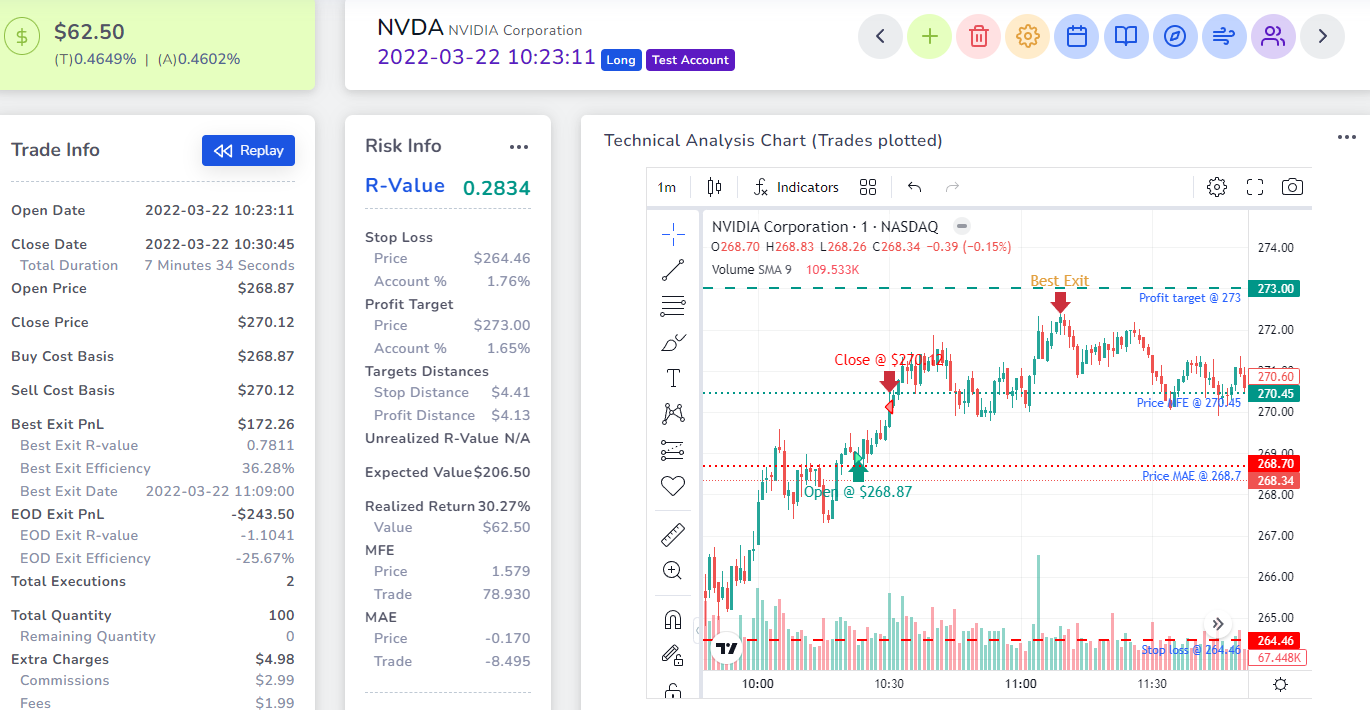
Just for your reference, here's the full trade info:
Now in case you are worried that you will not be able to analyze this - worry not!
The full analytics prowess of the advanced pivot grid comes to the rescue! Here's a very simple example of pnl overlayed with multiple timeframe exit PnL's:
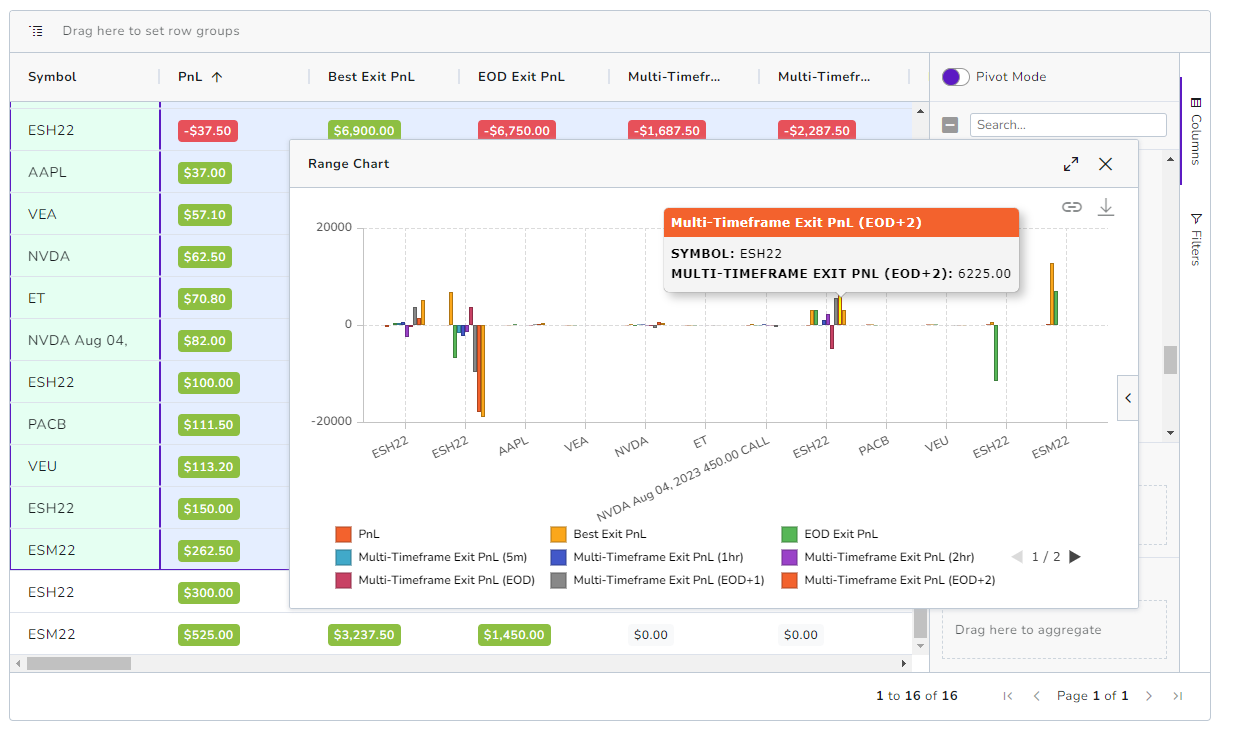
There are nearly 100 columns and almost every column can be grouped, pivoted, charted, and visualized with the pivot grid. See here for more advanced analytics examples.
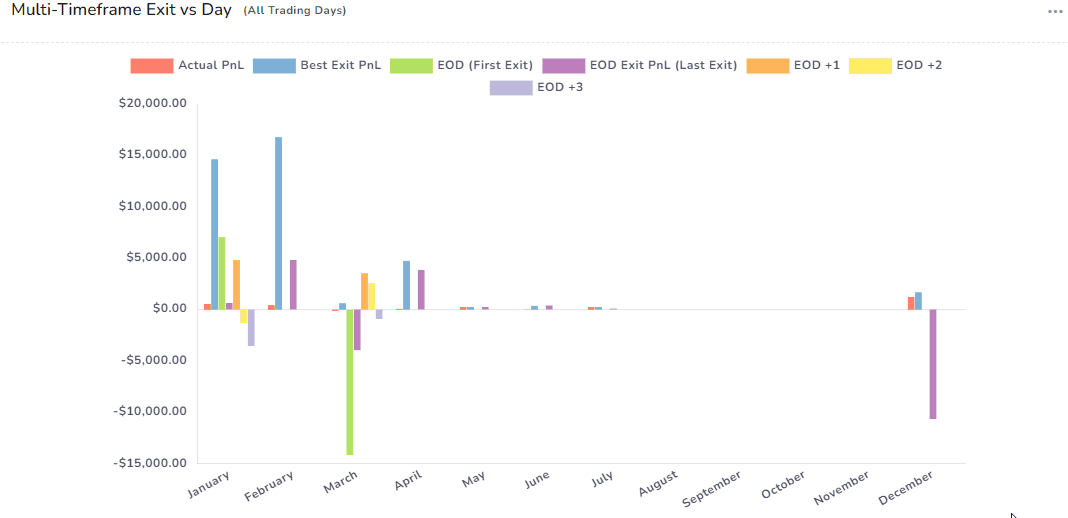
Update Oct 9th, 2023:
Multi-timeframe exit analysis can now be visualized along with Best and EOD exit stats! Learn more in our dedicated blog post here: https://tradesviz.com/blog/multi-timeframe-exit-pnl/
The possibility of types of VERY ACTIONABLE analysis that can be done here are PLENTY and we can't wait to explore them and bring them to TradesViz.
As always, we are eager to hear your feedback and ideas. This has been a feature request from a lot of recent users as interest in simulation and getting actionable insights has been growing. We hope this helps you figure out how to further optimize your trading system and take more data-backed trading decisions.