Another user requested feature arrives on TradesViz: New performance metrics!
So far, we have radar charts, treemaps visualizing mostly PnL-related statistics, but with the addition of this feature, we can now add any special or custom metric based on user's feedbacks and easily integrate them into TradesViz. We have initially added Reward/Risk ratio and Expectancy ratio but we will soon add more metrics as we get some more data on usage patterns and user requests.
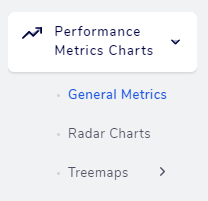
This new metrics tab can be accessed under the performance metrics tab.
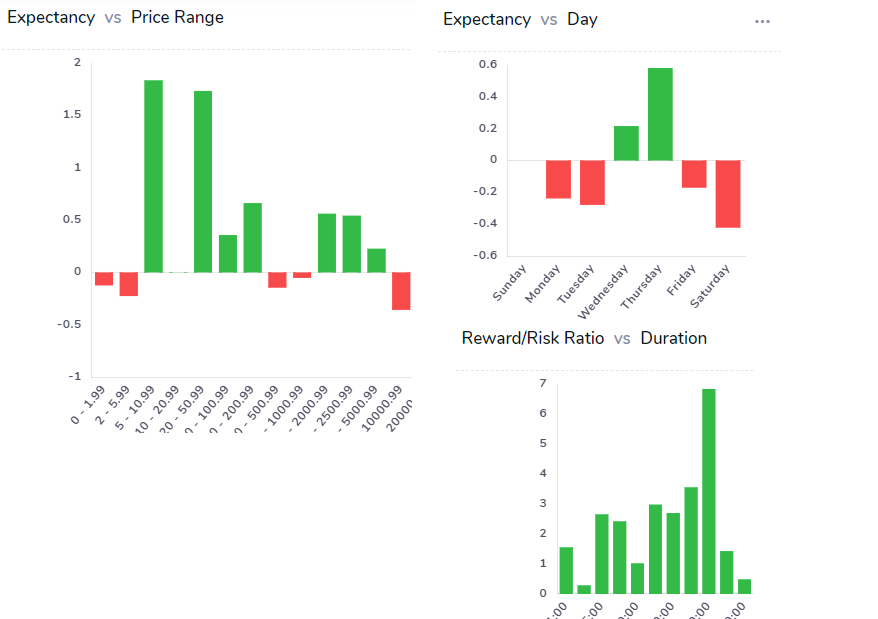
The format of the charts will be familiar to the ones on the trade analysis chats where we plot a single static (a metric in this case) versus the following trade attributes:
- Price range
- Volume range
- Time
- Duration
- Day
- Month
- Year
- Position/Side
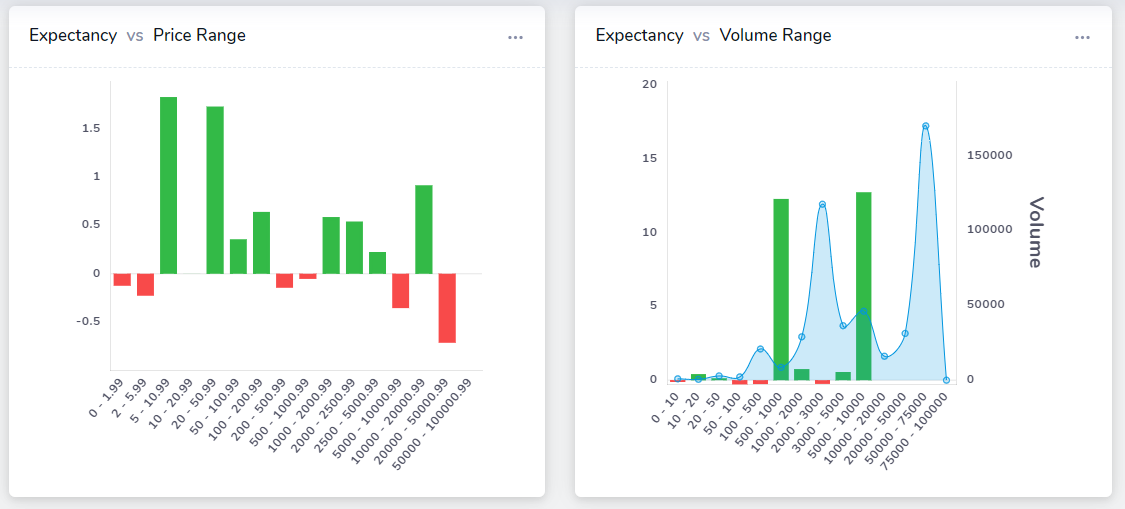
All of these charts allow combined will give a complete view of your trading performance from all perspectives. Note that it's also possible to overlay PnL, volume, and no. of trades over these charts. Simply click on the 3 dots icon on the top right corner of each chart and select an overlay. As with all charts in TradesViz, you can click on any data point individually to explore or even apply the x-axis label as a global filter. Here's an example of expectancy chart with overlay:
Right now, the following metrics are supported:
- Reward/Risk ratio: (Average winning amount)/(Average losing amount) (Average and Total metrics separately available)
- Expectancy: (Average winning amount x Win ratio) - (Average losing amount x Loss ratio)
- Profit factor (Average and Total metrics separately available)
- Hit Ratio: (No. of wins)/(No. of wins + No. of losses)
- R-value (Average and Total metrics separately available)
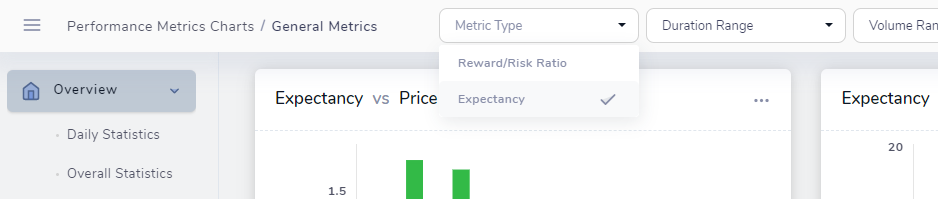
Do let us know (email: [email protected]) if you want us to add more metrics or if you feel the calculations are wrong in some way. You can switch between these metrics by using the filter dropdown on the top.
We hope with these metrics, TradesViz becomes a more valuable tool for you to find your trading edge! We're always open to feature requests and feedback - please let us know your thoughts at [email protected]!