Are you confused about what you should do when you have many open trades?
Have you ever thought, if you had access to more data, how you could have changed your execution strategy?
Tired of having multiple subscriptions for each type of market data?
All of that ends now.
The new Unified View of TradesViz has answers to all the above questions and more. It is the ultimate combination of market + trading data presented in an understandable and actionable way.
How do you access this? Simple. Head over to your trades table and click on the "Unified View" at the top.
You will now see a list of boxes like below with data filled in them. It is important to remember that these trades correspond exactly to the rows in the trades table - it's synchronized to the main table. When you change pages, this page gets updated automatically. Use the main table to filter/sort etc., and then switch to unified view to view more analyze your trades.
Here is the anatomy of a Unified view box:
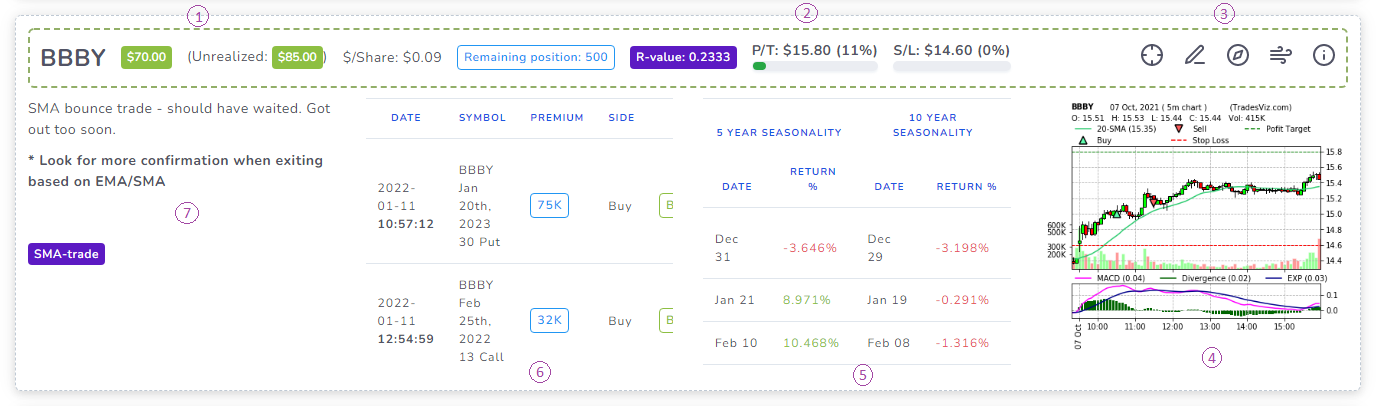
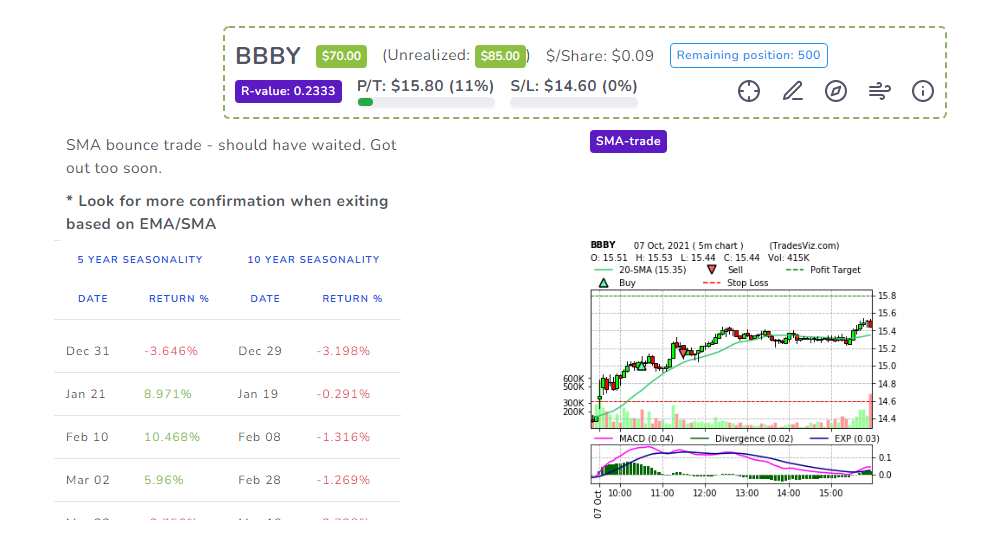
- Info about the symbol realized PnL and unrealized PnL, and contextual info based on asset type. You will see strikes of your options strategy and info about how many legs are expiring soon (within 7 days). The color of the header changes based on the result of the trade - solid green if win, solid red if loss, dotted green if open trade + winning so far, and dotted red if open trade + losing so far.
- Risk info - R-value, your stops, and a simple progress bar that shows you how you have till you reach your targets.
- Explore trade, Edit trade details (add/edit notes), view options flow page for the current symbol, view seasonality for current symbol & finally TradingView widgets for the current symbol. Each button serves as a redirection to a page that has more functionalities.
- Static chart of the trade - click to zoom, edit, and more!
- 5-year and 10-year seasonality report for this symbol considering % change from the last execution's date. You can read more about seasonality analysis here.
- The most recent largest options flow for the current symbol (table is scrollable in both directions). You can read more about how you can use options flow data to effectively manage your positions and make data-driven decisions on what to trade.
- Finally, your notes and tags.
Seven pieces of information for each trade are presented in a unified manner. You no longer need to switch between multiple tabs. All the info you need is right here on a single page.
We have historically focused a lot of analysis of trades (past) and now we are also focusing on features that are going to help you manage your trades - for all asset types!
Please let us know what you think of this new feature! We are constantly iterating our designs and improving our dashboard so if you have any ideas/feedback, do let us know: [email protected]