Seasonality is a very interesting concept in trading. What is seasonality? Investopedia defines it as
Seasonality refers to predictable changes that occur over a one-year period in a business or economy based on the seasons including calendar or commercial seasons.
With the exception of outlier events such as war or pandemics, the general behavior of markets averaged over a long period of time is very similar when looked at from a perspective of calendar-based slices.
Let's explore this by looking at the historical performance of SPY and some "popular" sayings/events in the investing world. Shown below are the SPY average monthly returns for the last 20 years grouped by month-of-year.
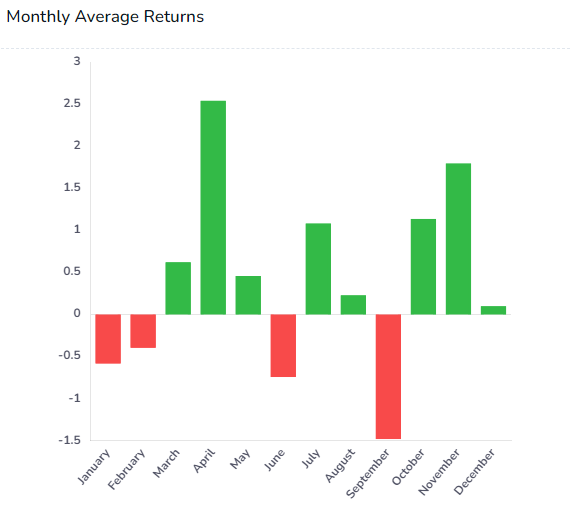
Sell in May and go away
A very well-known phrase that means the market is generally expected to underperform during the period of May to October. This is also clearly visualized in the graph above where the sum of the total return of the months June-Sep is -1%. You can notice this not only in SPY but in any stocks.
End of year rally
October, November, December - the last 3 months of the year has historically been well performers and this is thought to be due to the anticipation of the January effect where there is a demand or rather an influx of new buying happening among investors due to the result of increased liquidity. However, from the above chart, we can only see the effect of the end-of-year rally without the continuation of the increase in performance in January (aka "January effect"). So, what happened here? Let's look at the returns chart for different historical periods.
Last 5 years:

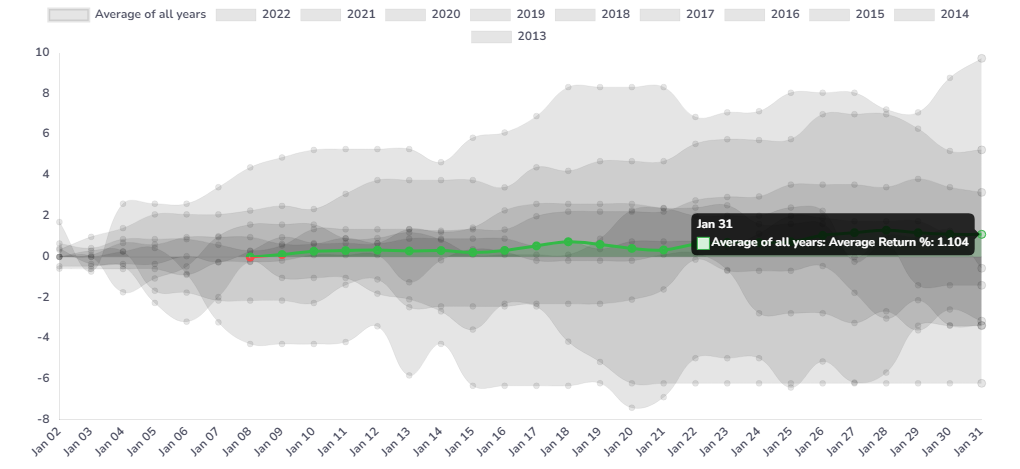
Last 10 years:
Last 15 years:
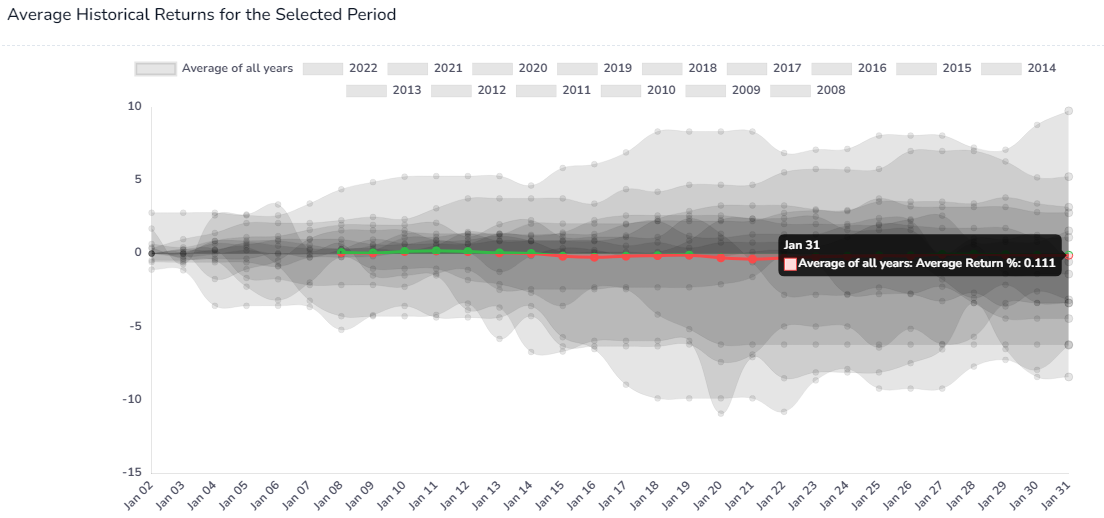
You might be able to see a pattern here. The returns are more pronounced in recent periods but not if we take a larger period of say, 20 years. Seasonality analysis is highly dependant on what time slice you are looking at. It's not very useful to look at say, the last 20 or 30 years nor is it sufficient to just look at the last 2 or 3 years.
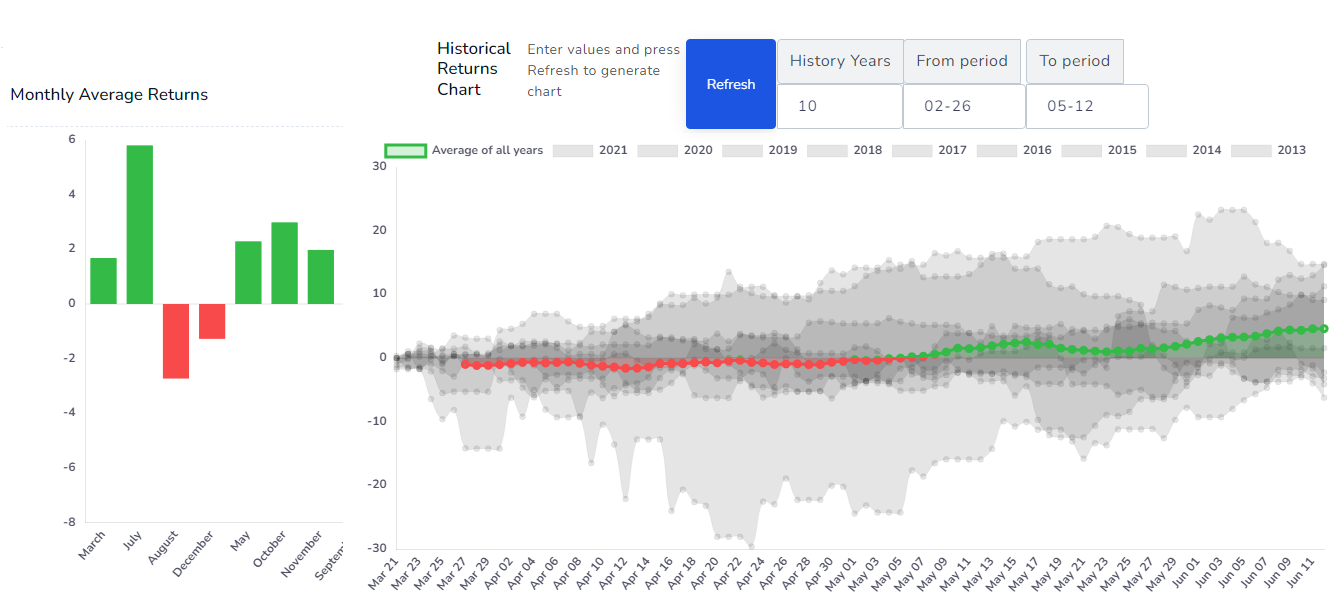
To provide traders with more flexibility, we have a custom calendar for the calendar-wise seasonality and a simpler last `n` years input for historical trends visualization.
How can you use this in your trading?
If you are a swing/options trader, you can look into seasonality as an additional datapoint to support your trading strategies. If you are an intraday/very short-term traders, seasonality can again be an additional datapoint in backing up *your* overall bias of the market and this can affect the way you take your trade intraday.
This is not only useful in closing or managing positions, but also in opening positions. Seasonality is not applicable to indices or popular ETFs, but can also be looked into for stocks in correlation with popular events that happen and the trend of the industries. This is however slightly more complex task but highly rewarding if you are focusing on specific sectors.
In the upcoming updates, this analysis will be integrated into your journal to help manage your trades and make better data-driven decisions.
At the moment the Seasonality dashboard can be accessed by visiting: https://tradesviz.com/seasonality/. The list of available charts are:
- Yearly returns
- Quarterly returns
- Monthly returns
- Week-of-Year returns
- Historical trend for any calendar period
We are working towards a more holistic solution for traders who can use TradesViz not only for journaling but to also make informed decisions on how to trade and manage their positions using the analysis and visualizations from TradesViz.
We hope this feature becomes another useful tool in your arsenal in tacking the markets. As always, please let us know if you have any questions, feature requests by emailing us at [email protected].