
We rarely introduce "new" statistics on TradesViz because the v2.0 upgrade's grids and AI query have been more than sufficient for even the most advanced traders to create their own metrics.
However, there are instances when certain metrics require the usage of market data. One such example is our last static - multi-timeframe anlaysis. These cannot be replicated by AI query or via grids etc.,
Relative volume anlaysis/stats that we are now introducing comes under the same category. Let's explore.
What is "relative" volume?
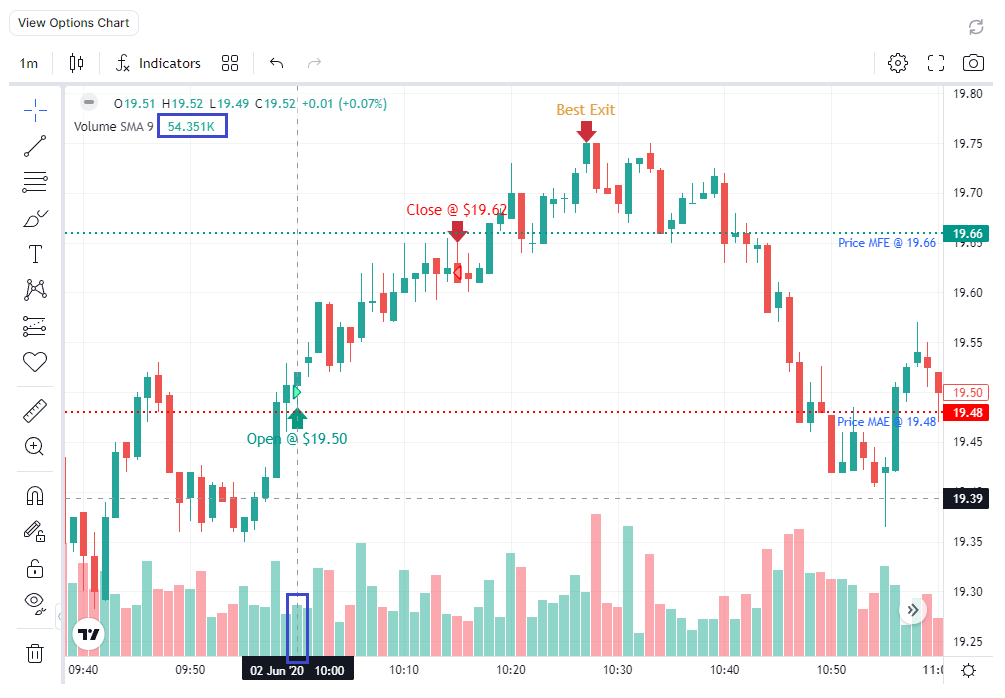
We refer to "relative volume" here as the volume of the underlying of the trade at the open time. For example, the SNAP trade below shows the position opened at 10:00 AM. The volume of the 1-minute timeframe chart's bar is 54,300. We will call this the relative volume of 1-minute timeframe.
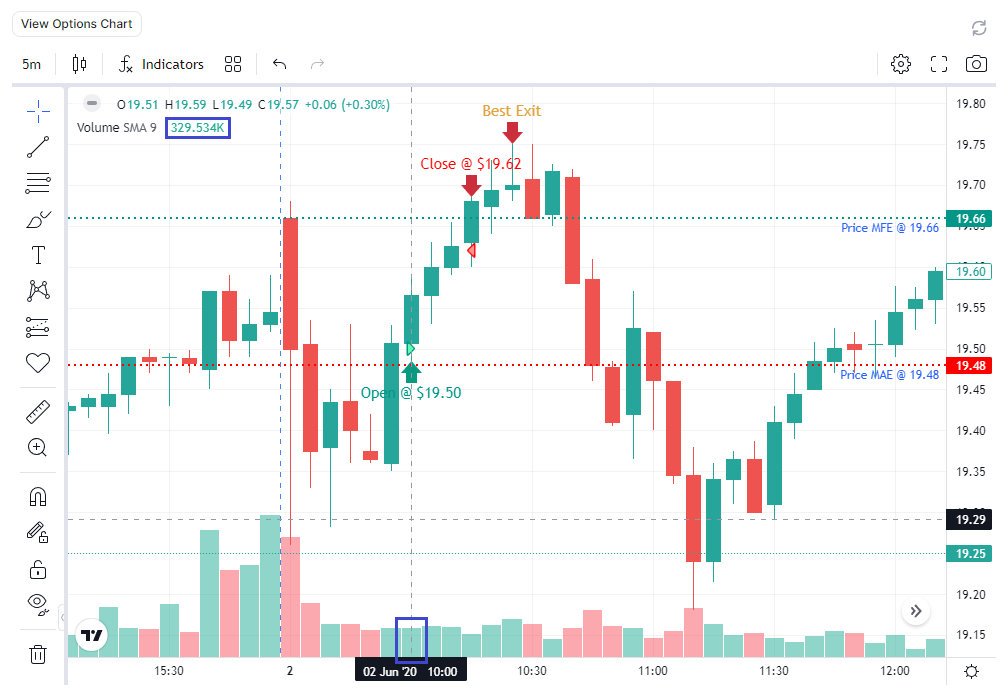
Similarly, we can define 5-minute relative volume as the volume of the bar on which the trade was opened. Shown below is the same trade but in the 5-minute timeframe. The relative volume is ~329,000.
Like this, we extract the following for each trade for which we have volume data:
- 1-minute relative volume
- 5-minute relative volume
- 15-minute relative volume
- 30-minute relative volume
- 1-hour relative volume
- 1-day relative volume
Note that for derivatives, we use underlying's volume. For example, if AAPL options are traded, we use the volume of AAPL stock.
How are we using this data and where do you find it in TradesViz?
Now that you understand what relative volume is and what all the data points we collect, it's time to visualize them. We've often had this question from traders: would it be possible to visualize the pnl of a symbol or an underlying based on its actual volume? What you are about to see below is the answer to this question: Relative volume anlaysis.
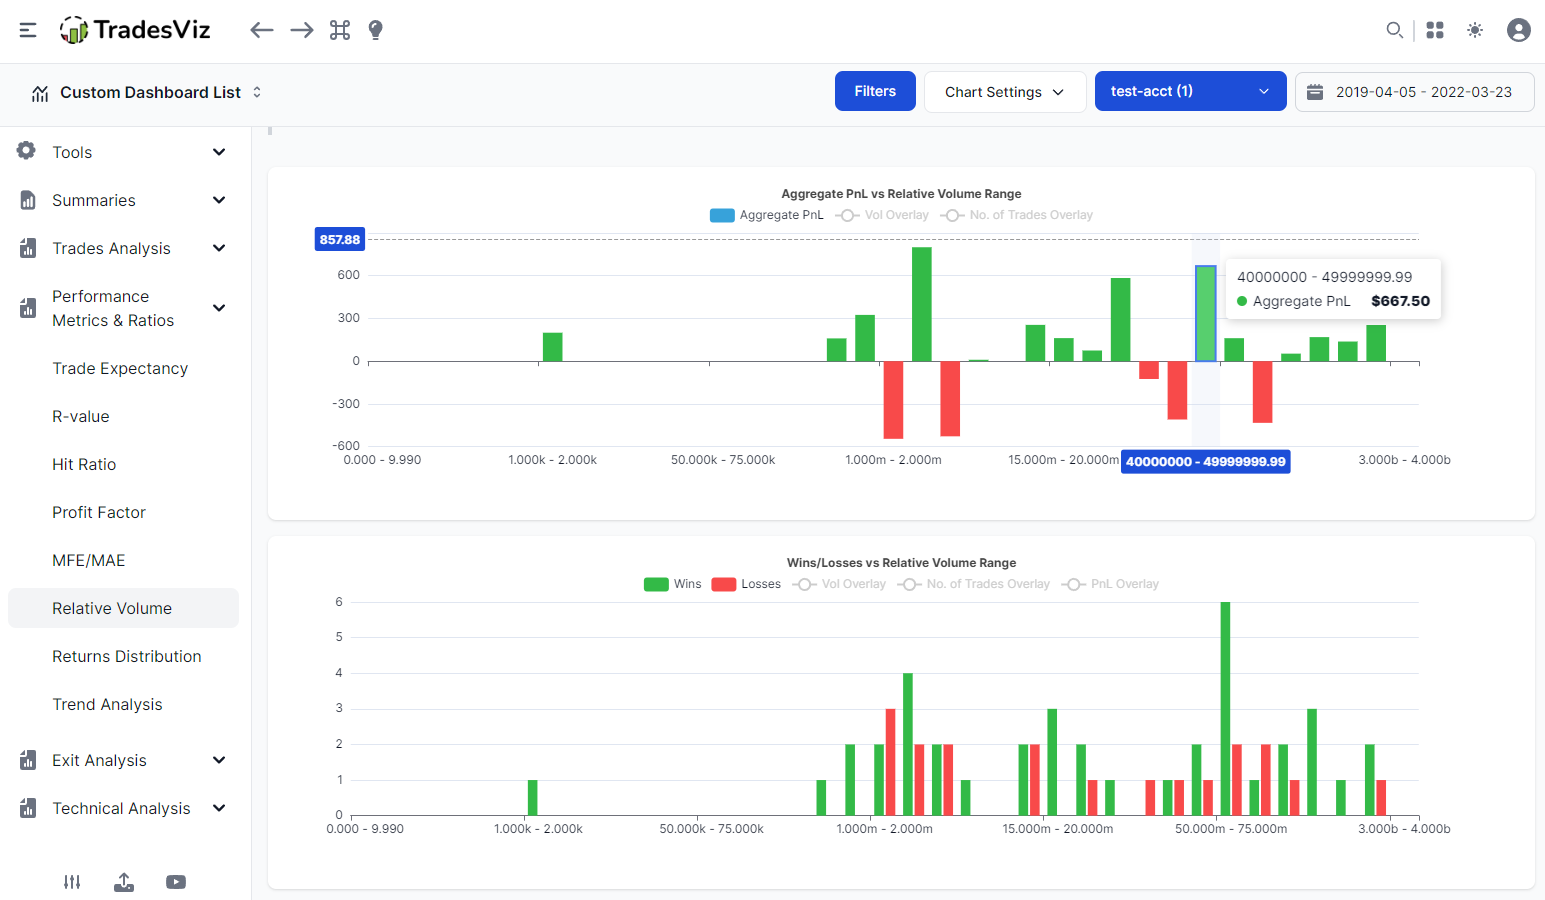
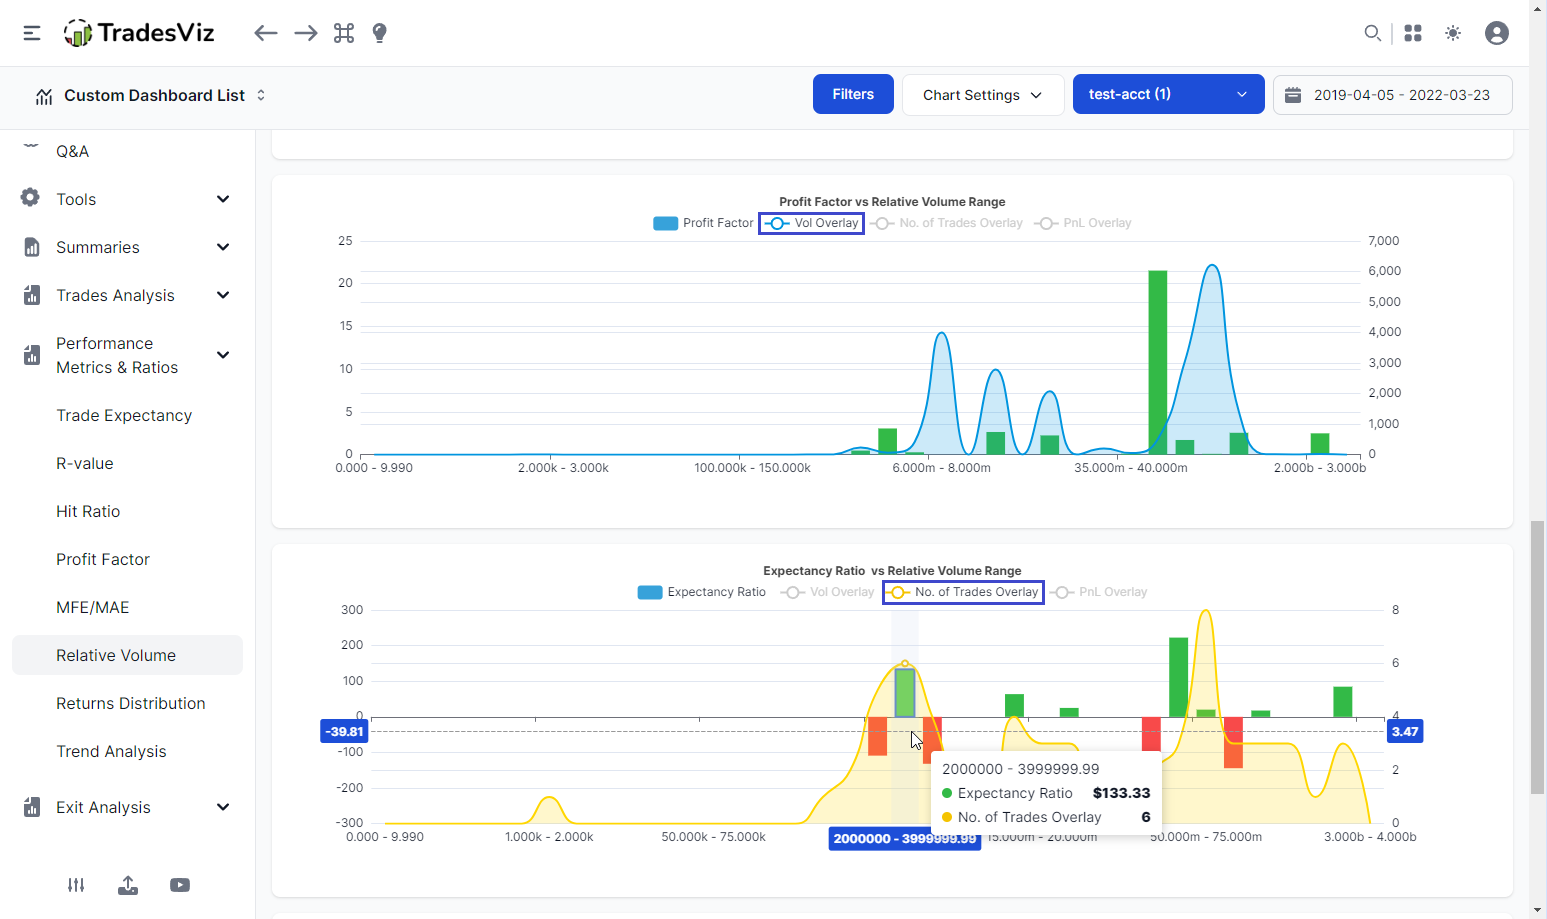
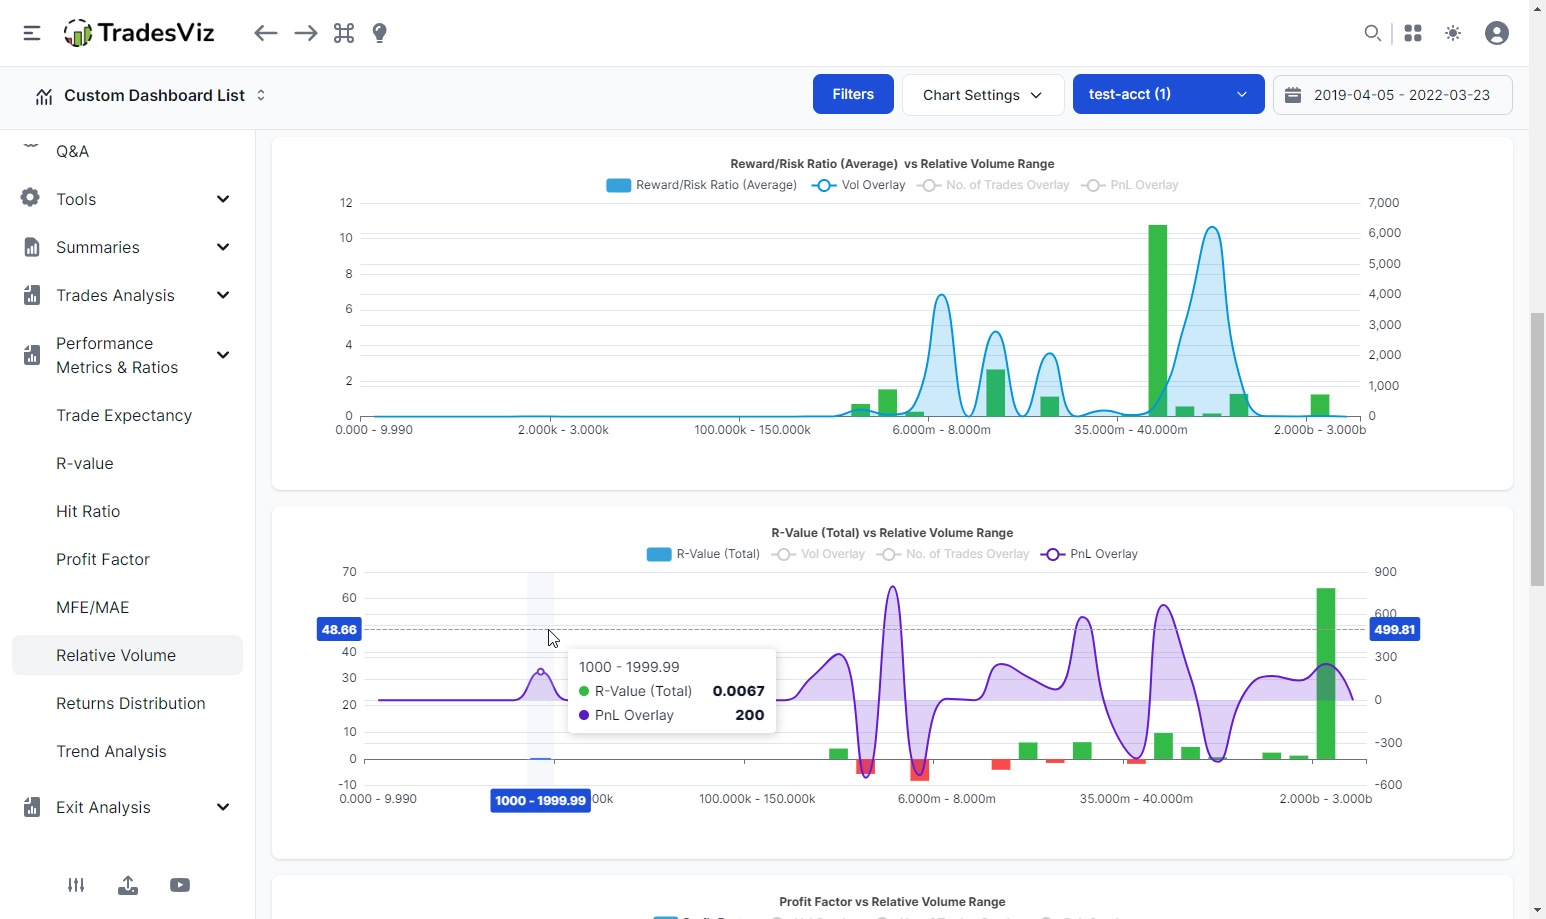
You will see a new tab called "Relative volume analysis" under the "Performance metrics and ratio" section in your dashboard. In that tab, you will find 7 charts:
- Aggregate PnL vs Relative Volume Range
- Wins/Losses vs Relative Volume Range
- Reward/Risk Ratio (Average) vs Relative Volume Range
- R-value vs Relative Volume Range
- Profit Factor vs Relative Volume Range
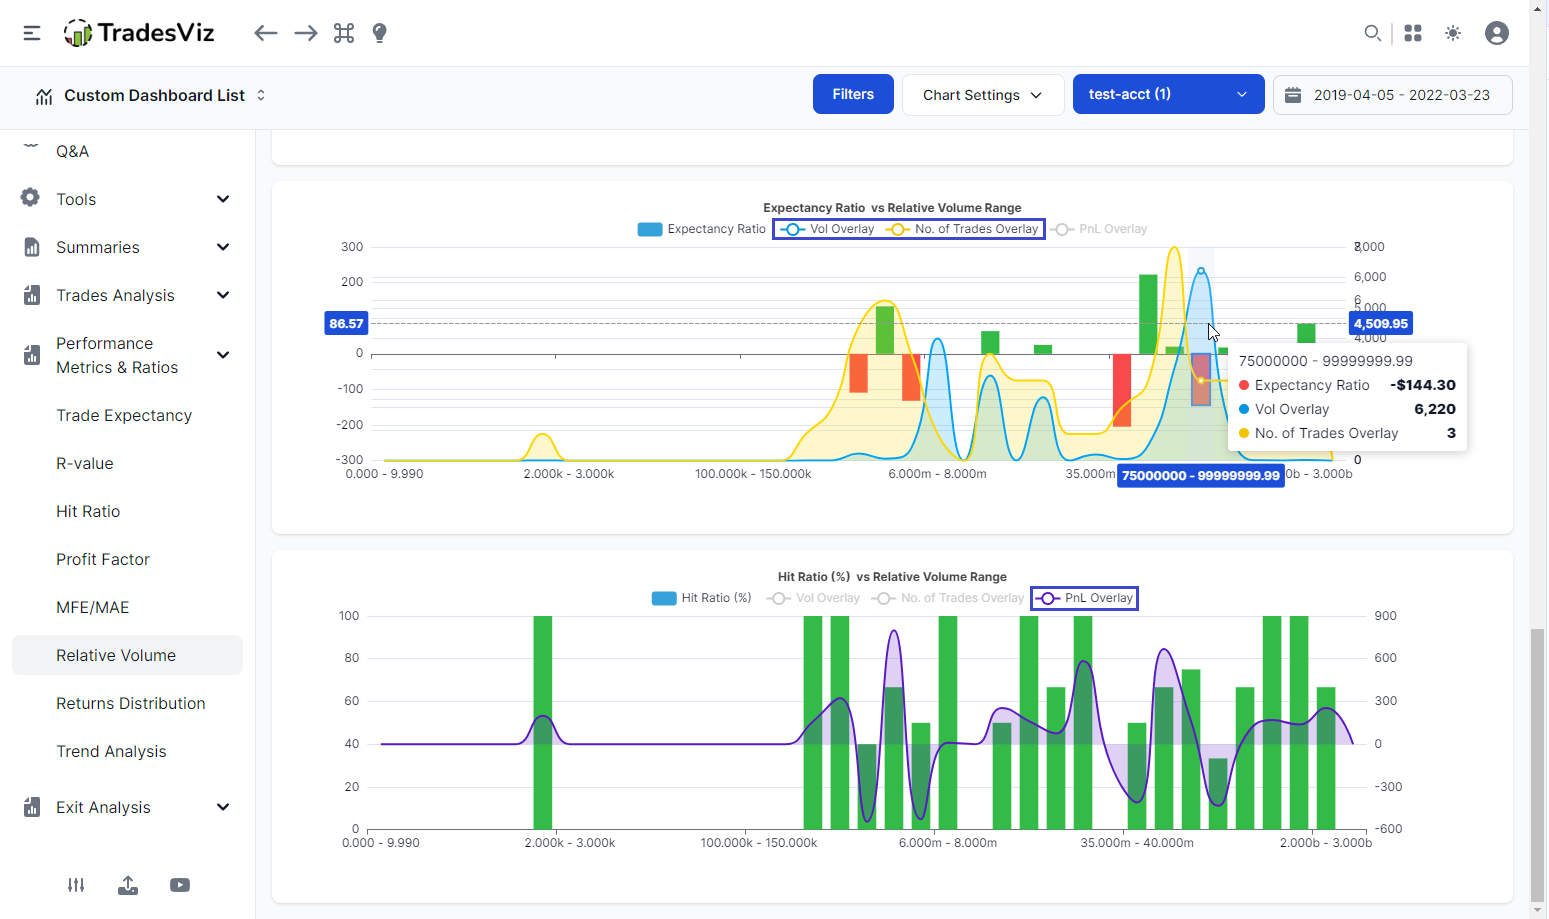
- Expectancy Ratio vs Relative Volume Range
- Hit Ratio (%) vs Relative Volume Range
All the data about relative volume are used here in the visualizations. You might have seen charts with an X-axis such as price range, volume range, time, etc., but this is the first time we are using the relative volume of the underlying at the time of your trade.
All the charts below share the same features as other charts you see in TradesViz, - they can be zoomed, panned, explored (drill-down), overlayed with different data, and more. Screenshots of the page:
Here's a 60-sec video that shows all of this, the drill-down features, and more:
How can you use this data?
Before we get into specific use cases, here are some things to remember:
- Filter by specific asset type or even better, specific symbols using the global filters for best results.
Why? It makes no sense to compare and look at the stats when you have trades from say, penny stocks (vol < 5k) and large caps (vol in 100k's) in the same chart or to look at futures volume and stock volume together.
- Make sure you are aware of what timeframe's relative volume you are using. At the top of the tab, you will see settings to choose what timeframe you want to view.
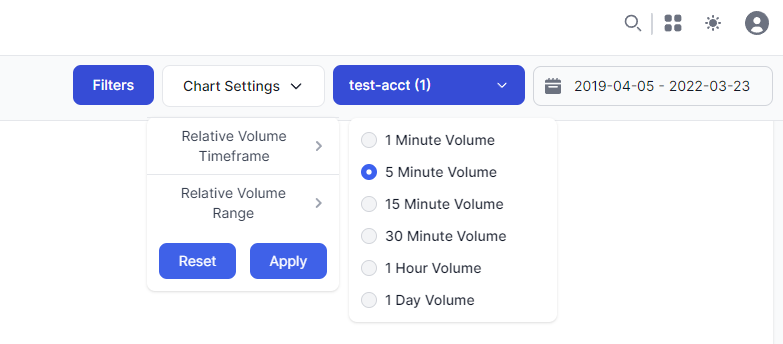
This is so that you have a basic idea of what volume range to expect. For example, expect to see volume in millions when viewing a 1-day timeframe, whereas, a 1-minute volume can be in the thousands to low few hundred thousand.
- For all derivatives, only the underlying's volume is used. If underlying's volume is not available, you will not see it as part of the stats at all.
Now that you have understood what the data is, and how it is derived, processed, and visualized, let's get to its usage.
Here's a question:
Many trading strategies involve the usage of ATR (Average trading range) and volume. These are not "fancy" indicators, but basic metrics that tell a trader what type of price movement they can expect to see on a given day.
For ALL traders, we would say, ATR and volume has an effect on their trading.
Why?
Depending on your strategy, you may do well when there is a lot of volatility - i.e., price fluctuates A LOT. Now, price fluctuations cannot happen without a lot of buying and selling. What does this imply? This implies that for scenarios when there ATR or volatility is high, higher than usual volume is accompanied by it or rather, is a pre-requisite for such a condition.
If you have understood all of the above, you will start to realize how relative volume can be helpful - indirectly, it tells you how well you trade in different market conditions.
This is why we emphasize filtering by a specific asset type or symbol when analyzing your relative volume stats.
Here's an example where we filter ONLY by ES futures trades and view the relative volume stats with 15 ranges in a 5-minute timeframe:
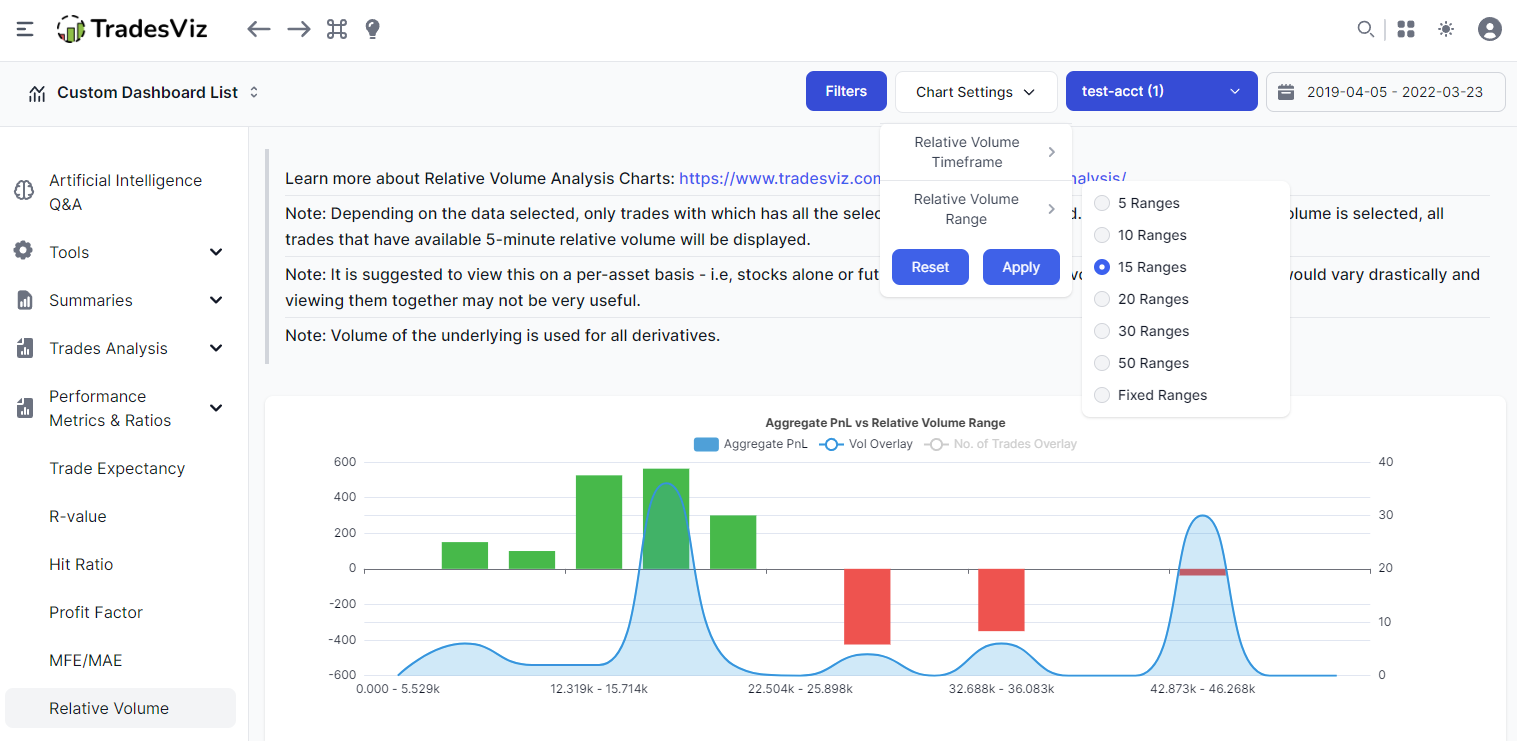
We have a clear insight here.
First, why are we using 15 ranges instead of the default fixed ranges? because the default range will put this under just 2 large bins whereas the 15 bins or any specific bin size looks at the min/max of the data and creates as many bins as specified. This allows us to take a more fine-grained look at the stats so that we can see the trends clearly.
Now, the divide between 0 to 22k and 22k+ relative is the takeaway here. To put it into words, the performance of these ES trades has been better than when the volume is higher than 22k.
What it means is that we should be more careful and consider other factors such as ATR when trading market conditions with similar relative volume ranges.
This data and visualization gives you additional information on how to prepare for a day given the current market conditions and when you (based on your own historical data) have better odds of winning based on relative volume.
This is *one* way to use relative volume statistics on TradesViz.
Now imagine being able to do this for ANY symbol you trade.
That's why we wanted to introduce this data and visualization for it. This works for ALL asset types as long as we have the underlying data for it - that means, this is supported for stocks, options, and futures, from all supported exchanges in the US, CA, IN, AU, and also cryptocurrency and forex.
To effectively use this feature, you need to know what you trade, be able to filter for specific symbols or asset types, and use appropriate ranges and the preferred timeframe based on your trading style. Don't worry if you don't immediately understand all of this. At TradesViz, all of our metrics are carefully designed and released only after testing their usefulness thoroughly. When relative volume visualizations are used and understood correctly, they can save you from a potentially disastrous day or encourage you to take a chance on a day that has historically worked well for you.
We hope you like exploring the relative volume visualizations on your dashboard. Let us know if you have any questions related to relative volume by emailing us at [email protected]! We plan to release a lot of improvements to features like replay, trade/day explore, trade/day plans, and more in the coming weeks. Stay tuned!