
When we first introduced seasonality charts back in 2022, TradesViz became the first trading journal to offer seasonality analysis for over 20,000 symbols. Then we added seasonality portfolios - letting you combine multiple tickers into a single seasonal view. Now, we've taken it several steps further.
The seasonality page has been completely revamped with five powerful tabs: Returns, Screener, Heatmap, vs. My Trades, and Sector Rotation. Each one is designed to help you find, validate, and act on seasonal patterns faster than ever.
With traders seeking new ways to trade, seasonality anlaysis has served as a reminder that even if history does not repeat, it does often rhyme...
We expanded the seasonality tool to provide traders with more knowledge on what types of opportunities one can look for at every month/season.
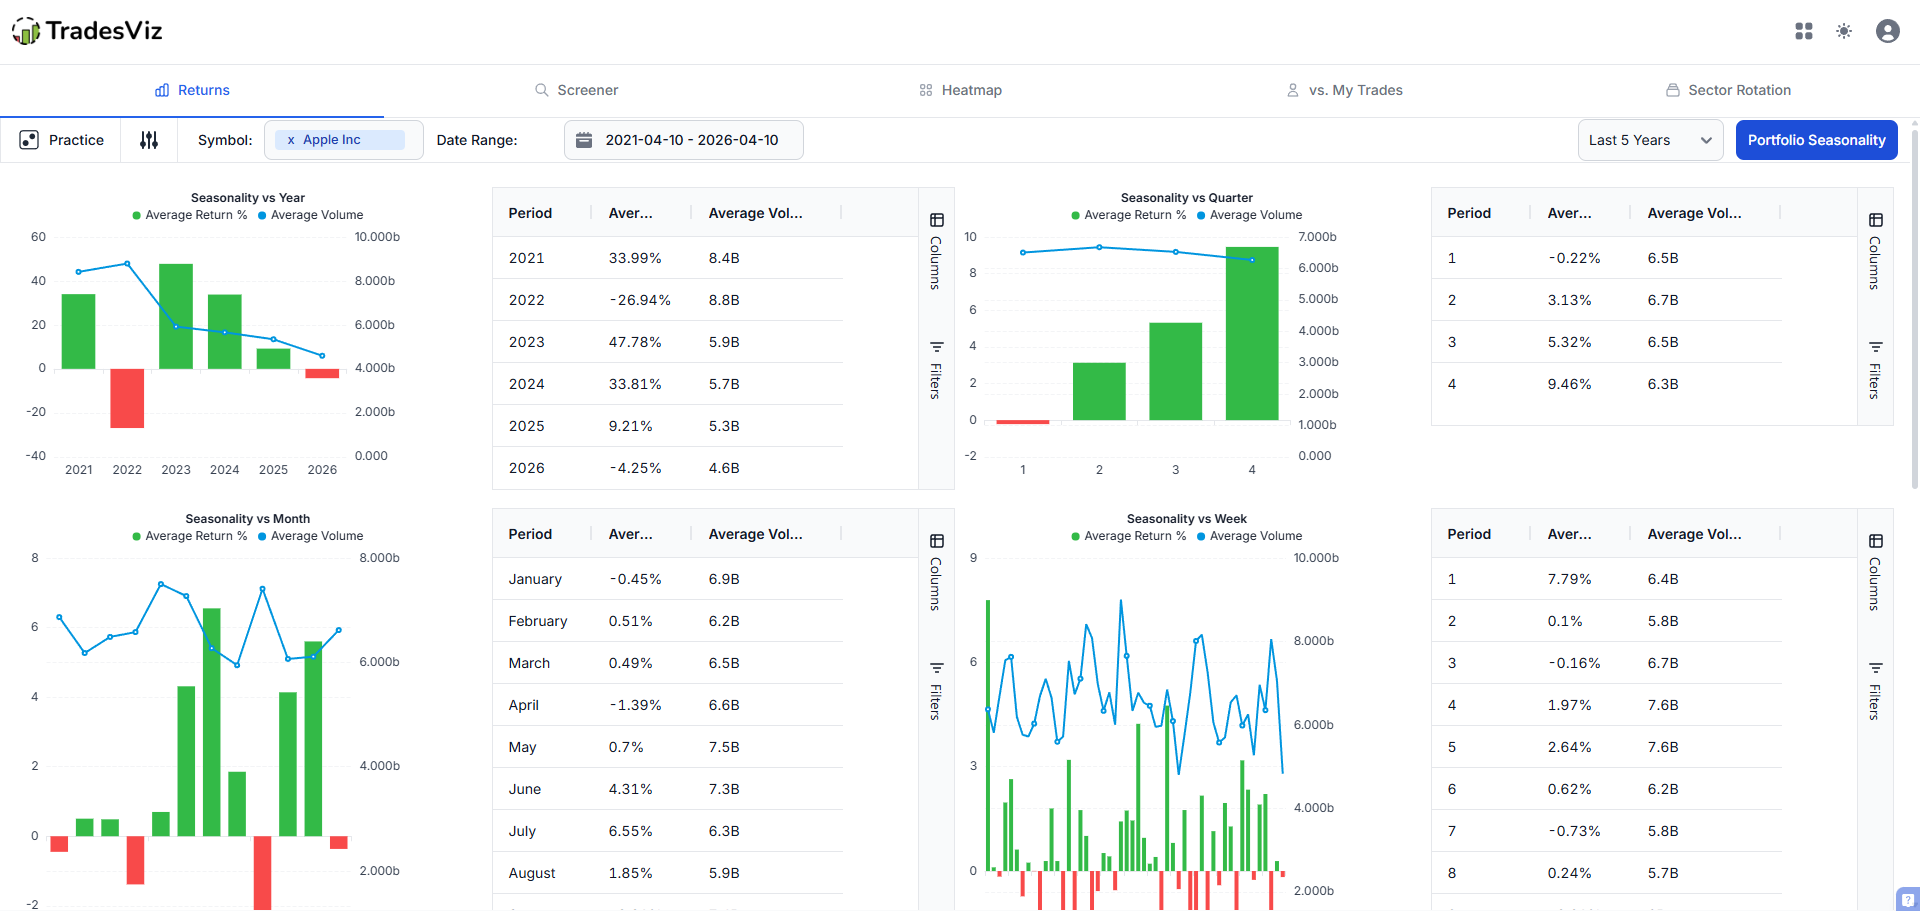
Let's walk through each new feature.
Seasonality Screener
This is the biggest addition. Instead of checking symbols one at a time, the screener lets you scan thousands of stocks at once to find the ones with the strongest seasonal tendencies right now.
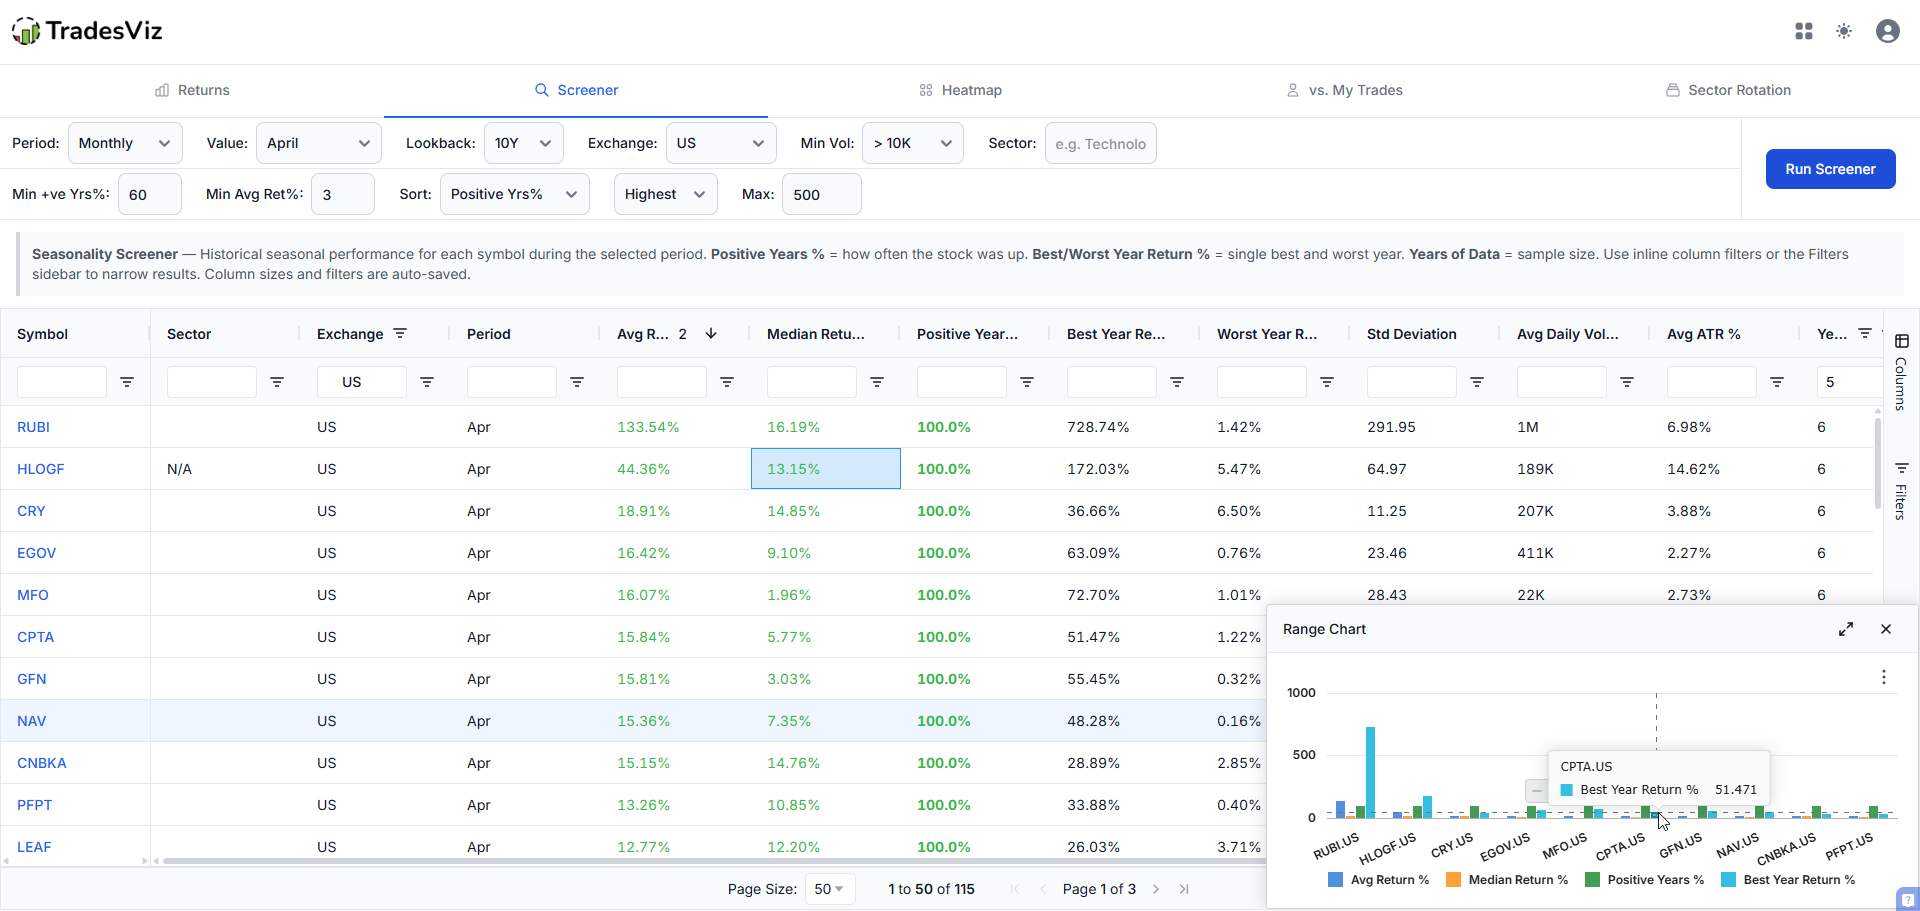
You can filter by:
- Period type: monthly, quarterly, or weekly
- Lookback window: 5, 10, or 20 years of historical data
- Exchange: US, India, Canada, or Australia
- Minimum average daily volume: filter out illiquid names
- Sector: focus on specific industries
- Minimum positive years %: how consistently a stock goes up during that period
- Minimum average return %: set a return threshold
Results load in a fast, sortable grid with inline column filters. You can sort by positive years %, average return, median return, volume, or standard deviation. The grid also shows you the best year return, worst year return, and years of data (sample size) for every result, so you can immediately gauge how reliable a seasonal pattern is.
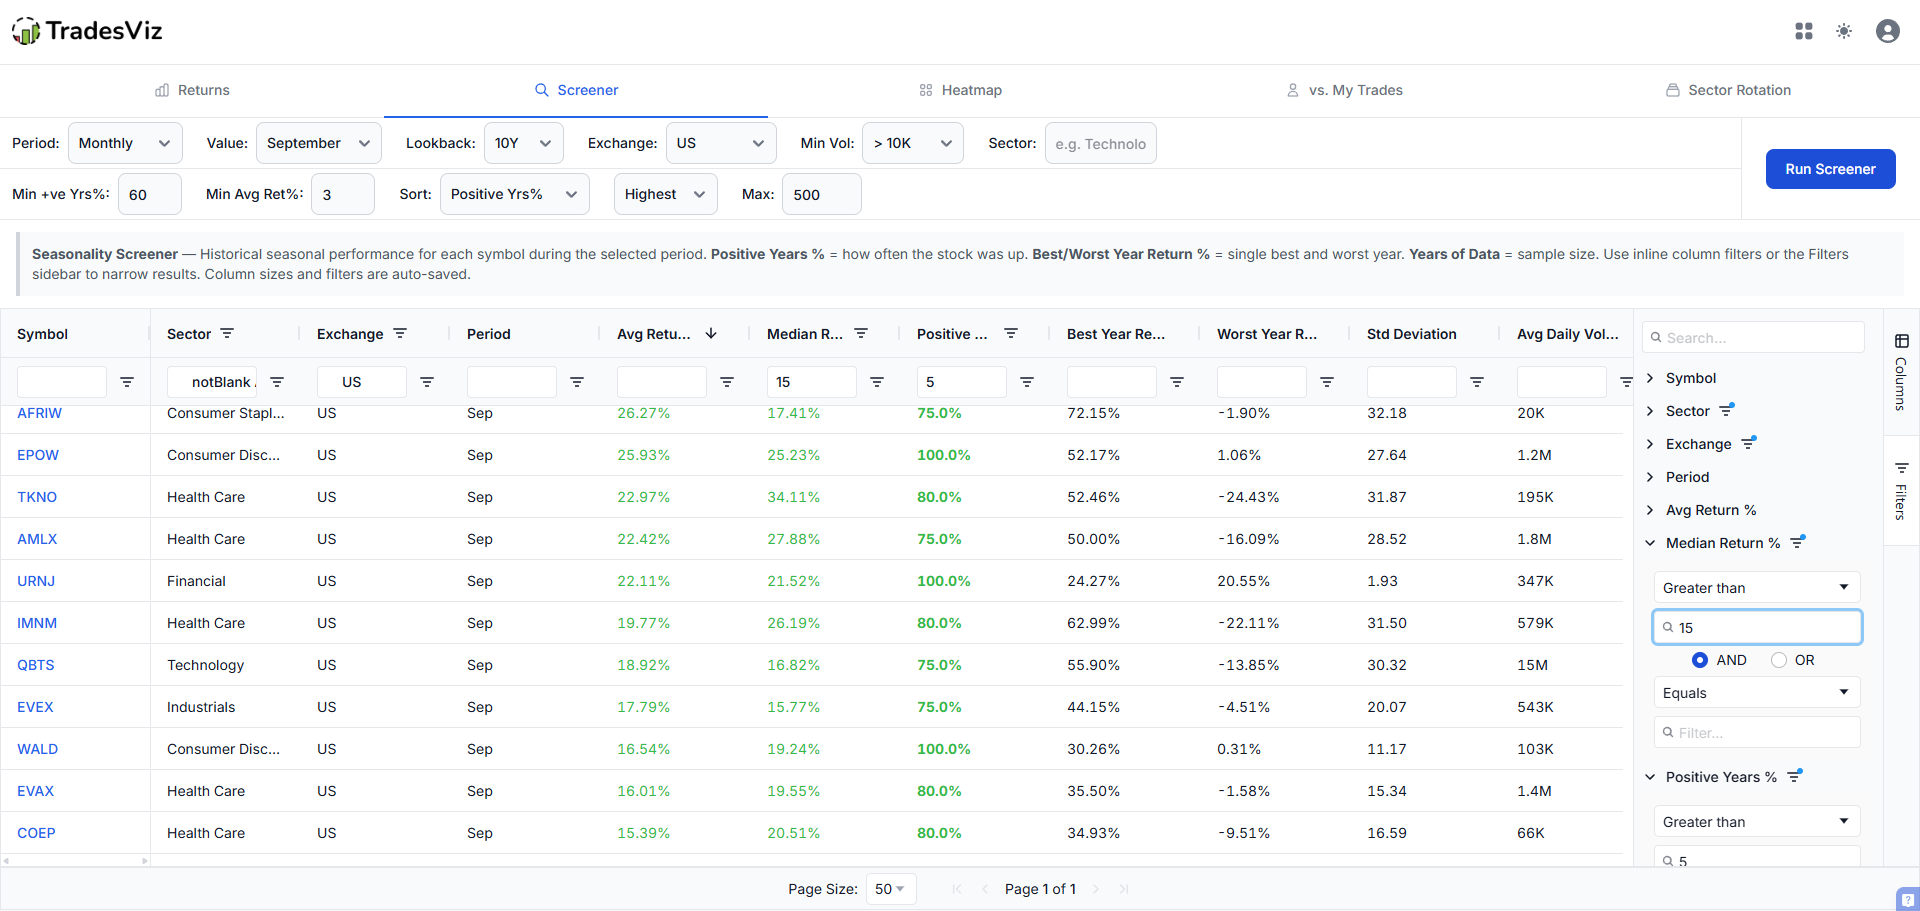
The best part? Click any symbol in the screener, and it instantly loads that symbol's full seasonality charts in the Returns tab — no page reload, no navigation. You go from screening to deep-diving into a pattern in one click.
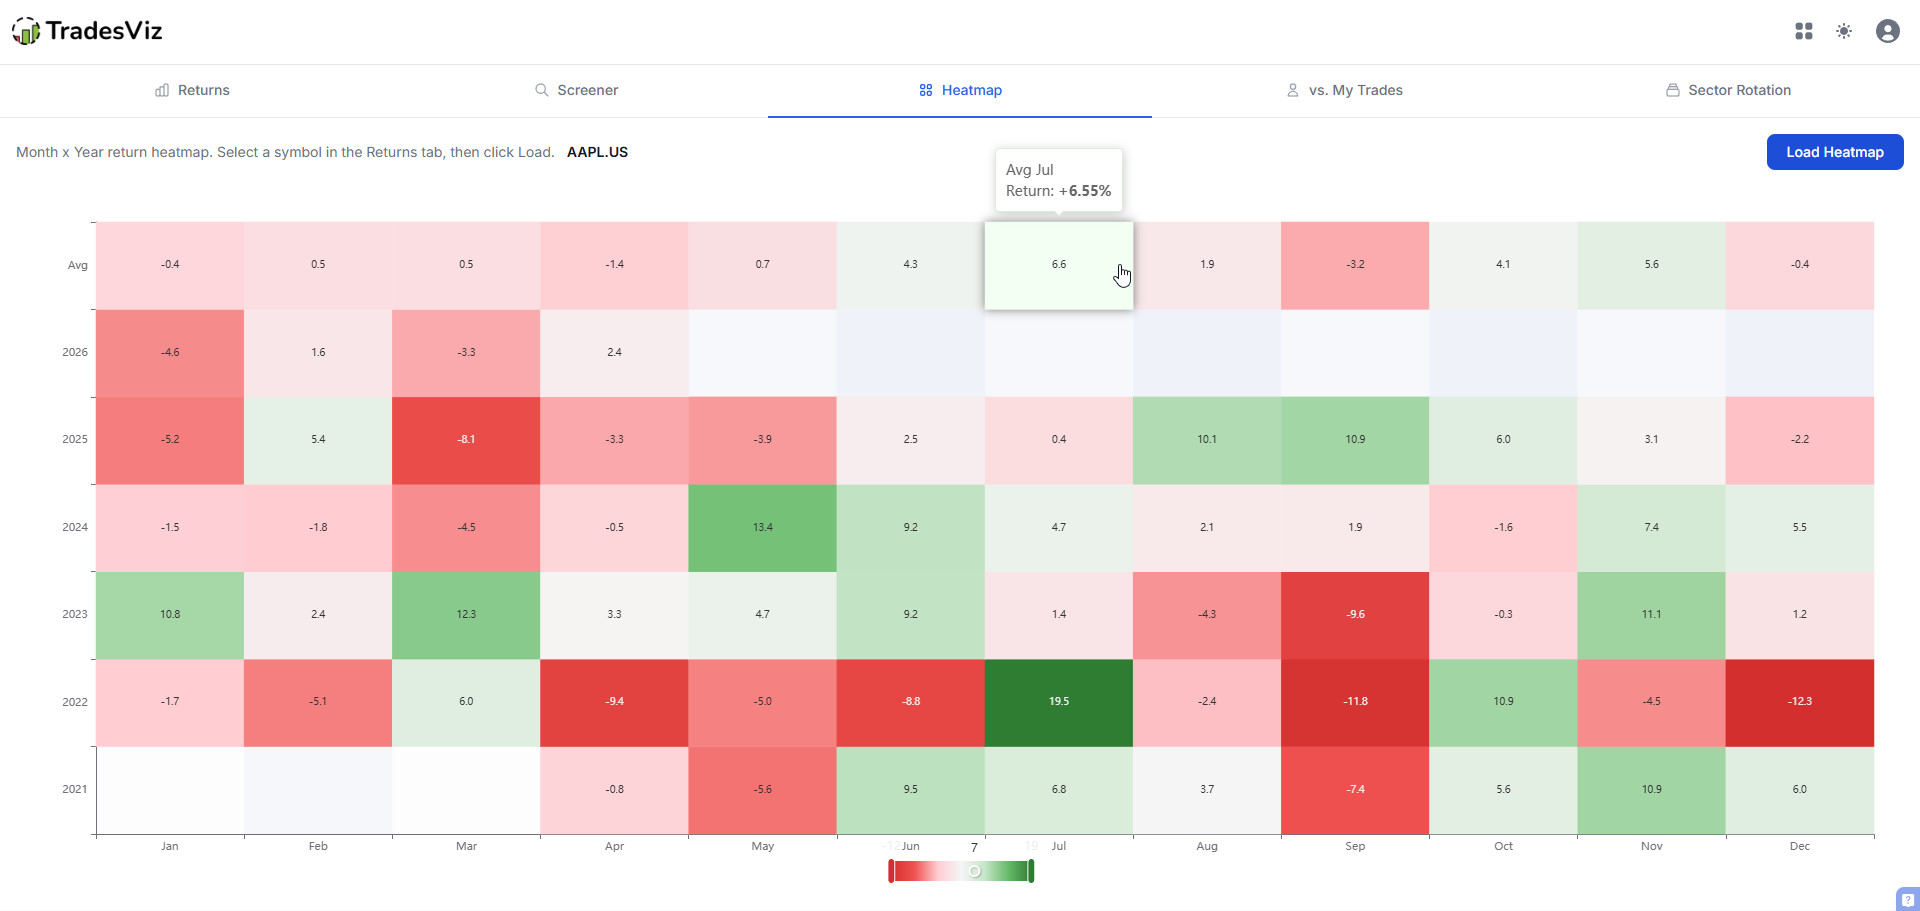
Month x Year Heatmap
The heatmap tab shows every year's return for a symbol in a color-coded grid. Instantly spot which months are consistently green, which are red, and whether the pattern is strengthening or fading over time.
This is incredibly useful for validation. When the screener tells you a stock goes up in November 80% of the time, the heatmap shows you which years it went up, how big the moves were, and whether there are any recent changes in the pattern. A pattern driven by one or two outlier years looks very different from a consistent trend across 10+ years.
vs. My Trades (Performance Mirror)
This is unique to TradesViz. The "vs. My Trades" tab overlays your actual trading performance by month against the market's seasonal pattern for any symbol.
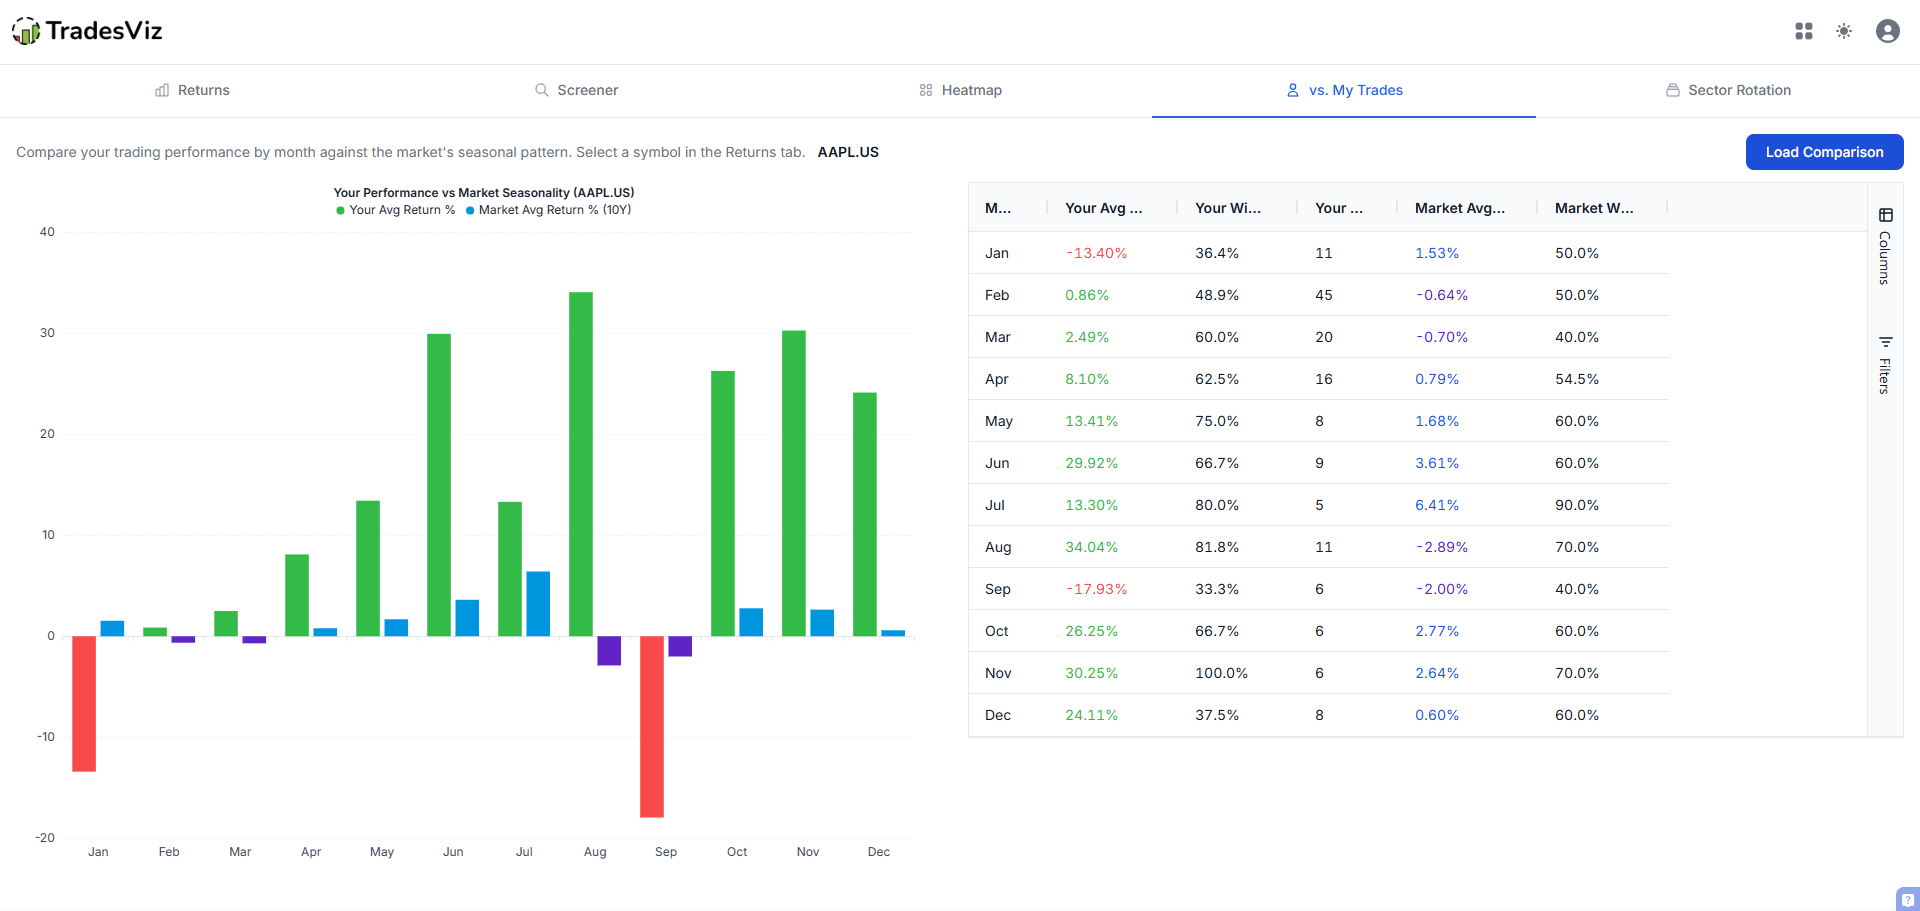
Are you trading with the seasonal trend or against it? Are there months where you consistently underperform the seasonal average? This kind of comparison can reveal timing issues or opportunities you might be missing. Select any symbol you've traded in the Returns tab, then check this tab to see the overlay.
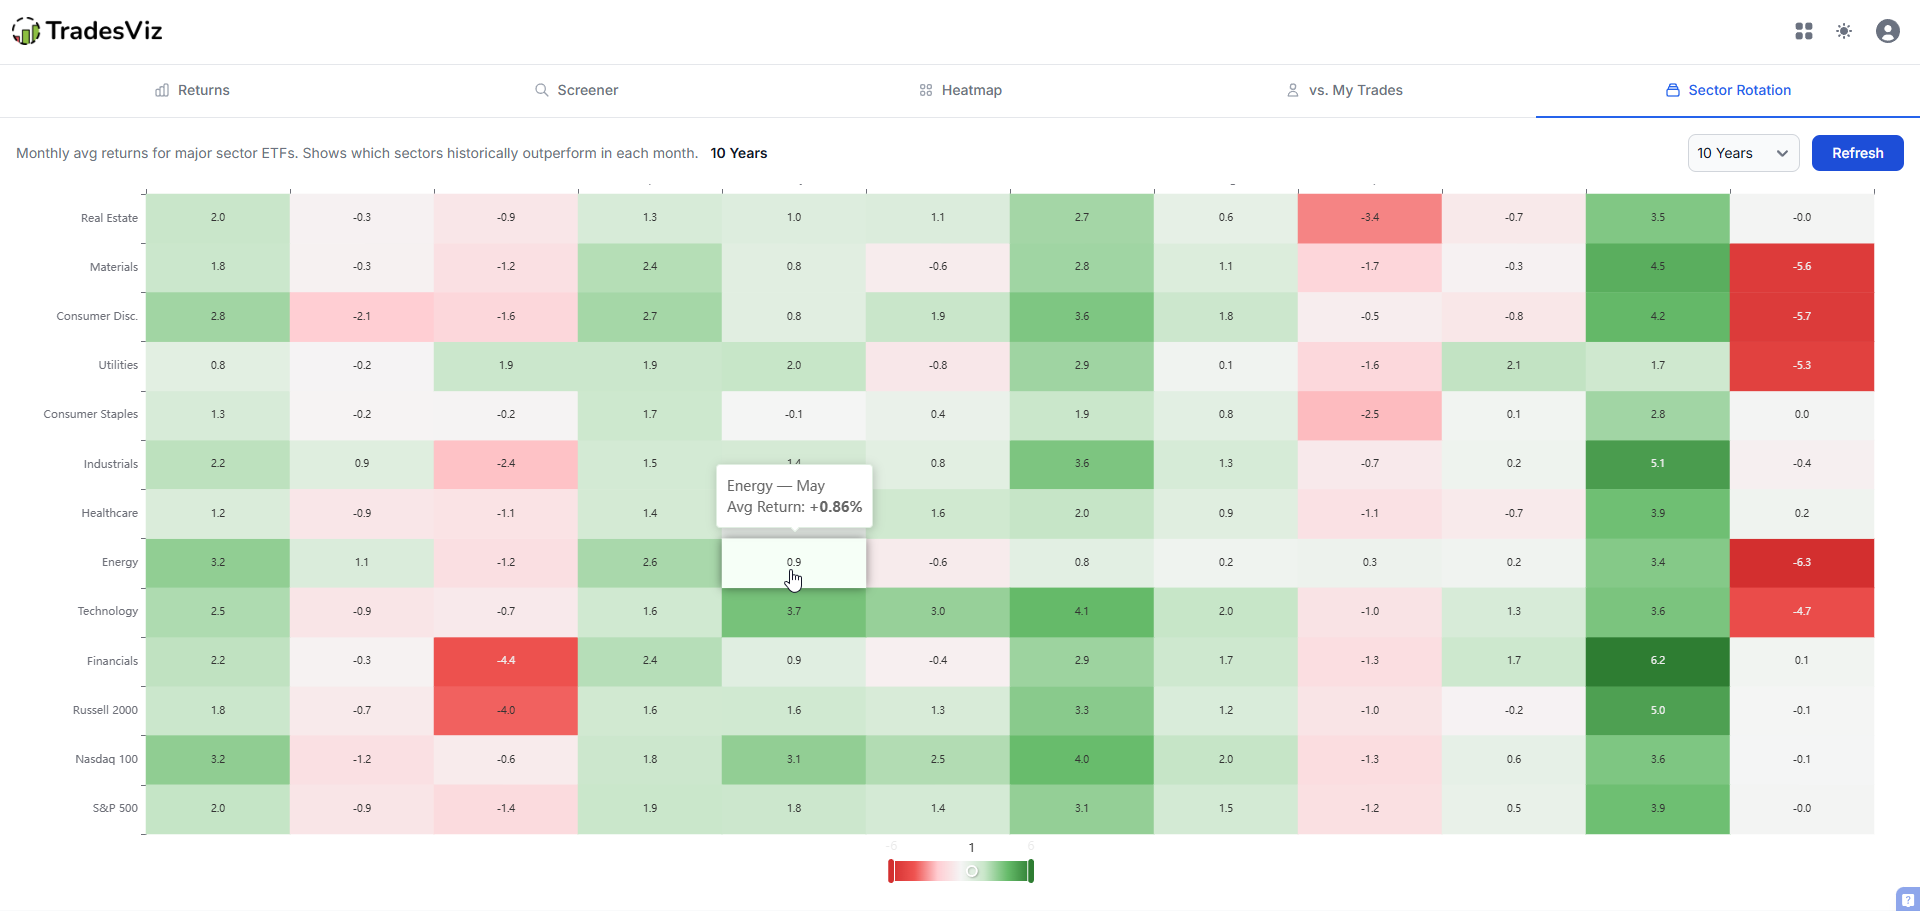
Sector Rotation
The sector rotation tab shows a heatmap of monthly average returns across major sector ETFs. At a glance, see which sectors historically outperform in each month - useful for sector rotation strategies or simply understanding where institutional money tends to flow seasonally.
You can configure the lookback period (5, 10, or 20 years) to see how these rotations look over different time horizons.
Adjusted Prices
Under the hood, all return calculations now use split and dividend-adjusted prices when available, falling back to unadjusted data when not. This means the returns you see in the screener match what you'd actually experience holding the stock - no phantom returns from stock splits or special dividends skewing the numbers.
How to Use This in Your Trading
Here's a practical workflow that ties the new seasonality tools together with TradesViz's other features:
1. Find seasonal setups with the Screener
Run the screener for the current month or the upcoming period you're interested in. Filter for stocks with 40%+ positive years and a positive average return. That's your starting watchlist.
2. Validate with the Heatmap
Click into a symbol from the screener. Check the heatmap. Is the pattern consistent across years or driven by a few outlier years? Look at the standard deviation and sample size to gauge reliability.
3. Build a seasonal portfolio
Found several names with complementary seasonal patterns? Use the Seasonality Portfolios feature to combine them - long the ones with seasonal tailwinds, short the ones with headwinds, and visualize the combined seasonal return.
4. Backtest the idea
Take your seasonal candidates to the Backtester (guide). Set up a simple strategy and enter at the start of the strong seasonal window, exit at the end. See how it would have performed with real entry/exit timing using 70+ built-in indicators.
5. Practice the execution
Use the Trading Simulator (guide) to replay historical price action during that seasonal window. Practice entries, exits, and position sizing with real tick data at up to 100x speed. Available for stocks, futures, forex, and options.
6. Optimize your exits
Already trading a seasonal pattern? Run your historical trades through the TP/SL Simulator to replay them with different stop-loss and take-profit rules. See if tighter stops or wider targets would have improved your results during seasonal windows.
7. Compare against your actual performance
Use the vs. My Trades tab to see how your real trading lines up with the seasonal pattern. If you're consistently underperforming the seasonal trend, it might be an execution or timing issue worth investigating.
Other TradesViz Tools to Pair With Seasonality
Seasonality works best when combined with other analysis. Here's a quick reference of tools that complement seasonal research:
- Options Flow Dashboard (guide): see if smart money is aligning with the seasonal pattern via unusual options activity
- Options Flow Scanner: scan for unusual activity on your seasonal watchlist
- Real-Time Stock Screener (guide): add intraday technical confirmation to seasonal setups
- Trade Replay: replay your actual trades during seasonal periods to study execution
- Options Simulator (guide): practice spreads and multi-leg strategies on seasonal names
- Trading Notes: document what you learn about seasonal patterns for future reference
As always, let us know your feedback and ideas by emailing us at [email protected]. We have more improvements planned for the seasonality suite and the other tools of TradesViz. This is just the beginning.